

fdi in india and its growth linkages - Department Of Industrial Policy ...
fdi in india and its growth linkages - Department Of Industrial Policy ...
fdi in india and its growth linkages - Department Of Industrial Policy ...

Create successful ePaper yourself
Turn your PDF publications into a flip-book with our unique Google optimized e-Paper software.
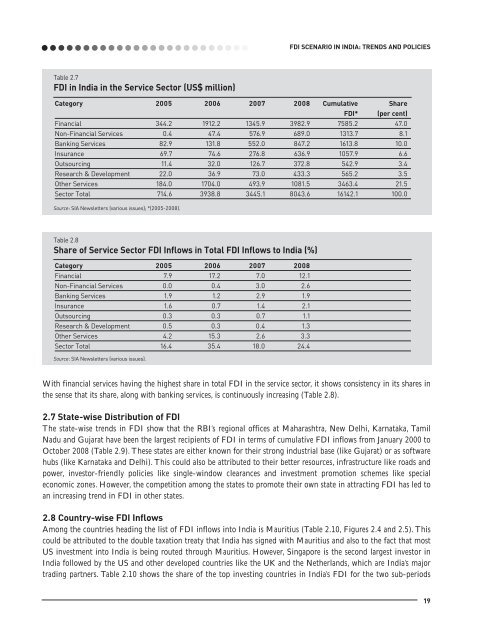
Table 2.7<br />
FDI <strong>in</strong> India <strong>in</strong> the Service Sector (US$ million)<br />
FDI SCENARIO IN INDIA: TRENDS AND POLICIES<br />
Category 2005 2006 2007 2008 Cumulative Share<br />
FDI* (per cent)<br />
F<strong>in</strong>ancial 344.2 1912.2 1345.9 3982.9 7585.2 47.0<br />
Non-F<strong>in</strong>ancial Services 0.4 47.4 576.9 689.0 1313.7 8.1<br />
Bank<strong>in</strong>g Services 82.9 131.8 552.0 847.2 1613.8 10.0<br />
Insurance 69.7 74.6 276.8 636.9 1057.9 6.6<br />
Outsourc<strong>in</strong>g 11.4 32.0 126.7 372.8 542.9 3.4<br />
Research & Development 22.0 36.9 73.0 433.3 565.2 3.5<br />
Other Services 184.0 1704.0 493.9 1081.5 3463.4 21.5<br />
Sector Total 714.6 3938.8 3445.1 8043.6 16142.1 100.0<br />
Source: SIA Newsletters (various issues); *(2005-2008).<br />
Table 2.8<br />
Share of Service Sector FDI Inflows <strong>in</strong> Total FDI Inflows to India (%)<br />
Category 2005 2006 2007 2008<br />
F<strong>in</strong>ancial 7.9 17.2 7.0 12.1<br />
Non-F<strong>in</strong>ancial Services 0.0 0.4 3.0 2.6<br />
Bank<strong>in</strong>g Services 1.9 1.2 2.9 1.9<br />
Insurance 1.6 0.7 1.4 2.1<br />
Outsourc<strong>in</strong>g 0.3 0.3 0.7 1.1<br />
Research & Development 0.5 0.3 0.4 1.3<br />
Other Services 4.2 15.3 2.6 3.3<br />
Sector Total 16.4 35.4 18.0 24.4<br />
Source: SIA Newsletters (various issues).<br />
With f<strong>in</strong>ancial services hav<strong>in</strong>g the highest share <strong>in</strong> total FDI <strong>in</strong> the service sector, it shows consistency <strong>in</strong> <strong>its</strong> shares <strong>in</strong><br />
the sense that <strong>its</strong> share, along with bank<strong>in</strong>g services, is cont<strong>in</strong>uously <strong>in</strong>creas<strong>in</strong>g (Table 2.8).<br />
2.7 State-wise Distribution of FDI<br />
The state-wise trends <strong>in</strong> FDI show that the RBI’s regional offices at Maharashtra, New Delhi, Karnataka, Tamil<br />
Nadu <strong>and</strong> Gujarat have been the largest recipients of FDI <strong>in</strong> terms of cumulative FDI <strong>in</strong>flows from January 2000 to<br />
October 2008 (Table 2.9). These states are either known for their strong <strong>in</strong>dustrial base (like Gujarat) or as software<br />
hubs (like Karnataka <strong>and</strong> Delhi). This could also be attributed to their better resources, <strong>in</strong>frastructure like roads <strong>and</strong><br />
power, <strong>in</strong>vestor-friendly policies like s<strong>in</strong>gle-w<strong>in</strong>dow clearances <strong>and</strong> <strong>in</strong>vestment promotion schemes like special<br />
economic zones. However, the competition among the states to promote their own state <strong>in</strong> attract<strong>in</strong>g FDI has led to<br />
an <strong>in</strong>creas<strong>in</strong>g trend <strong>in</strong> FDI <strong>in</strong> other states.<br />
2.8 Country-wise FDI Inflows<br />
Among the countries head<strong>in</strong>g the list of FDI <strong>in</strong>flows <strong>in</strong>to India is Mauritius (Table 2.10, Figures 2.4 <strong>and</strong> 2.5). This<br />
could be attributed to the double taxation treaty that India has signed with Mauritius <strong>and</strong> also to the fact that most<br />
US <strong>in</strong>vestment <strong>in</strong>to India is be<strong>in</strong>g routed through Mauritius. However, S<strong>in</strong>gapore is the second largest <strong>in</strong>vestor <strong>in</strong><br />
India followed by the US <strong>and</strong> other developed countries like the UK <strong>and</strong> the Netherl<strong>and</strong>s, which are India’s major<br />
trad<strong>in</strong>g partners. Table 2.10 shows the share of the top <strong>in</strong>vest<strong>in</strong>g countries <strong>in</strong> India’s FDI for the two sub-periods<br />
19


