

fdi in india and its growth linkages - Department Of Industrial Policy ...
fdi in india and its growth linkages - Department Of Industrial Policy ...
fdi in india and its growth linkages - Department Of Industrial Policy ...

Create successful ePaper yourself
Turn your PDF publications into a flip-book with our unique Google optimized e-Paper software.
FDI IN INDIA AND ITS GROWTH LINKAGES<br />
revised <strong>in</strong> 2000 <strong>in</strong> order to align the FDI data-report<strong>in</strong>g system with <strong>in</strong>ternational best practices. Table 2.3 presents the<br />
revised <strong>in</strong>flows from the year 2000-01.<br />
The revised practice of report<strong>in</strong>g FDI statistics addressed the issue of underestimated FDI flows <strong>in</strong>to India. Follow<strong>in</strong>g<br />
the new exercise that <strong>in</strong>cluded figures on re<strong>in</strong>vested earn<strong>in</strong>gs <strong>and</strong> other capital, the additional FDI <strong>in</strong> a given year was<br />
found to be as high as 72 per cent for the year 2000-01 <strong>and</strong> 57 per cent <strong>in</strong> 2001-02 (Table 2.3).<br />
The equity <strong>in</strong>flows have been differentiated under equity <strong>in</strong>flows of <strong>in</strong>corporated bodies <strong>and</strong> equity <strong>in</strong>flows of<br />
un<strong>in</strong>corporated bodies. A comparison between the earlier period of 2000-01 <strong>and</strong> the latest available period of 2008-09<br />
shows that the equity capital <strong>in</strong>flows of <strong>in</strong>corporated bodies cont<strong>in</strong>ue to dom<strong>in</strong>ate the scene. The share <strong>in</strong>creased to 86<br />
per cent of total FDI <strong>in</strong>flows <strong>in</strong> 2008-09, as aga<strong>in</strong>st 58 per cent <strong>in</strong> 2000-01. The re<strong>in</strong>vested earn<strong>in</strong>gs are the second most<br />
important component, though their significance has decl<strong>in</strong>ed almost cont<strong>in</strong>uously over the period. In 2008-09,<br />
re<strong>in</strong>vested earn<strong>in</strong>gs constituted 14 per cent of the total FDI <strong>in</strong>flows compared to 33.5 per cent <strong>in</strong> 2000-01. Inflows<br />
through other capital (which <strong>in</strong>clude short-term <strong>and</strong> long-term <strong>in</strong>ter-corporate borrow<strong>in</strong>gs, trade <strong>and</strong> supplier credit,<br />
f<strong>in</strong>ancial leas<strong>in</strong>g, f<strong>in</strong>ancial derivatives, debt securities, <strong>and</strong> l<strong>and</strong> <strong>and</strong> build<strong>in</strong>gs) constituted 3.2 per cent <strong>in</strong> 2008-09 as<br />
aga<strong>in</strong>st 6.9 per cent dur<strong>in</strong>g 2000-01. The equity capital <strong>in</strong>flows of <strong>in</strong>corporated bodies cont<strong>in</strong>ue to be nearly the same,<br />
14<br />
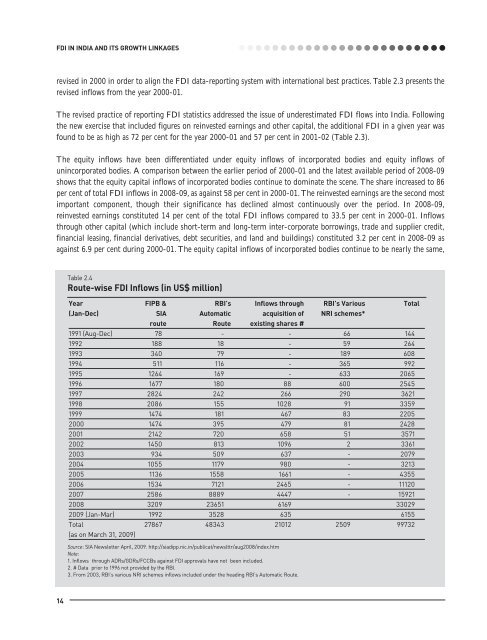
Table 2.4<br />
Route-wise FDI Inflows (<strong>in</strong> US$ million)<br />
Year FIPB & RBI’s Inflows through RBI’s Various Total<br />
(Jan-Dec) SIA Automatic acquisition of NRI schemes*<br />
route Route exist<strong>in</strong>g shares #<br />
1991 (Aug-Dec) 78 - - 66 144<br />
1992 188 18 - 59 264<br />
1993 340 79 - 189 608<br />
1994 511 116 - 365 992<br />
1995 1264 169 - 633 2065<br />
1996 1677 180 88 600 2545<br />
1997 2824 242 266 290 3621<br />
1998 2086 155 1028 91 3359<br />
1999 1474 181 467 83 2205<br />
2000 1474 395 479 81 2428<br />
2001 2142 720 658 51 3571<br />
2002 1450 813 1096 2 3361<br />
2003 934 509 637 - 2079<br />
2004 1055 1179 980 - 3213<br />
2005 1136 1558 1661 - 4355<br />
2006 1534 7121 2465 - 11120<br />
2007 2586 8889 4447 - 15921<br />
2008 3209 23651 6169 33029<br />
2009 (Jan-Mar) 1992 3528 635 6155<br />
Total 27867 48343 21012 2509 99732<br />
(as on March 31, 2009)<br />
Source: SIA Newsletter April, 2009. http://siadipp.nic.<strong>in</strong>/publicat/newslttr/aug2008/<strong>in</strong>dex.htm<br />
Note:<br />
1. Inflows through ADRs/GDRs/FCCBs aga<strong>in</strong>st FDI approvals have not been <strong>in</strong>cluded.<br />
2. # Data prior to 1996 not provided by the RBI.<br />
3. From 2003, RBI’s various NRI schemes <strong>in</strong>flows <strong>in</strong>cluded under the head<strong>in</strong>g RBI’s Automatic Route.


