The European Pharmaceutical Wholesale Industry: - phagro
The European Pharmaceutical Wholesale Industry: - phagro
The European Pharmaceutical Wholesale Industry: - phagro
You also want an ePaper? Increase the reach of your titles
YUMPU automatically turns print PDFs into web optimized ePapers that Google loves.
<strong>The</strong> <strong>European</strong> <strong>Pharmaceutical</strong> <strong>Wholesale</strong> <strong>Industry</strong><br />
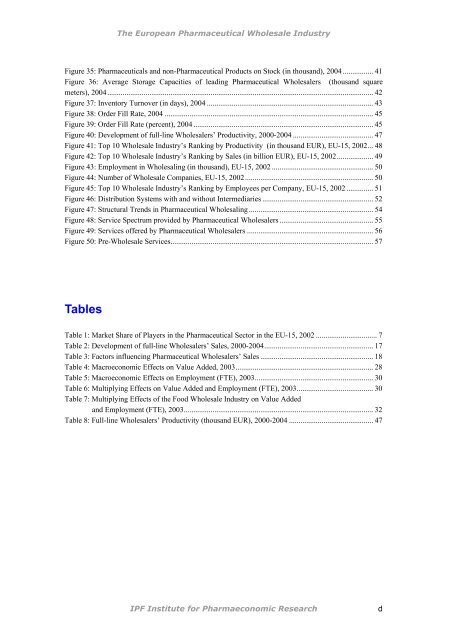
Figure 35: <strong>Pharmaceutical</strong>s and non-<strong>Pharmaceutical</strong> Products on Stock (in thousand), 2004 ................ 41<br />
Figure 36: Average Storage Capacities of leading <strong>Pharmaceutical</strong> <strong>Wholesale</strong>rs (thousand square<br />
meters), 2004........................................................................................................................................... 42<br />
Figure 37: Inventory Turnover (in days), 2004 ....................................................................................... 43<br />
Figure 38: Order Fill Rate, 2004 ............................................................................................................. 45<br />
Figure 39: Order Fill Rate (percent), 2004 .............................................................................................. 45<br />
Figure 40: Development of full-line <strong>Wholesale</strong>rs’ Productivity, 2000-2004 .......................................... 47<br />
Figure 41: Top 10 <strong>Wholesale</strong> <strong>Industry</strong>’s Ranking by Productivity (in thousand EUR), EU-15, 2002... 48<br />
Figure 42: Top 10 <strong>Wholesale</strong> <strong>Industry</strong>’s Ranking by Sales (in billion EUR), EU-15, 2002................... 49<br />
Figure 43: Employment in Wholesaling (in thousand), EU-15, 2002 ..................................................... 50<br />
Figure 44: Number of <strong>Wholesale</strong> Companies, EU-15, 2002................................................................... 50<br />
Figure 45: Top 10 <strong>Wholesale</strong> <strong>Industry</strong>’s Ranking by Employees per Company, EU-15, 2002 .............. 51<br />
Figure 46: Distribution Systems with and without Intermediaries .......................................................... 52<br />
Figure 47: Structural Trends in <strong>Pharmaceutical</strong> Wholesaling ................................................................. 54<br />
Figure 48: Service Spectrum provided by <strong>Pharmaceutical</strong> <strong>Wholesale</strong>rs ................................................. 55<br />
Figure 49: Services offered by <strong>Pharmaceutical</strong> <strong>Wholesale</strong>rs .................................................................. 56<br />
Figure 50: Pre-<strong>Wholesale</strong> Services.......................................................................................................... 57<br />
Tables<br />
Table 1: Market Share of Players in the <strong>Pharmaceutical</strong> Sector in the EU-15, 2002 ................................ 7<br />
Table 2: Development of full-line <strong>Wholesale</strong>rs’ Sales, 2000-2004......................................................... 17<br />
Table 3: Factors influencing <strong>Pharmaceutical</strong> <strong>Wholesale</strong>rs’ Sales ........................................................... 18<br />
Table 4: Macroeconomic Effects on Value Added, 2003........................................................................ 28<br />
Table 5: Macroeconomic Effects on Employment (FTE), 2003.............................................................. 30<br />
Table 6: Multiplying Effects on Value Added and Employment (FTE), 2003........................................ 30<br />
Table 7: Multiplying Effects of the Food <strong>Wholesale</strong> <strong>Industry</strong> on Value Added<br />
and Employment (FTE), 2003................................................................................................... 32<br />
Table 8: Full-line <strong>Wholesale</strong>rs’ Productivity (thousand EUR), 2000-2004 ............................................ 47<br />
IPF Institute for Pharmaeconomic Research d


