Read Back Signals in Magnetic Recording - Research Group Fidler
Read Back Signals in Magnetic Recording - Research Group Fidler
Read Back Signals in Magnetic Recording - Research Group Fidler

Create successful ePaper yourself
Turn your PDF publications into a flip-book with our unique Google optimized e-Paper software.
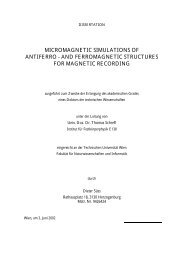
µ 0 Hsig [T]<br />
0.030<br />
0.025<br />
0.020<br />
0.015<br />
0.010<br />
0.005<br />
Analytical Calculations<br />
0.000<br />
-200 -100 0 100 200<br />
x [nm]<br />
Figure 3.4: The effective signal field as function of the relative position of the read head <strong>in</strong><br />
respect to a perfect transition (Js = 0.5 T).<br />
3.2.4 Signal of Written Bits<br />
The maximum read back signal is achieved for perfect transitions. In practice written bits do<br />
not have perfect transitions. Figure 3.5 shows the results of two record<strong>in</strong>g simulations with a<br />
head velocity of 10 m/s and 20 m/s.<br />
Figure 3.5: These two figures show the x-component of the magnetization (Js = 0.5 T) of<br />
the data layer after a write process with head velocity 10 m/s (left) and 20 m/s (right). Red<br />
color represents magnetization <strong>in</strong> positive x-direction and blue color magnetization <strong>in</strong><br />
negative x-direction. The scale is <strong>in</strong> µm, thus the bit length is approximately 40 nm. The<br />
data layer thickness is 12 nm.<br />
35