

Understanding Clinical Trial Design - Research Advocacy Network
Understanding Clinical Trial Design - Research Advocacy Network
Understanding Clinical Trial Design - Research Advocacy Network

Create successful ePaper yourself
Turn your PDF publications into a flip-book with our unique Google optimized e-Paper software.
18<br />
Statistical Inference<br />
Example<br />
UNDERSTANDING CLINICAL TRIAL DESIGN: A TUTORIAL FOR RESEARCH ADVOCATES<br />
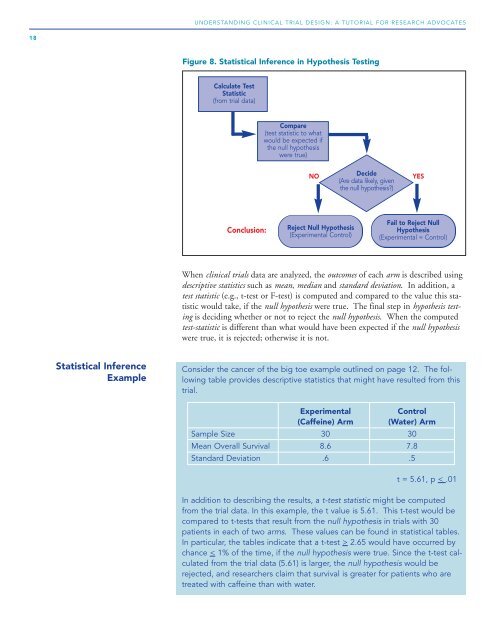
Figure 8. Statistical Inference in Hypothesis Testing<br />
Calculate Test<br />
Statistic<br />
(from trial data)<br />
Conclusion:<br />
Compare<br />
(test statistic to what<br />
would be expected if<br />
the null hypothesis<br />
were true)<br />
NO<br />
Decide<br />
(Are data likely, given<br />
the null hypothesis?)<br />
YES<br />
Reject Null Hypothesis<br />
(Experimental Control)<br />
Fail to Reject Null<br />
Hypothesis<br />
(Experimental = Control)<br />
When clinical trials data are analyzed, the outcomes of each arm is described using<br />
descriptive statistics such as mean, median and standard deviation. In addition, a<br />
test statistic (e.g., t-test or F-test) is computed and compared to the value this statistic<br />
would take, if the null hypothesis were true. The final step in hypothesis testing<br />
is deciding whether or not to reject the null hypothesis. When the computed<br />
test-statistic is different than what would have been expected if the null hypothesis<br />
were true, it is rejected; otherwise it is not.<br />
Consider the cancer of the big toe example outlined on page 12. The following<br />
table provides descriptive statistics that might have resulted from this<br />
trial.<br />
Experimental Control<br />
(Caffeine) Arm (Water) Arm<br />
Sample Size 30 30<br />
Mean Overall Survival 8.6 7.8<br />
Standard Deviation .6 .5<br />
t = 5.61, p < .01<br />
In addition to describing the results, a t-test statistic might be computed<br />
from the trial data. In this example, the t value is 5.61. This t-test would be<br />
compared to t-tests that result from the null hypothesis in trials with 30<br />
patients in each of two arms. These values can be found in statistical tables.<br />
In particular, the tables indicate that a t-test > 2.65 would have occurred by<br />
chance < 1% of the time, if the null hypothesis were true. Since the t-test calculated<br />
from the trial data (5.61) is larger, the null hypothesis would be<br />
rejected, and researchers claim that survival is greater for patients who are<br />
treated with caffeine than with water.