

Understanding Clinical Trial Design - Research Advocacy Network
Understanding Clinical Trial Design - Research Advocacy Network
Understanding Clinical Trial Design - Research Advocacy Network

You also want an ePaper? Increase the reach of your titles
YUMPU automatically turns print PDFs into web optimized ePapers that Google loves.
UNDERSTANDING CLINICAL TRIAL DESIGN: A TUTORIAL FOR RESEARCH ADVOCATES<br />
The calculation of test-statistics is beyond the scope of this tutorial. However,<br />
three factors always influence their values, and hence how likely they are to deviate<br />
from test statistics that would have been computed had the null hypothesis been<br />
true. These are:<br />
1) Sample Size: The larger the sample, the more likely the observed outcomes<br />
reflect their overall populations. The limiting case is when the entire population<br />
is part of the clinical trial. Thus, other factors being equal, the larger the sample<br />
size, the more likely the null hypothesis will be rejected.<br />
2) Variability: The less variability among patients within each group, the more<br />
likely they reflect the overall populations. In trials with low variability, trial<br />
outcome differences between experimental and control arms are likely to be real<br />
(i.e., not due to chance). Thus, other factors being equal, the null hypothesis is<br />
more likely to be rejected in trials with low variability.<br />
3) Outcome Difference: The larger the difference in outcomes between the experimental<br />
and control arms, the more likely there is a true difference, even if it is<br />
actually smaller or larger than observed in the trial. Thus, other factors being<br />
equal, the larger differences between experimental and control arms, the more<br />
likely the null hypothesis will be rejected.<br />
How unlikely would the trial results need to be to reject the null hypothesis? This<br />
rests on researchers’ tolerance for errors. The more tolerant of errors, for example,<br />
in more exploratory work, the more likely the null hypothesis will be rejected.<br />
However, it is never actually known whether or not the null hypothesis is true.<br />
Rather, researchers establish criteria to maintain specific error rates across all trials.<br />
This is what they do when they set α or type I error rates at .5%, and β or type II<br />
error rates at 20%. Figure 9 and the following text explain these potential errors<br />
in more detail. This material is a rather technical and some readers may choose<br />
to skip to the judicial example at the end of this section.<br />
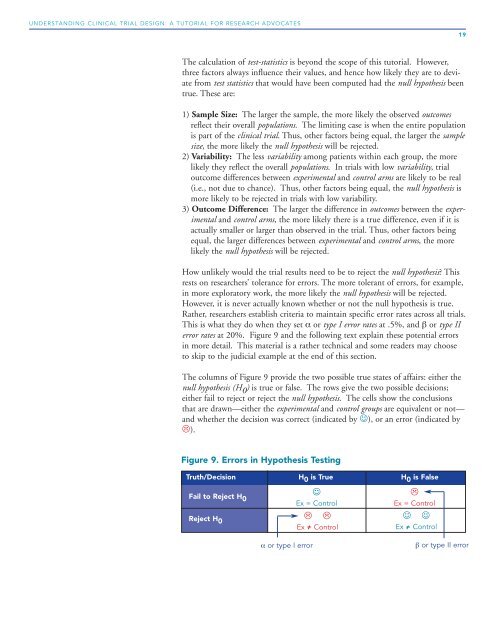
The columns of Figure 9 provide the two possible true states of affairs: either the<br />
null hypothesis (H 0 ) is true or false. The rows give the two possible decisions;<br />
either fail to reject or reject the null hypothesis. The cells show the conclusions<br />
that are drawn—either the experimental and control groups are equivalent or not—<br />
and whether the decision was correct (indicated by ☺), or an error (indicated by<br />
).<br />
Figure 9. Errors in Hypothesis Testing<br />
Truth/Decision H 0 is True H 0 is False<br />
Fail to Reject H 0<br />
Reject H 0<br />
α or type I error<br />
☺<br />
Ex = Control<br />
<br />
Ex = Control<br />
<br />
Ex = Control<br />
☺ ☺<br />
Ex = Control<br />
19<br />
β or type II error