

Koontz, J., D.G. Huggins, C.C. Freeman, D.S. Baker - Central Plains ...
Koontz, J., D.G. Huggins, C.C. Freeman, D.S. Baker - Central Plains ...
Koontz, J., D.G. Huggins, C.C. Freeman, D.S. Baker - Central Plains ...

You also want an ePaper? Increase the reach of your titles
YUMPU automatically turns print PDFs into web optimized ePapers that Google loves.
Floristic Quality Assessments<br />
Floristic Quality Assessments were conducted for all 42 sites visited during the 2008 and 2009<br />
seasons; mean and median values of plant community metrics and final Floristic Quality Indices<br />
(FQI) are reported in Table 2. Only mean values and variance in mean conservatism were found<br />
to be significantly different between sample populations of the Western Corn Belt <strong>Plains</strong> (n = 21)<br />
and <strong>Central</strong> Irregular <strong>Plains</strong> (n = 16) ecoregions based on ANOVA evaluation and Tukey-<br />
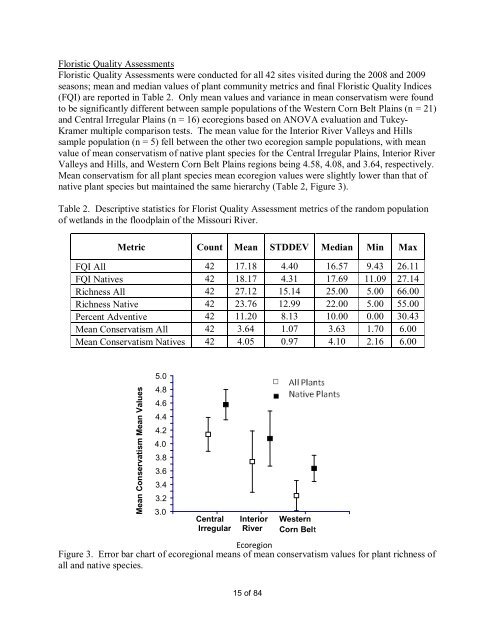
Kramer multiple comparison tests. The mean value for the Interior River Valleys and Hills<br />
sample population (n = 5) fell between the other two ecoregion sample populations, with mean<br />
value of mean conservatism of native plant species for the <strong>Central</strong> Irregular <strong>Plains</strong>, Interior River<br />
Valleys and Hills, and Western Corn Belt <strong>Plains</strong> regions being 4.58, 4.08, and 3.64, respectively.<br />
Mean conservatism for all plant species mean ecoregion values were slightly lower than that of<br />
native plant species but maintained the same hierarchy (Table 2, Figure 3).<br />
Table 2. Descriptive statistics for Florist Quality Assessment metrics of the random population<br />
of wetlands in the floodplain of the Missouri River.<br />
Metric Count Mean STDDEV Median Min Max<br />
FQI All 42 17.18 4.40 16.57 9.43 26.11<br />
FQI Natives 42 18.17 4.31 17.69 11.09 27.14<br />
Richness All 42 27.12 15.14 25.00 5.00 66.00<br />
Richness Native 42 23.76 12.99 22.00 5.00 55.00<br />
Percent Adventive 42 11.20 8.13 10.00 0.00 30.43<br />
Mean Conservatism All 42 3.64 1.07 3.63 1.70 6.00<br />
Mean Conservatism Natives 42 4.05 0.97 4.10 2.16 6.00<br />
Mean Conservatism Mean Values<br />
5.0<br />
4.8<br />
4.6<br />
4.4<br />
4.2<br />
4.0<br />
3.8<br />
3.6<br />
3.4<br />
3.2<br />
3.0<br />
<strong>Central</strong><br />
Irregular<br />
Interior<br />
River<br />
Ecoregion<br />
Figure 3. Error bar chart of ecoregional means of mean conservatism values for plant richness of<br />
all and native species.<br />
15 of 84<br />
Western<br />
Corn Belt


