

Koontz, J., D.G. Huggins, C.C. Freeman, D.S. Baker - Central Plains ...
Koontz, J., D.G. Huggins, C.C. Freeman, D.S. Baker - Central Plains ...
Koontz, J., D.G. Huggins, C.C. Freeman, D.S. Baker - Central Plains ...

Create successful ePaper yourself
Turn your PDF publications into a flip-book with our unique Google optimized e-Paper software.
Disturbance Assessment<br />
16<br />
15<br />
14<br />
13<br />
12<br />
11<br />
10<br />
9<br />
8<br />
7<br />
6<br />
5<br />
4<br />
3<br />
2<br />
1<br />
0<br />
a<br />
1 2<br />
Study Phase<br />
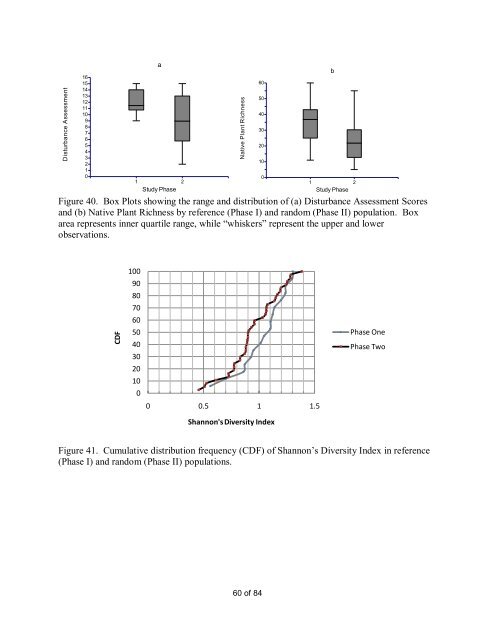
Figure 40. Box Plots showing the range and distribution of (a) Disturbance Assessment Scores<br />
and (b) Native Plant Richness by reference (Phase I) and random (Phase II) population. Box<br />
area represents inner quartile range, while “whiskers” represent the upper and lower<br />
observations.<br />
CDF<br />
100<br />
90<br />
80<br />
70<br />
60<br />
50<br />
40<br />
30<br />
20<br />
10<br />
0<br />
0 0.5 1 1.5<br />
Native Plant Richness<br />
Figure 41. Cumulative distribution frequency (CDF) of Shannon‟s Diversity Index in reference<br />
(Phase I) and random (Phase II) populations.<br />
60<br />
50<br />
40<br />
30<br />
20<br />
10<br />
Shannon's Diversity Index<br />
0<br />
60 of 84<br />
b<br />
1 2<br />
Study Phase<br />
Phase One<br />
Phase Two


