

Koontz, J., D.G. Huggins, C.C. Freeman, D.S. Baker - Central Plains ...
Koontz, J., D.G. Huggins, C.C. Freeman, D.S. Baker - Central Plains ...
Koontz, J., D.G. Huggins, C.C. Freeman, D.S. Baker - Central Plains ...

Create successful ePaper yourself
Turn your PDF publications into a flip-book with our unique Google optimized e-Paper software.
quality of plant community, respectively. The floristic quality index is only one component for<br />
assessing the plant community in wetlands. Other factors, such as native wetland plant species<br />
richness, may also indicate the condition of the wetlands health or quality to maintain diverse<br />
communities of invertebrates and vertebrates, including amphibians, water fowl, and small<br />
mammals. In situ water quality measures in this study consisted of mean values for water depth,<br />
Secchi disk depth, water temperature, turbidity (NTU), conductivity (mS/cm), dissolved oxygen,<br />
and pH. Water depth was measured with a surveyor‟s telescoping leveling rod to the nearest<br />
centimeter. Water properties were measured with a Horiba U10 Water Quality Checker. One<br />
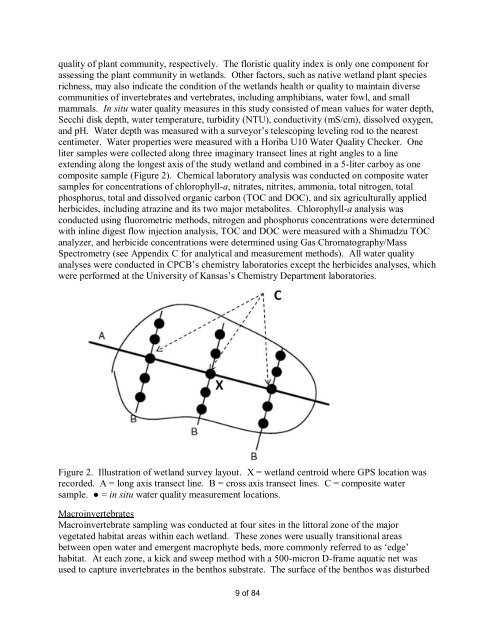
liter samples were collected along three imaginary transect lines at right angles to a line<br />
extending along the longest axis of the study wetland and combined in a 5-liter carboy as one<br />
composite sample (Figure 2). Chemical laboratory analysis was conducted on composite water<br />
samples for concentrations of chlorophyll-a, nitrates, nitrites, ammonia, total nitrogen, total<br />
phosphorus, total and dissolved organic carbon (TOC and DOC), and six agriculturally applied<br />
herbicides, including atrazine and its two major metabolites. Chlorophyll-a analysis was<br />
conducted using fluorometric methods, nitrogen and phosphorus concentrations were determined<br />
with inline digest flow injection analysis, TOC and DOC were measured with a Shimadzu TOC<br />
analyzer, and herbicide concentrations were determined using Gas Chromatography/Mass<br />
Spectrometry (see Appendix C for analytical and measurement methods). All water quality<br />
analyses were conducted in CPCB‟s chemistry laboratories except the herbicides analyses, which<br />
were performed at the University of Kansas‟s Chemistry Department laboratories.<br />
Figure 2. Illustration of wetland survey layout. X = wetland centroid where GPS location was<br />
recorded. A = long axis transect line. B = cross axis transect lines. C = composite water<br />
sample. ● = in situ water quality measurement locations.<br />
Macroinvertebrates<br />
Macroinvertebrate sampling was conducted at four sites in the littoral zone of the major<br />
vegetated habitat areas within each wetland. These zones were usually transitional areas<br />
between open water and emergent macrophyte beds, more commonly referred to as „edge‟<br />
habitat. At each zone, a kick and sweep method with a 500-micron D-frame aquatic net was<br />
used to capture invertebrates in the benthos substrate. The surface of the benthos was disturbed<br />
9 of 84


