

Koontz, J., D.G. Huggins, C.C. Freeman, D.S. Baker - Central Plains ...
Koontz, J., D.G. Huggins, C.C. Freeman, D.S. Baker - Central Plains ...
Koontz, J., D.G. Huggins, C.C. Freeman, D.S. Baker - Central Plains ...

Create successful ePaper yourself
Turn your PDF publications into a flip-book with our unique Google optimized e-Paper software.
Number of Samples<br />
Number of Samples<br />
15<br />
10<br />
5<br />
0<br />
0 1 2 3<br />
30<br />
20<br />
10<br />
Mean Depth in Meters<br />
0<br />
0 1 2 3<br />
Mean Secchi Depth in Meters<br />
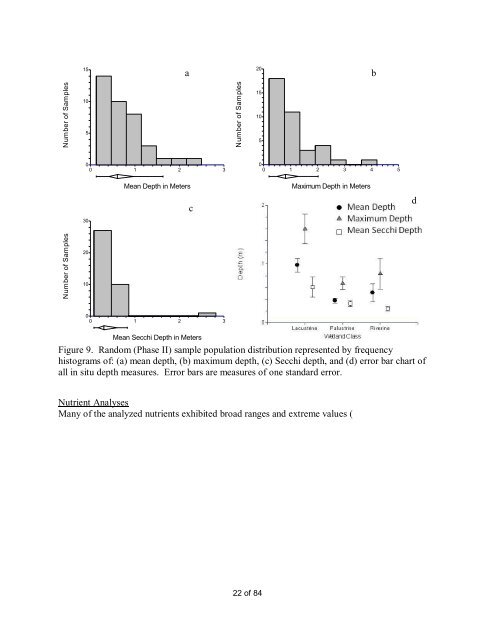
Figure 9. Random (Phase II) sample population distribution represented by frequency<br />
histograms of: (a) mean depth, (b) maximum depth, (c) Secchi depth, and (d) error bar chart of<br />
all in situ depth measures. Error bars are measures of one standard error.<br />
Nutrient Analyses<br />
Many of the analyzed nutrients exhibited broad ranges and extreme values (<br />
Number of Samples<br />
20<br />
a b<br />
c<br />
15<br />
10<br />
5<br />
22 of 84<br />
0<br />
0 1 2 3 4 5<br />
Maximum Depth in Meters<br />
d


