

Koontz, J., D.G. Huggins, C.C. Freeman, D.S. Baker - Central Plains ...
Koontz, J., D.G. Huggins, C.C. Freeman, D.S. Baker - Central Plains ...
Koontz, J., D.G. Huggins, C.C. Freeman, D.S. Baker - Central Plains ...

You also want an ePaper? Increase the reach of your titles
YUMPU automatically turns print PDFs into web optimized ePapers that Google loves.
TOC mg/L<br />
TOC mg/L<br />
16<br />
14<br />
12<br />
10<br />
8<br />
6<br />
4<br />
2<br />
0<br />
24<br />
22<br />
20<br />
18<br />
16<br />
14<br />
12<br />
10<br />
8<br />
6<br />
4<br />
2<br />
0<br />
a b<br />
AB EM MIX UB<br />
Wetland Type<br />
LIMMIX<br />
LIMAB<br />
c<br />
LITUB<br />
LITMIX<br />
LITEM<br />
LIMUB<br />
Wetland Class + Type<br />
RVUB<br />
RVEM<br />
PUB<br />
PMIX<br />
PEM<br />
PAB<br />
TOC mg/L<br />
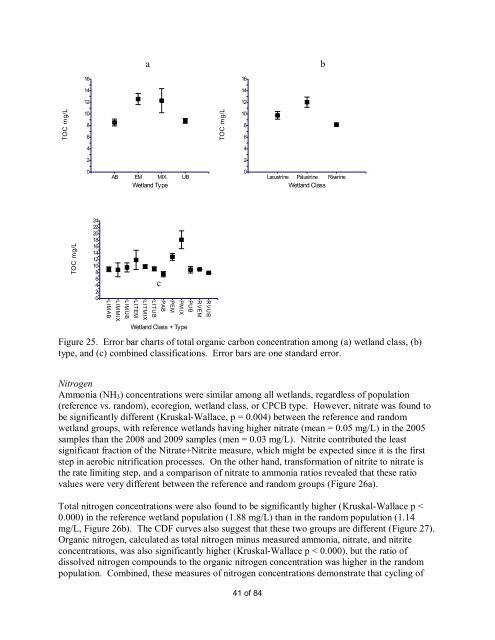
Figure 25. Error bar charts of total organic carbon concentration among (a) wetland class, (b)<br />
type, and (c) combined classifications. Error bars are one standard error.<br />
16<br />
14<br />
12<br />
10<br />
8<br />
6<br />
4<br />
2<br />
0<br />
Nitrogen<br />
Ammonia (NH3) concentrations were similar among all wetlands, regardless of population<br />
(reference vs. random), ecoregion, wetland class, or CPCB type. However, nitrate was found to<br />
be significantly different (Kruskal-Wallace, p = 0.004) between the reference and random<br />
wetland groups, with reference wetlands having higher nitrate (mean = 0.05 mg/L) in the 2005<br />
samples than the 2008 and 2009 samples (men = 0.03 mg/L). Nitrite contributed the least<br />
significant fraction of the Nitrate+Nitrite measure, which might be expected since it is the first<br />
step in aerobic nitrification processes. On the other hand, transformation of nitrite to nitrate is<br />
the rate limiting step, and a comparison of nitrate to ammonia ratios revealed that these ratio<br />
values were very different between the reference and random groups (Figure 26a).<br />
Total nitrogen concentrations were also found to be significantly higher (Kruskal-Wallace p <<br />
0.000) in the reference wetland population (1.88 mg/L) than in the random population (1.14<br />
mg/L, Figure 26b). The CDF curves also suggest that these two groups are different (Figure 27).<br />
Organic nitrogen, calculated as total nitrogen minus measured ammonia, nitrate, and nitrite<br />
concentrations, was also significantly higher (Kruskal-Wallace p < 0.000), but the ratio of<br />
dissolved nitrogen compounds to the organic nitrogen concentration was higher in the random<br />
population. Combined, these measures of nitrogen concentrations demonstrate that cycling of<br />
41 of 84<br />
Lacustrine Palustrine Riverine<br />
Wetland Class


