utilizing physical layer information to improve rfid tag
utilizing physical layer information to improve rfid tag
utilizing physical layer information to improve rfid tag

You also want an ePaper? Increase the reach of your titles
YUMPU automatically turns print PDFs into web optimized ePapers that Google loves.
may cause.<br />
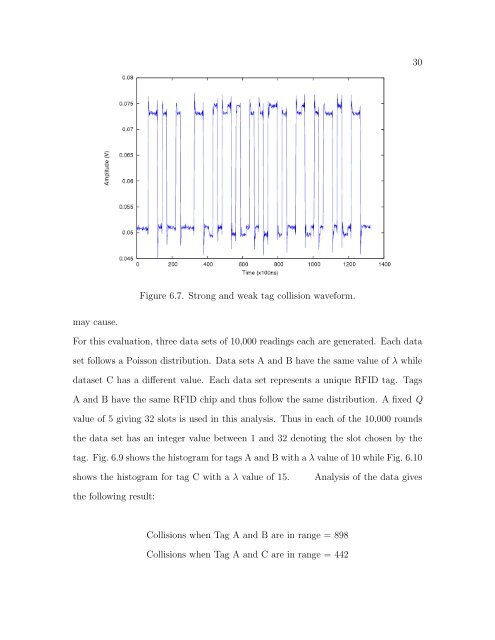
Figure 6.7. Strong and weak <strong>tag</strong> collision waveform.<br />
For this evaluation, three data sets of 10,000 readings each are generated. Each data<br />
set follows a Poisson distribution. Data sets A and B have the same value of λ while<br />
dataset C has a different value. Each data set represents a unique RFID <strong>tag</strong>. Tags<br />
A and B have the same RFID chip and thus follow the same distribution. A fixed Q<br />
value of 5 giving 32 slots is used in this analysis. Thus in each of the 10,000 rounds<br />
the data set has an integer value between 1 and 32 denoting the slot chosen by the<br />
<strong>tag</strong>. Fig. 6.9 shows the his<strong>to</strong>gram for <strong>tag</strong>s A and B with a λ value of 10 while Fig. 6.10<br />
shows the his<strong>to</strong>gram for <strong>tag</strong> C with a λ value of 15. Analysis of the data gives<br />
the following result:<br />
Collisions when Tag A and B are in range = 898<br />
Collisions when Tag A and C are in range = 442<br />
30