Fisheries - Enviro Dynamics Namibia
Fisheries - Enviro Dynamics Namibia
Fisheries - Enviro Dynamics Namibia

Create successful ePaper yourself
Turn your PDF publications into a flip-book with our unique Google optimized e-Paper software.
F I S H E R I E S , M A M M A L S A N D S E A B I R D S S P E C I A L I S T S T U D Y<br />
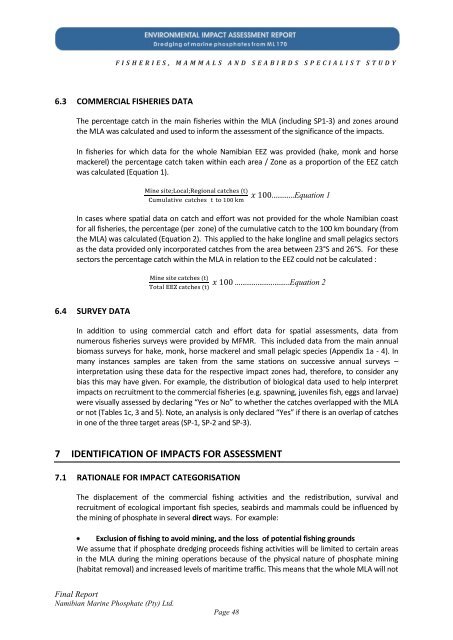
6.3 COMMERCIAL FISHERIES DATA<br />
The percentage catch in the main fisheries within the MLA (including SP1-3) and zones around<br />
the MLA was calculated and used to inform the assessment of the significance of the impacts.<br />
In fisheries for which data for the whole <strong>Namibia</strong>n EEZ was provided (hake, monk and horse<br />
mackerel) the percentage catch taken within each area / Zone as a proportion of the EEZ catch<br />
was calculated (Equation 1).<br />
Final Report<br />
<strong>Namibia</strong>n Marine Phosphate (Pty) Ltd.<br />
Page 48<br />
…………Equation 1<br />
In cases where spatial data on catch and effort was not provided for the whole <strong>Namibia</strong>n coast<br />
for all fisheries, the percentage (per zone) of the cumulative catch to the 100 km boundary (from<br />
the MLA) was calculated (Equation 2). This applied to the hake longline and small pelagics sectors<br />
as the data provided only incorporated catches from the area between 23°S and 26°S. For these<br />
sectors the percentage catch within the MLA in relation to the EEZ could not be calculated :<br />
6.4 SURVEY DATA<br />
………………………..Equation 2<br />
In addition to using commercial catch and effort data for spatial assessments, data from<br />
numerous fisheries surveys were provided by MFMR. This included data from the main annual<br />
biomass surveys for hake, monk, horse mackerel and small pelagic species (Appendix 1a - 4). In<br />
many instances samples are taken from the same stations on successive annual surveys –<br />
interpretation using these data for the respective impact zones had, therefore, to consider any<br />
bias this may have given. For example, the distribution of biological data used to help interpret<br />
impacts on recruitment to the commercial fisheries (e.g. spawning, juveniles fish, eggs and larvae)<br />
were visually assessed by declaring “Yes or No” to whether the catches overlapped with the MLA<br />
or not (Tables 1c, 3 and 5). Note, an analysis is only declared “Yes” if there is an overlap of catches<br />
in one of the three target areas (SP-1, SP-2 and SP-3).<br />
7 IDENTIFICATION OF IMPACTS FOR ASSESSMENT<br />
7.1 RATIONALE FOR IMPACT CATEGORISATION<br />
The displacement of the commercial fishing activities and the redistribution, survival and<br />
recruitment of ecological important fish species, seabirds and mammals could be influenced by<br />
the mining of phosphate in several direct ways. For example:<br />
Exclusion of fishing to avoid mining, and the loss of potential fishing grounds<br />
We assume that if phosphate dredging proceeds fishing activities will be limited to certain areas<br />
in the MLA during the mining operations because of the physical nature of phosphate mining<br />
(habitat removal) and increased levels of maritime traffic. This means that the whole MLA will not