Fisheries - Enviro Dynamics Namibia
Fisheries - Enviro Dynamics Namibia
Fisheries - Enviro Dynamics Namibia

You also want an ePaper? Increase the reach of your titles
YUMPU automatically turns print PDFs into web optimized ePapers that Google loves.
F I S H E R I E S , M A M M A L S A N D S E A B I R D S S P E C I A L I S T S T U D Y<br />
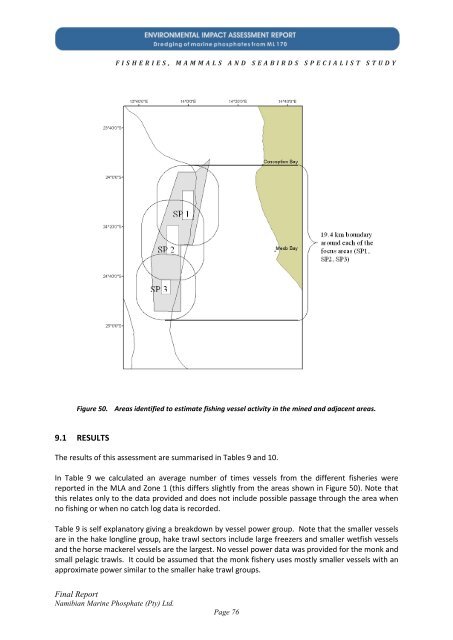
Figure 50. Areas identified to estimate fishing vessel activity in the mined and adjacent areas.<br />
9.1 RESULTS<br />
The results of this assessment are summarised in Tables 9 and 10.<br />
In Table 9 we calculated an average number of times vessels from the different fisheries were<br />
reported in the MLA and Zone 1 (this differs slightly from the areas shown in Figure 50). Note that<br />
this relates only to the data provided and does not include possible passage through the area when<br />
no fishing or when no catch log data is recorded.<br />
Table 9 is self explanatory giving a breakdown by vessel power group. Note that the smaller vessels<br />
are in the hake longline group, hake trawl sectors include large freezers and smaller wetfish vessels<br />
and the horse mackerel vessels are the largest. No vessel power data was provided for the monk and<br />
small pelagic trawls. It could be assumed that the monk fishery uses mostly smaller vessels with an<br />
approximate power similar to the smaller hake trawl groups.<br />
Final Report<br />
<strong>Namibia</strong>n Marine Phosphate (Pty) Ltd.<br />
Page 76