Fisheries - Enviro Dynamics Namibia
Fisheries - Enviro Dynamics Namibia
Fisheries - Enviro Dynamics Namibia

Create successful ePaper yourself
Turn your PDF publications into a flip-book with our unique Google optimized e-Paper software.
Final Report<br />
<strong>Namibia</strong>n Marine Phosphate (Pty) Ltd.<br />
F I S H E R I E S , M A M M A L S A N D S E A B I R D S S P E C I A L I S T S T U D Y<br />
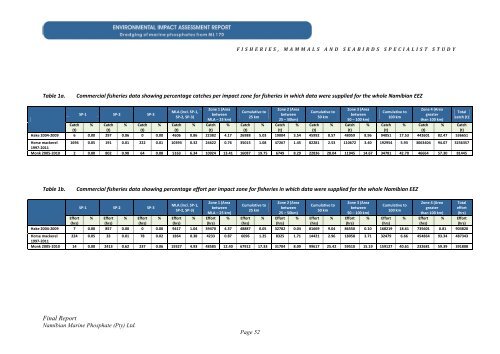
Table 1a. Commercial fisheries data showing percentage catches per impact zone for fisheries in which data were supplied for the whole <strong>Namibia</strong>n EEZ<br />
SP-1 SP-2 SP-3<br />
MLA (incl. SP-1,<br />
SP-2, SP-3)<br />
Zone 1 (Area<br />
between<br />
MLA – 25 km)<br />
Cumulative to<br />
25 km<br />
Page 52<br />
Zone 2 (Area<br />
between<br />
25 – 50km)<br />
Cumulative to<br />
50 km<br />
Zone 3 (Area<br />
between<br />
50 – 100 km)<br />
Cumulative to<br />
100 km<br />
Zone 4 (Area<br />
greater<br />
than 100 km)<br />
Catch % Catch % Catch % Catch % Catch % Catch % Catch % Catch % Catch % Catch % Catch % Catch<br />
(t)<br />
(t)<br />
(t)<br />
(t)<br />
(t)<br />
(t)<br />
(t)<br />
(t)<br />
(t)<br />
(t)<br />
(t)<br />
(t)<br />
Hake 2004-2009 6 0.00 297 0.06 0 0.00 4606 0.86 22382 4.17 26988 5.03 19004 3.54 45992 8.57 48059 8.96 94051 17.53 442601 82.47 536651<br />
Horse mackerel<br />
1997-2011<br />
1694 0.05 191 0.01 222 0.01 10393 0.32 24622 0.76 35015 1.08 47267 1.45 82281 2.53 110672 3.40 192954 5.93 3063404 94.07 3256357<br />
Monk 2005-2010 2 0.00 802 0.98 64 0.08 5163 6.34 10924 13.41 16087 19.75 6749 8.29 22836 28.04 11945 14.67 34781 42.70 46664 57.30 81445<br />
Table 1b. Commercial fisheries data showing percentage effort per impact zone for fisheries in which data were supplied for the whole <strong>Namibia</strong>n EEZ<br />
SP-1 SP-2 SP-3<br />
MLA (incl. SP-1,<br />
SP-2, SP-3)<br />
Zone 1 (Area<br />
between<br />
MLA – 25 km)<br />
Cumulative to<br />
25 km<br />
Zone 2 (Area<br />
between<br />
25 – 50km)<br />
Cumulative to<br />
50 km<br />
Zone 3 (Area<br />
between<br />
50 – 100 km)<br />
Cumulative to<br />
100 km<br />
Zone 4 (Area<br />
greater<br />
than 100 km)<br />
Effort % Effort % Effort % Effort % Effort % Effort % Effort % Effort % Effort % Effort % Effort % Effort<br />
(hrs)<br />
(hrs)<br />
(hrs)<br />
(hrs)<br />
(hrs)<br />
(hrs)<br />
(hrs)<br />
(hrs)<br />
(hrs)<br />
(hrs)<br />
(hrs)<br />
(hrs)<br />
Hake 2004-2009 7 0.00 857 0.00 0 0.00 9417 1.04 39470 4.37 48887 0.05 32782 0.04 81669 9.04 86550 0.10 168219 18.61 735601 0.81 903820<br />
Horse mackerel<br />
1997-2011<br />
224 0.05 33 0.01 78 0.02 1864 0.38 4233 0.87 6096 1.25 8325 1.71 14421 2.96 18058 3.71 32479 6.66 454864 93.34 487343<br />
Monk 2005-2010 14 0.00 2413 0.62 237 0.06 19327 4.93 48585 12.40 67912 17.33 31704 8.09 99617 25.42 59510 15.19 159127 40.61 232681 59.39 391808<br />
Total<br />
catch (t)<br />
Total<br />
effort<br />
(hrs)