Fisheries - Enviro Dynamics Namibia
Fisheries - Enviro Dynamics Namibia
Fisheries - Enviro Dynamics Namibia

Create successful ePaper yourself
Turn your PDF publications into a flip-book with our unique Google optimized e-Paper software.
F I S H E R I E S , M A M M A L S A N D S E A B I R D S S P E C I A L I S T S T U D Y<br />
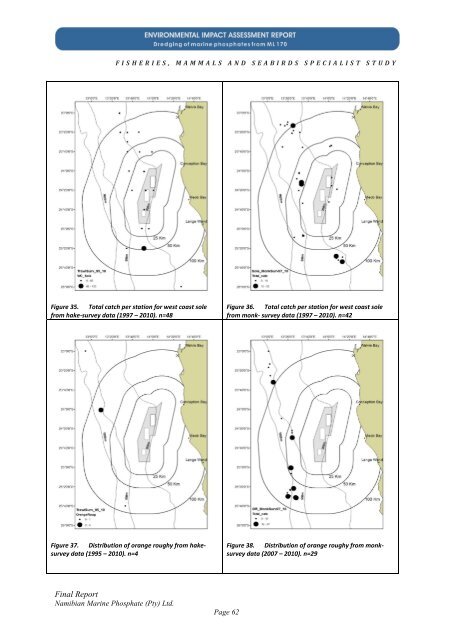
Figure 35. Total catch per station for west coast sole<br />
from hake-survey data (1997 – 2010). n=48<br />
Figure 37. Distribution of orange roughy from hakesurvey<br />
data (1995 – 2010). n=4<br />
Final Report<br />
<strong>Namibia</strong>n Marine Phosphate (Pty) Ltd.<br />
Figure 36. Total catch per station for west coast sole<br />
from monk- survey data (1997 – 2010). n=42<br />
Figure 38. Distribution of orange roughy from monksurvey<br />
data (2007 – 2010). n=29<br />
Page 62