Fisheries - Enviro Dynamics Namibia
Fisheries - Enviro Dynamics Namibia
Fisheries - Enviro Dynamics Namibia

Create successful ePaper yourself
Turn your PDF publications into a flip-book with our unique Google optimized e-Paper software.
F I S H E R I E S , M A M M A L S A N D S E A B I R D S S P E C I A L I S T S T U D Y<br />
8.2 IMPACT 2: THE IMPACT OF THE MINING OPERATIONS ON THE ECOSYSTEM<br />
(TROPHIC INTERACTIONS)<br />
As commercial data are not “independent”, we used survey data as the basis for estimating the<br />
approximate spatial distribution of the main commercial fish species. These species are used as<br />
biological indicators of the main fish components of the ecosystem, in particular their distribution<br />
reflects the likely trophic structure of the ecosystem in the vicinity of the MLA. Note that trophic<br />
modelling of the Benguela ecosystem has been done although the specific application to <strong>Namibia</strong><br />
and the MLA in particular can only be inferred from these broad studies (Shannon, 1986). Note<br />
also that trophic modelling is inclusive of top predators as well as species lower in the food chain<br />
including benthic organisms removed with the substrate in the dredging process. We have<br />
enquired regarding the status of trophic marine modelling in <strong>Namibia</strong> and the BCC but have as<br />
yet no conclusive models or data on which to give a more informed assessment of the impacts on<br />
the ecosystem. Equally this problem applies to all aspects of the Benguela ecosystem including<br />
fishing and other anthropogenic effects.<br />
The survey data (see Table 3) were analysed by visually examining the maps (Figures 27 – 38). To<br />
determine the likely impact of mining we used it as an indicator for the distribution and<br />
abundance of each species relative to their proximity to the MLA. The unit or index applied is<br />
simply the cumulative catch of a particular species in the different surveys.<br />
This rough assessment is summarized in Table 3 - i.e. the likelihood of the species listed being<br />
found (and impacted) in the actual mining locations within the MLA. The significance of the<br />
impact is summarised in Table 4. Note also that our data pertain only to the species recorded in<br />
the surveys we had access to. We are aware that many more species are found in the MLA, but<br />
that there is no data or records of these we are aware of (excluding the benthic sampling<br />
undertaken for the phosphate pre-studies). As such the data we have had access to can only be<br />
considered an “indicator” with no direct inference to all species potentially impacted by the<br />
proposed dredging.<br />
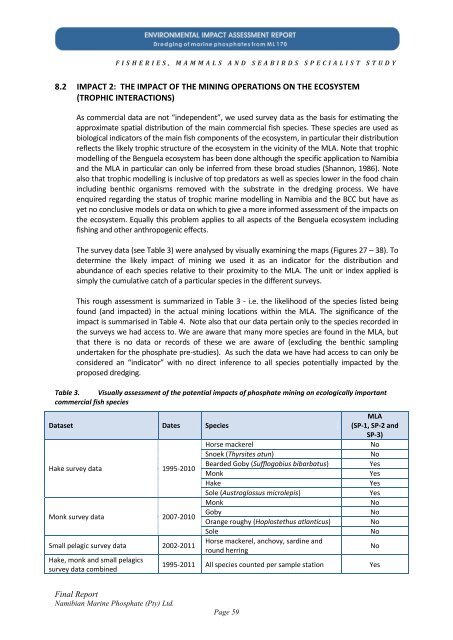
Table 3. Visually assessment of the potential impacts of phosphate mining on ecologically important<br />
commercial fish species<br />
Dataset Dates Species<br />
MLA<br />
(SP-1, SP-2 and<br />
SP-3)<br />
Horse mackerel No<br />
Snoek (Thyrsites atun) No<br />
Hake survey data 1995-2010<br />
Bearded Goby (Sufflogobius bibarbatus)<br />
Monk<br />
Yes<br />
Yes<br />
Hake Yes<br />
Sole (Austroglossus microlepis) Yes<br />
Monk No<br />
Monk survey data 2007-2010<br />
Goby<br />
Orange roughy (Hoplostethus atlanticus)<br />
No<br />
No<br />
Sole No<br />
Small pelagic survey data 2002-2011<br />
Horse mackerel, anchovy, sardine and<br />
round herring<br />
No<br />
Hake, monk and small pelagics<br />
survey data combined<br />
1995-2011 All species counted per sample station Yes<br />
Final Report<br />
<strong>Namibia</strong>n Marine Phosphate (Pty) Ltd.<br />
Page 59