Fisheries - Enviro Dynamics Namibia
Fisheries - Enviro Dynamics Namibia
Fisheries - Enviro Dynamics Namibia

Create successful ePaper yourself
Turn your PDF publications into a flip-book with our unique Google optimized e-Paper software.
F I S H E R I E S , M A M M A L S A N D S E A B I R D S S P E C I A L I S T S T U D Y<br />
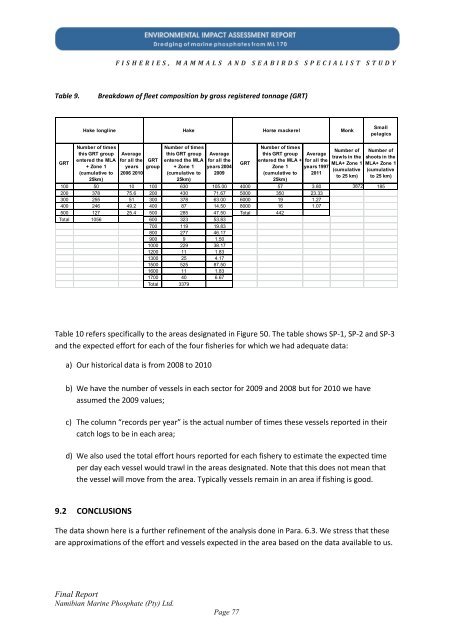
Table 9. Breakdown of fleet composition by gross registered tonnage (GRT)<br />
GRT<br />
Hake longline Hake<br />
Number of times<br />
this GRT group<br />
entered the MLA<br />
+ Zone 1<br />
(cumulative to<br />
25km)<br />
Average<br />
for all the<br />
years<br />
2006 2010<br />
GRT<br />
group<br />
Final Report<br />
<strong>Namibia</strong>n Marine Phosphate (Pty) Ltd.<br />
Number of times<br />
this GRT group<br />
entered the MLA<br />
+ Zone 1<br />
(cumulative to<br />
25km)<br />
Average<br />
for all the<br />
years 2004<br />
2009<br />
Page 77<br />
GRT<br />
Horse mackerel<br />
Number of times<br />
this GRT group<br />
entered the MLA +<br />
Zone 1<br />
(cumulative to<br />
25km)<br />
Average<br />
for all the<br />
years 1997<br />
2011<br />
Monk<br />
Number of<br />
trawls in the<br />
MLA+ Zone 1<br />
(cumulative<br />
to 25 km)<br />
Small<br />
pelagics<br />
Number of<br />
shoots in the<br />
MLA+ Zone 1<br />
(cumulative<br />
to 25 km)<br />
100 50 10 100 630 105.00 4000 57 3.80 3872 185<br />
200 378 75.6 200 430 71.67 5000 350 23.33<br />
300 255 51 300 378 63.00 6000 19 1.27<br />
400 246 49.2 400 87 14.50 8000 16 1.07<br />
500 127 25.4 500 285 47.50 Total 442<br />
Total 1056 600 323 53.83<br />
700 119 19.83<br />
800 277 46.17<br />
900 9 1.50<br />
1000 229 38.17<br />
1200 11 1.83<br />
1300 25 4.17<br />
1500 525 87.50<br />
1600 11 1.83<br />
1700 40 6.67<br />
Total 3379<br />
Table 10 refers specifically to the areas designated in Figure 50. The table shows SP-1, SP-2 and SP-3<br />
and the expected effort for each of the four fisheries for which we had adequate data:<br />
a) Our historical data is from 2008 to 2010<br />
b) We have the number of vessels in each sector for 2009 and 2008 but for 2010 we have<br />
assumed the 2009 values;<br />
c) The column “records per year” is the actual number of times these vessels reported in their<br />
catch logs to be in each area;<br />
d) We also used the total effort hours reported for each fishery to estimate the expected time<br />
per day each vessel would trawl in the areas designated. Note that this does not mean that<br />
the vessel will move from the area. Typically vessels remain in an area if fishing is good.<br />
9.2 CONCLUSIONS<br />
The data shown here is a further refinement of the analysis done in Para. 6.3. We stress that these<br />
are approximations of the effort and vessels expected in the area based on the data available to us.