Fisheries - Enviro Dynamics Namibia
Fisheries - Enviro Dynamics Namibia
Fisheries - Enviro Dynamics Namibia

You also want an ePaper? Increase the reach of your titles
YUMPU automatically turns print PDFs into web optimized ePapers that Google loves.
F I S H E R I E S , M A M M A L S A N D S E A B I R D S S P E C I A L I S T S T U D Y<br />
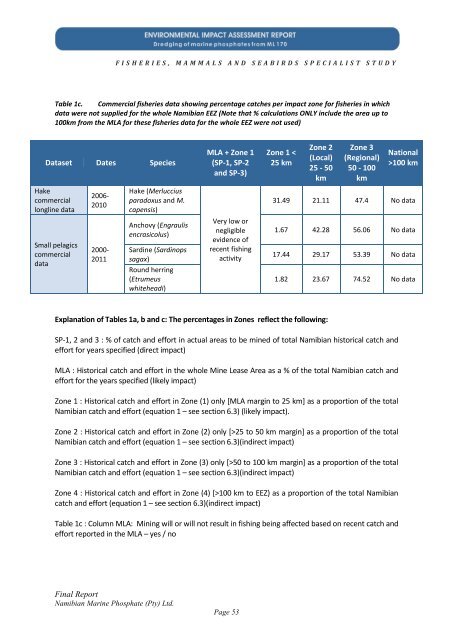
Table 1c. Commercial fisheries data showing percentage catches per impact zone for fisheries in which<br />
data were not supplied for the whole <strong>Namibia</strong>n EEZ (Note that % calculations ONLY include the area up to<br />
100km from the MLA for these fisheries data for the whole EEZ were not used)<br />
Dataset Dates Species<br />
Hake<br />
commercial<br />
longline data<br />
Small pelagics<br />
commercial<br />
data<br />
2006-<br />
2010<br />
2000-<br />
2011<br />
Hake (Merluccius<br />
paradoxus and M.<br />
capensis)<br />
Anchovy (Engraulis<br />
encrasicolus)<br />
Sardine (Sardinops<br />
sagax)<br />
Round herring<br />
(Etrumeus<br />
whiteheadi)<br />
Explanation of Tables 1a, b and c: The percentages in Zones reflect the following:<br />
SP-1, 2 and 3 : % of catch and effort in actual areas to be mined of total <strong>Namibia</strong>n historical catch and<br />
effort for years specified (direct impact)<br />
MLA : Historical catch and effort in the whole Mine Lease Area as a % of the total <strong>Namibia</strong>n catch and<br />
effort for the years specified (likely impact)<br />
Zone 1 : Historical catch and effort in Zone (1) only [MLA margin to 25 km] as a proportion of the total<br />
<strong>Namibia</strong>n catch and effort (equation 1 – see section 6.3) (likely impact).<br />
Zone 2 : Historical catch and effort in Zone (2) only [>25 to 50 km margin] as a proportion of the total<br />
<strong>Namibia</strong>n catch and effort (equation 1 – see section 6.3)(indirect impact)<br />
Zone 3 : Historical catch and effort in Zone (3) only [>50 to 100 km margin] as a proportion of the total<br />
<strong>Namibia</strong>n catch and effort (equation 1 – see section 6.3)(indirect impact)<br />
Zone 4 : Historical catch and effort in Zone (4) [>100 km to EEZ) as a proportion of the total <strong>Namibia</strong>n<br />
catch and effort (equation 1 – see section 6.3)(indirect impact)<br />
Table 1c : Column MLA: Mining will or will not result in fishing being affected based on recent catch and<br />
effort reported in the MLA – yes / no<br />
Final Report<br />
<strong>Namibia</strong>n Marine Phosphate (Pty) Ltd.<br />
MLA + Zone 1<br />
(SP-1, SP-2<br />
and SP-3)<br />
Very low or<br />
negligible<br />
evidence of<br />
recent fishing<br />
activity<br />
Page 53<br />
Zone 1 <<br />
25 km<br />
Zone 2<br />
(Local)<br />
25 - 50<br />
km<br />
Zone 3<br />
(Regional)<br />
50 - 100<br />
km<br />
National<br />
>100 km<br />
31.49 21.11 47.4 No data<br />
1.67 42.28 56.06 No data<br />
17.44 29.17 53.39 No data<br />
1.82 23.67 74.52 No data