

Advanced Welding Processes: Technologies and Process Control
Advanced Welding Processes: Technologies and Process Control
Advanced Welding Processes: Technologies and Process Control

Create successful ePaper yourself
Turn your PDF publications into a flip-book with our unique Google optimized e-Paper software.
Monitoring <strong>and</strong> control of welding processes 201<br />
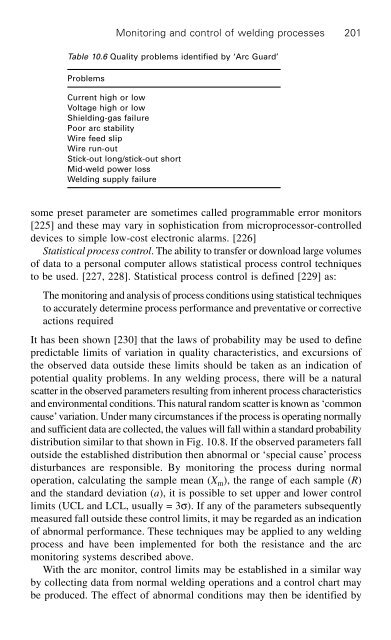
Table 10.6 Quality problems identified by ‘Arc Guard’<br />
Problems<br />
Current high or low<br />
Voltage high or low<br />
Shielding-gas failure<br />
Poor arc stability<br />
Wire feed slip<br />
Wire run-out<br />
Stick-out long/stick-out short<br />
Mid-weld power loss<br />
<strong>Welding</strong> supply failure<br />
some preset parameter are sometimes called programmable error monitors<br />
[225] <strong>and</strong> these may vary in sophistication from microprocessor-controlled<br />
devices to simple low-cost electronic alarms. [226]<br />
Statistical process control. The ability to transfer or download large volumes<br />
of data to a personal computer allows statistical process control techniques<br />
to be used. [227, 228]. Statistical process control is defined [229] as:<br />
The monitoring <strong>and</strong> analysis of process conditions using statistical techniques<br />
to accurately determine process performance <strong>and</strong> preventative or corrective<br />
actions required<br />
It has been shown [230] that the laws of probability may be used to define<br />
predictable limits of variation in quality characteristics, <strong>and</strong> excursions of<br />
the observed data outside these limits should be taken as an indication of<br />
potential quality problems. In any welding process, there will be a natural<br />
scatter in the observed parameters resulting from inherent process characteristics<br />
<strong>and</strong> environmental conditions. This natural r<strong>and</strong>om scatter is known as ‘common<br />
cause’ variation. Under many circumstances if the process is operating normally<br />
<strong>and</strong> sufficient data are collected, the values will fall within a st<strong>and</strong>ard probability<br />
distribution similar to that shown in Fig. 10.8. If the observed parameters fall<br />
outside the established distribution then abnormal or ‘special cause’ process<br />
disturbances are responsible. By monitoring the process during normal<br />
operation, calculating the sample mean (X m), the range of each sample (R)<br />
<strong>and</strong> the st<strong>and</strong>ard deviation (a), it is possible to set upper <strong>and</strong> lower control<br />
limits (UCL <strong>and</strong> LCL, usually = 3s). If any of the parameters subsequently<br />
measured fall outside these control limits, it may be regarded as an indication<br />
of abnormal performance. These techniques may be applied to any welding<br />
process <strong>and</strong> have been implemented for both the resistance <strong>and</strong> the arc<br />
monitoring systems described above.<br />
With the arc monitor, control limits may be established in a similar way<br />
by collecting data from normal welding operations <strong>and</strong> a control chart may<br />
be produced. The effect of abnormal conditions may then be identified by