

Hydro-‐political Baseline of the Upper Jordan River - Ibrahim Abd El Al
Hydro-‐political Baseline of the Upper Jordan River - Ibrahim Abd El Al
Hydro-‐political Baseline of the Upper Jordan River - Ibrahim Abd El Al

You also want an ePaper? Increase the reach of your titles
YUMPU automatically turns print PDFs into web optimized ePapers that Google loves.
MC M/m<br />
120.0<br />
100.0<br />
80.0<br />
60.0<br />
40.0<br />
20.0<br />
0.0<br />
68-‐69 69-‐70 71-‐72 72-‐73 73-‐74 02-‐03 03-‐04 04-‐05 05-‐06 06-‐07 07-‐08<br />
Years<br />
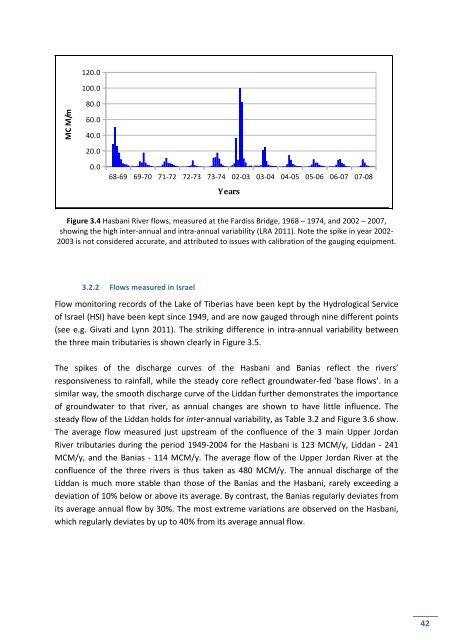
Figure 3.4 Hasbani <strong>River</strong> flows, measured at <strong>the</strong> Fardiss Bridge, 1968 – 1974, and 2002 – 2007,<br />
showing <strong>the</strong> high inter-‐annual and intra-‐annual variability (LRA 2011). Note <strong>the</strong> spike in year 2002-‐<br />
2003 is not considered accurate, and attributed to issues with calibration <strong>of</strong> <strong>the</strong> gauging equipment.<br />
3.2.2 Flows measured in Israel<br />
Flow monitoring records <strong>of</strong> <strong>the</strong> Lake <strong>of</strong> Tiberias have been kept by <strong>the</strong> <strong>Hydro</strong>logical Service<br />
<strong>of</strong> Israel (HSI) have been kept since 1949, and are now gauged through nine different points<br />
(see e.g. Givati and Lynn 2011). The striking difference in intra-‐annual variability between<br />
<strong>the</strong> three main tributaries is shown clearly in Figure 3.5.<br />
The spikes <strong>of</strong> <strong>the</strong> discharge curves <strong>of</strong> <strong>the</strong> Hasbani and Banias reflect <strong>the</strong> rivers’<br />
responsiveness to rainfall, while <strong>the</strong> steady core reflect groundwater-‐fed ‘base flows’. In a<br />
similar way, <strong>the</strong> smooth discharge curve <strong>of</strong> <strong>the</strong> Liddan fur<strong>the</strong>r demonstrates <strong>the</strong> importance<br />
<strong>of</strong> groundwater to that river, as annual changes are shown to have little influence. The<br />
steady flow <strong>of</strong> <strong>the</strong> Liddan holds for inter-‐annual variability, as Table 3.2 and Figure 3.6 show.<br />
The average flow measured just upstream <strong>of</strong> <strong>the</strong> confluence <strong>of</strong> <strong>the</strong> 3 main <strong>Upper</strong> <strong>Jordan</strong><br />
<strong>River</strong> tributaries during <strong>the</strong> period 1949-‐2004 for <strong>the</strong> Hasbani is 123 MCM/y, Liddan -‐ 241<br />
MCM/y, and <strong>the</strong> Banias -‐ 114 MCM/y. The average flow <strong>of</strong> <strong>the</strong> <strong>Upper</strong> <strong>Jordan</strong> <strong>River</strong> at <strong>the</strong><br />
confluence <strong>of</strong> <strong>the</strong> three rivers is thus taken as 480 MCM/y. The annual discharge <strong>of</strong> <strong>the</strong><br />
Liddan is much more stable than those <strong>of</strong> <strong>the</strong> Banias and <strong>the</strong> Hasbani, rarely exceeding a<br />
deviation <strong>of</strong> 10% below or above its average. By contrast, <strong>the</strong> Banias regularly deviates from<br />
its average annual flow by 30%. The most extreme variations are observed on <strong>the</strong> Hasbani,<br />
which regularly deviates by up to 40% from its average annual flow.<br />
42