Maple Solutions to the Chemical Engineering Problem Set
Maple Solutions to the Chemical Engineering Problem Set
Maple Solutions to the Chemical Engineering Problem Set

You also want an ePaper? Increase the reach of your titles
YUMPU automatically turns print PDFs into web optimized ePapers that Google loves.
n:='n':<br />
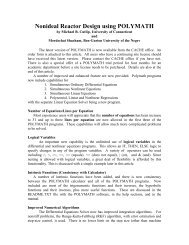
polyplot:=plot([seq(rhs(eqn[n]),n=2..5)],T=-40..100,color=[red,black,blue,green]):<br />
> plots[display]({polyplot,dataplot});<br />
-60<br />
1200<br />
1000<br />
800<br />
600<br />
400<br />
200<br />
-40<br />
-20<br />
0 20<br />
40<br />
60<br />
80<br />
100<br />
T<br />
From which we observe that <strong>the</strong> red line (<strong>the</strong> quadratic) is clearly poorer than <strong>the</strong> o<strong>the</strong>rs; all of which<br />
seem more or less equally good. However, if we plot <strong>the</strong> equations on a semilog plot we see that <strong>the</strong><br />
polynomials suffer from a ra<strong>the</strong>r serious problem.<br />
> lplot1:=plots[logplot]([seq(rhs(eqn[n]),n=2..5)],T=-40..100,color=[red,black,blue,green]):<br />
> lplot2:=plots[logplot](datapoints,style=point,symbol=box):<br />
> plots[display]({lplot1,lplot2});<br />
Page 16