M.A. (Education) Part I and II - Nalanda Open University
M.A. (Education) Part I and II - Nalanda Open University
M.A. (Education) Part I and II - Nalanda Open University

Create successful ePaper yourself
Turn your PDF publications into a flip-book with our unique Google optimized e-Paper software.
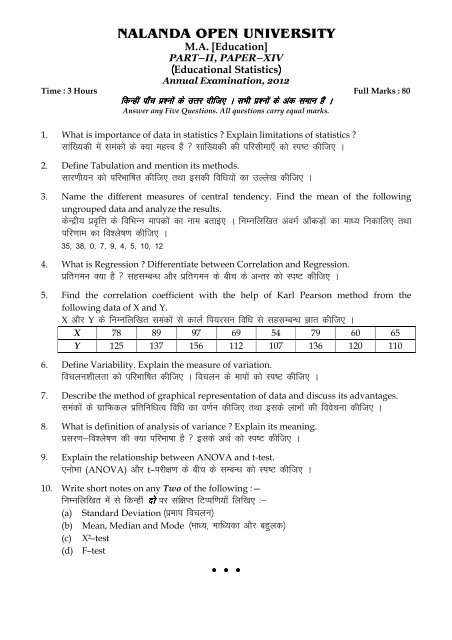
NALANDA OPEN UNIVERSITY<br />
M.A. [<strong>Education</strong>]<br />
PART–<strong>II</strong>, PAPER–XIV<br />
¼<strong>Education</strong>al Statistics½<br />
Annual Examination, 2012<br />
Time : 3 Hours Full Marks : 80<br />
fdUgha fdUgha fdUgha fdUgha ik¡p ik¡p ik¡p ik¡p iz'uksa iz'uksa iz'uksa iz'uksa ds ds ds ds mÙkj mÙkj mÙkj mÙkj nhft, nhft, nhft, nhft, A A A A lHkh lHkh lHkh lHkh iz'uksa iz'uksa iz'uksa iz'uksa ds ds ds ds vad vad vad vad leku leku leku leku gSa gSa gSa gSa A AA<br />
A<br />
Answer any Five Questions. All questions carry equal marks.<br />
1. What is importance of data in statistics ? Explain limitations of statistics ?<br />
lkaf[;dh esa leadksa ds D;k egÙo gSa \ lkaf[;dh dh ifjlhek,¡ dks Li"V dhft, A<br />
2. Define Tabulation <strong>and</strong> mention its methods.<br />
lkj.kh;u dks ifjHkkf"kr dhft, rFkk bldh fof/k;ksa dk mYys[k dhft, A<br />
3. Name the different measures of central tendency. Find the mean of the following<br />
ungrouped data <strong>and</strong> analyze the results.<br />
dsUæh; izo`fÙk ds fofHkUu ekidksa dk uke crkb, A fuEufyf[kr voxZ vk¡dM+ksa dk ek/; fudkfy, rFkk<br />
ifj.kke dk fo'ys"k.k dhft, A<br />
35] 38] 0] 7] 9] 4] 5] 10] 12<br />
4. What is Regression ? Differentiate between Correlation <strong>and</strong> Regression.<br />
izfrxeu D;k gS \ lglEcU/k vkSj izfrxeu ds chp ds vUrj dks Li"V dhft, A<br />
5. Find the correlation coefficient with the help of Karl Pearson method from the<br />
following data of X <strong>and</strong> Y.<br />
X vkSj Y ds fuEufyf[kr leadksa ls dkyZ fi;jlu fof/k ls lglEcU/k Kkr dhft, A<br />
X 78 89 97 69 54 79 60 65<br />
Y 125 137 156 112 107 136 120 110<br />
6. Define Variability. Explain the measure of variation.<br />
fopyu'khyrk dks ifjHkkf"kr dhft, A fopyu ds ekiksa dks Li"V dhft, A<br />
7. Describe the method of graphical representation of data <strong>and</strong> discuss its advantages.<br />
leadksa ds xzkfQdy izfrfuf/kRo fof/k dk o.kZu dhft, rFkk blds ykHkksa dh foospuk dhft, A<br />
8. What is definition of analysis of variance ? Explain its meaning.<br />
izlj.k&fo'ys"k.k dh D;k ifjHkk"kk gS \ blds vFkZ dks Li"V dhft, A<br />
9. Explain the relationship between ANOVA <strong>and</strong> t-test.<br />
,uksHkk (ANOVA) vkSj t–ijh{k.k ds chp ds lEcU/k dks Li"V dhft, A<br />
10. Write short notes on any Two of the following :—<br />
fuEufyf[kr esa ls fdUgha nks nks nks nks ij laf{kIr fVIif.k;k¡ fyf[k, %&<br />
(a) St<strong>and</strong>ard Deviation ¼izeki fopyu½<br />
(b) Mean, Median <strong>and</strong> Mode ¼ek/;] ekf/;dk vkSj cgqyd½<br />
(c) X²–test<br />
(d) F–test