Brazil Wine Market Report JBC EMP July 2011 - California Wine ...
Brazil Wine Market Report JBC EMP July 2011 - California Wine ...
Brazil Wine Market Report JBC EMP July 2011 - California Wine ...

You also want an ePaper? Increase the reach of your titles
YUMPU automatically turns print PDFs into web optimized ePapers that Google loves.
20<br />
<strong>Brazil</strong>ian <strong>Wine</strong> <strong>Market</strong> <strong>Report</strong><br />
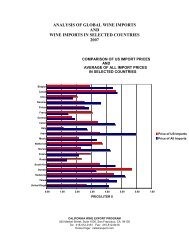
than $13.43. This is consistent with the idea that the rising middle class is consuming alcohol<br />
and the idea that most of the wine consumed is produced either domestically or in other<br />
South American Countries, keeping tariffs and transportation costs low.<br />
<strong>Wine</strong> Consumption for 2009 By <strong>Wine</strong> Type (Still <strong>Wine</strong>s)<br />
Still Light Grape <strong>Wine</strong> Consumption 2009 (by type)<br />
By Volume (million liters)<br />
Color Total<br />
Red 217.3<br />
White 45.9<br />
Rose 4.5<br />
Total 267.7<br />
Source: Euromonitor- Passport<br />
<strong>Brazil</strong>ians clearly have a strong preference for red wine. Of the red wines, Cabernet<br />
Sauvignon enjoys the dominant share with 71.6 million liters. Malbec and Merlot are also<br />
very popular grape varieties, with 22.5 and 24.3 million liters respectively. Of the white<br />
wines, Chardonnay is most popular with 21.5 million liters.<br />
Partner<br />
Country<br />
<strong>Wine</strong> Consumption Data for Imports<br />
<strong>Brazil</strong> Import Statistics<br />
Commodity: 2204, <strong>Wine</strong> Of Fresh Grapes, Incl Fortified; Grape Must O/T Heading 20.09<br />
Unit<br />
Calendar Year: 2008 - 2010<br />
2008 2009 2010<br />
USD Quantity USD Quantity USD Quantity<br />
World L 185,836,478 56,593,564 196,049,568 57,848,119 251,549,238 73,767,146<br />
Chile L 50,982,411 18,177,493 61,563,326 21,961,881 73,239,549 25,957,208<br />
Argentina L 40,476,584 15,297,016 41,255,809 14,752,051 55,715,290 18,046,478<br />
France L 27,048,955 3,051,254 28,840,407 2,973,740 35,805,532 3,577,296<br />
Italy L 28,853,317 10,704,938 26,076,286 9,055,564 33,452,731 12,960,301<br />
Portugal L 24,100,160 6,233,933 23,980,957 5,972,013 29,947,461 8,057,888<br />
Spain<br />
South<br />
L 7,215,868 1,239,690 7,627,607 1,411,411 10,618,202 1,989,727<br />
Africa L 1,182,329 315,459 1,973,912 498,107 3,637,693 939,835<br />
Uruguay L 2,097,911 880,192 1,963,590 748,045<br />
3,225,363 1,254,517<br />
Australia<br />
United<br />
L 1,252,014 196,777 1,000,788 213,247 1,876,543 345,808<br />
States L 577,322 77,536 728,777 92,535 1,415,977 220,637<br />
Source: worldtradestatistics.com/gta