Devouring profit - International Coffee Organization
Devouring profit - International Coffee Organization
Devouring profit - International Coffee Organization

You also want an ePaper? Increase the reach of your titles
YUMPU automatically turns print PDFs into web optimized ePapers that Google loves.
54<br />
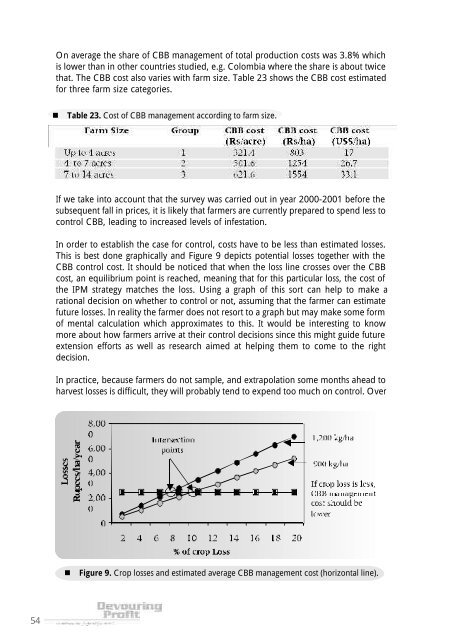
On average the share of CBB management of total production costs was 3.8% which<br />
is lower than in other countries studied, e.g. Colombia where the share is about twice<br />
that. The CBB cost also varies with farm size. Table 23 shows the CBB cost estimated<br />
for three farm size categories.<br />
Table 23. Cost of CBB management according to farm size.<br />
If we take into account that the survey was carried out in year 2000-2001 before the<br />
subsequent fall in prices, it is likely that farmers are currently prepared to spend less to<br />
control CBB, leading to increased levels of infestation.<br />
In order to establish the case for control, costs have to be less than estimated losses.<br />
This is best done graphically and Figure 9 depicts potential losses together with the<br />
CBB control cost. It should be noticed that when the loss line crosses over the CBB<br />
cost, an equilibrium point is reached, meaning that for this particular loss, the cost of<br />
the IPM strategy matches the loss. Using a graph of this sort can help to make a<br />
rational decision on whether to control or not, assuming that the farmer can estimate<br />
future losses. In reality the farmer does not resort to a graph but may make some form<br />
of mental calculation which approximates to this. It would be interesting to know<br />
more about how farmers arrive at their control decisions since this might guide future<br />
extension efforts as well as research aimed at helping them to come to the right<br />
decision.<br />
In practice, because farmers do not sample, and extrapolation some months ahead to<br />
harvest losses is difficult, they will probably tend to expend too much on control. Over<br />
Figure 9. Crop losses and estimated average CBB management cost (horizontal line).