- Page 1 and 2:
Mortice Kern Systems (MKS) Inc. Sou
- Page 3 and 4:
Table of Contents 1 Welcome to Sour
- Page 5 and 6:
Table of Contents 4 Getting Started
- Page 7 and 8:
Table of Contents 6 Managing Archiv
- Page 9 and 10:
Table of Contents More About Rules
- Page 11 and 12:
Table of Contents Selecting Issues
- Page 13 and 14:
Welcome to Source Integrity Profess
- Page 15 and 16:
The Source Integrity Professional E
- Page 17 and 18:
Understanding Source Integrity 2 Th
- Page 19 and 20:
The Role of Configuration Managemen
- Page 21 and 22:
Managing Change Implementing Change
- Page 23 and 24:
Branches Metadata Source Integrity
- Page 25 and 26:
Understanding Projects Logical and
- Page 27 and 28:
This main line of revisions is refe
- Page 29 and 30:
Branches and Trunks Storing Entire
- Page 31 and 32:
Branching occurs when you check in
- Page 33 and 34:
Sandboxes The directory structure i
- Page 35 and 36:
Once a Source Integrity project has
- Page 37 and 38:
The labels in the illustration indi
- Page 39 and 40:
Sandboxes The process starts with d
- Page 41 and 42:
Metadata About Labels Metadata The
- Page 43 and 44:
About Timestamps Metadata When you
- Page 45 and 46:
For information about configuring a
- Page 47 and 48:
Groups Security and Administration
- Page 49 and 50:
Reporter Managing Development Most
- Page 51 and 52:
Introducing the Source Integrity In
- Page 53 and 54:
For more information on filters, se
- Page 55 and 56:
The Archive Window The Windows inte
- Page 57 and 58:
Filtering Modes Using Tree View The
- Page 59 and 60:
The Windows interface members are d
- Page 61 and 62:
Installing the Source Integrity Web
- Page 63 and 64:
The Source Integrity Web Interface
- Page 65 and 66:
The Source Integrity Web Interface
- Page 67 and 68:
The Source Integrity Web Interface
- Page 69 and 70:
The Source Integrity Web Interface
- Page 71 and 72:
The Source Integrity Web Interface
- Page 73 and 74:
The Command Line Interface Project
- Page 75 and 76:
File Name Arguments For more inform
- Page 77 and 78:
Getting Started With Projects, Sand
- Page 79 and 80:
2. In Step 1, enter the following o
- Page 81 and 82:
Registering a Project in the Source
- Page 83 and 84:
Opening the Master Project From a S
- Page 85 and 86:
Adding Members to a Project 2. Sele
- Page 87 and 88:
Removing Members From a Project Rem
- Page 89 and 90:
For more information, see “Build
- Page 91 and 92:
Creating a Sandbox To create a sand
- Page 93 and 94:
For more information about build sa
- Page 95 and 96:
Checking Out a Member Member Rev.
- Page 97 and 98:
Viewing and Editing a Member checks
- Page 99 and 100:
Checking In a Member Starting a Bra
- Page 101 and 102:
Assigning Revision Descriptions Che
- Page 103 and 104:
Checking In a Member Revision Numb
- Page 105 and 106:
Checking In a Member 5. Select Keep
- Page 107 and 108:
Viewing and Editing Project and San
- Page 109 and 110:
Setting Project or Sandbox Attribut
- Page 111 and 112:
Comparing the Working File to Its M
- Page 113 and 114:
Locking a Member Locking a Member 2
- Page 115 and 116:
Removing Unused Locks 2. Choose Mem
- Page 117 and 118:
Resynchronizing Your Project or San
- Page 119 and 120:
Thawing Members Thawing Members To
- Page 121 and 122:
Viewing and Editing Member Attribut
- Page 123 and 124:
Promoting and Demoting a Member you
- Page 125 and 126:
Updating to Head Rev Updating to He
- Page 127 and 128:
Refreshing Your View Refreshing You
- Page 129 and 130:
Deleting a Member’s Label Deletin
- Page 131 and 132:
C and C++ files Pascal files Fort
- Page 133 and 134:
Building a Project 2. Fill in the B
- Page 135 and 136:
Using pj mkmf Building a Project -
- Page 137 and 138:
Report Types The Reporter Utility T
- Page 139 and 140:
Revisions Newer Than Member Revisio
- Page 141 and 142:
Using Keywords Using Keywords In th
- Page 143 and 144:
For more information about the iden
- Page 145 and 146:
Managing Projects and Sandboxes 5 S
- Page 147 and 148:
Thawing a Project Thawing a Project
- Page 149 and 150:
Checkpointing a Project Remember th
- Page 151 and 152:
Checkpointing a Project To checkpoi
- Page 153 and 154:
Promoting and Demoting a Project If
- Page 155 and 156:
Viewing Changes to a Project Viewin
- Page 157 and 158:
Viewing Changes to a Project 4. To
- Page 159 and 160:
Restoring a Project’s Member List
- Page 161 and 162:
Importing SCCS Files Importing PVCS
- Page 163 and 164:
Using Existing RCS Archives Example
- Page 165 and 166:
Variables and Attributes Project an
- Page 167 and 168:
Accessing Project Information With
- Page 169 and 170:
Editing Code Blocks Accessing Proje
- Page 171 and 172:
Cleaning Up Working Files For examp
- Page 173 and 174:
Choosing an Encryption Key Encrypti
- Page 175 and 176:
Encrypting Files However, if the fi
- Page 177 and 178:
Managing Archives and Revisions 6 W
- Page 179 and 180:
Creating Archives Creating Archives
- Page 181 and 182:
For more information about SAM perm
- Page 183 and 184:
Importing Archives If you use the -
- Page 185 and 186:
Checking Out by Revision Number or
- Page 187 and 188:
Checking In— Setting Labels Check
- Page 189 and 190:
2. View or make changes to the arch
- Page 191 and 192:
Viewing and Editing Revision Inform
- Page 193 and 194:
Viewing and Editing Revision Inform
- Page 195 and 196:
Assigning Labels to Revisions Assig
- Page 197 and 198:
Promoting and Demoting a Revision W
- Page 199 and 200:
Locking Revisions Unlocking Revisio
- Page 201 and 202:
Deleting Revisions Deleting Revisio
- Page 203 and 204:
To compare two revisions in the Win
- Page 205 and 206:
Logging Archive Transactions To mer
- Page 207 and 208:
Cleaning Up Log Files Cleaning Up W
- Page 209 and 210:
Using Extensions For instructions o
- Page 211 and 212:
The Project Window Introduction to
- Page 213 and 214:
Introduction to Source Integrity Ex
- Page 215 and 216:
Introduction to Source Integrity Ex
- Page 217 and 218:
Introduction to Source Integrity Ex
- Page 219 and 220:
Introduction to Source Integrity Ex
- Page 221 and 222:
Using the Extensions Using the Exte
- Page 223 and 224:
Differences Between Extensions and
- Page 225 and 226:
Differences Between Extensions and
- Page 227 and 228:
Creating a Source Integrity Project
- Page 229 and 230:
Checking In New Revisions To check
- Page 231 and 232:
Creating a Source Integrity Project
- Page 233 and 234:
Using Microsoft Visual C++ 6.0 The
- Page 235 and 236:
The Borland Delphi Extension The Bo
- Page 237 and 238:
Creating a Sandbox For more on crea
- Page 239 and 240:
Checking In Multiple Files The Micr
- Page 241 and 242:
Checking Out Files Checking In New
- Page 243 and 244:
Building Projects With Source Integ
- Page 245 and 246:
Creating a Makefile Creating a Make
- Page 247 and 248:
Object File Associations Building I
- Page 249 and 250:
@Depends @Template Variables Templa
- Page 251 and 252:
Examples The Build Process Source I
- Page 253 and 254:
creates a new makefile with the con
- Page 255 and 256:
Using the MKS Make Utility 9 MKS Ma
- Page 257 and 258:
Search Order For more information a
- Page 259 and 260:
Makefiles Getting Started With MKS
- Page 261 and 262:
Getting Started With MKS Make any n
- Page 263 and 264:
Missing Rules Getting Started With
- Page 265 and 266:
The Command Line You can combine op
- Page 267 and 268:
For more information on the control
- Page 269 and 270:
Using Macros Refer back to the prev
- Page 271 and 272:
Defining Macros on the Command Line
- Page 273 and 274:
For more information on special tar
- Page 275 and 276:
expands to /usr/dale Using Macros Y
- Page 277 and 278:
and $(TEST:+".c") expands to main.c
- Page 279 and 280:
Special Target Directives Attribute
- Page 281 and 282:
Target Directive Description Contro
- Page 283 and 284:
Special Macros Target Directive Des
- Page 285 and 286:
For more information, see “Attrib
- Page 287 and 288:
For more information on using libra
- Page 289 and 290:
How Make Finds Files Controlling MK
- Page 291 and 292:
Controlling MKS Make Note that .SET
- Page 293 and 294:
Using Inference Rules For more info
- Page 295 and 296:
Here is another example, this time
- Page 297 and 298:
Using Inference Rules When MKS Make
- Page 299 and 300:
Using Inference Rules You can also
- Page 301 and 302:
Built-In Commands Group Recipes Mor
- Page 303 and 304:
Text Diversions More About Executin
- Page 305 and 306:
Making Libraries Making Libraries A
- Page 307 and 308:
For more information on the += symb
- Page 309 and 310:
Compatibility Considerations If the
- Page 311 and 312:
Borland Make Compatibility Consider
- Page 313 and 314:
Compatibility Considerations Unlik
- Page 315 and 316:
Using CC Generic Command-line Forma
- Page 317 and 318:
Simple Makefile Separate Object Dir
- Page 319 and 320:
Recursive Makes For more informatio
- Page 321 and 322:
Miscellaneous Details Miscellaneous
- Page 323 and 324:
Starting a Change Integrity Session
- Page 325 and 326:
Group Projects Query Reports Charts
- Page 327 and 328:
Starting a Change Integrity Session
- Page 329 and 330:
The Change Integrity Graphic User I
- Page 331 and 332:
Issue Details The Change Integrity
- Page 333 and 334:
Setting Session Preferences My Inbo
- Page 335 and 336:
Email Notification 2. Set up your l
- Page 337 and 338:
Setting Session Preferences Tip You
- Page 339 and 340:
Saving Session Preferences Setting
- Page 341 and 342:
To close a session using the Web in
- Page 343 and 344:
Submitting Issues 11 This chapter d
- Page 345 and 346:
Submitting an Issue In the Assigne
- Page 347 and 348:
Relating an Issue With a Submitted
- Page 349 and 350:
Submitting an Issue 5. Repeat for a
- Page 351 and 352:
To remove a related issue in the We
- Page 353 and 354:
2. Click . The Add Attachments dial
- Page 355 and 356:
The selected file is added to the A
- Page 357 and 358:
3. Click . The attachment opens in
- Page 359 and 360:
2. Click the Attachments tab. 3. Th
- Page 361 and 362:
Queries 12 You can define and store
- Page 363 and 364:
Creating a New Query Created By qu
- Page 365 and 366:
Creating a New Query 6. Choose a fi
- Page 367 and 368:
Creating Saved Queries Use custom
- Page 369 and 370:
To delete a saved query in the Web
- Page 371 and 372: Running Queries 3. Make changes to
- Page 373 and 374: Refreshing Queries Running Queries
- Page 375 and 376: Viewing and Editing Issues 13 When
- Page 377 and 378: Viewing Query Results If any change
- Page 379 and 380: Selecting Issues to View If any cha
- Page 381 and 382: For more information on change pack
- Page 383 and 384: For more information on change pack
- Page 385 and 386: Saving Issues To print an issue in
- Page 387 and 388: Selecting Issues to View 4. Browse
- Page 389 and 390: Batch Editing Editing Issues 4. Whe
- Page 391 and 392: Editing Issues 6. Select a value fr
- Page 393 and 394: 4. Enter the issue ID, for example,
- Page 395 and 396: Editing Issues User Guide 383
- Page 397 and 398: Reports 14 Change Integrity allows
- Page 399 and 400: Change Integrity Reports 3. In the
- Page 401 and 402: Change Integrity Reports 4. Insert
- Page 403 and 404: For information on using filters in
- Page 405 and 406: Editing Reports The report is saved
- Page 407 and 408: Running Reports Change Integrity Re
- Page 409 and 410: Deleting Reports To delete a report
- Page 411 and 412: 3. Click Copy. The Copy Report dial
- Page 413 and 414: Printing Reports To save a report i
- Page 415 and 416: 2. Choose File > Print. A standard
- Page 417 and 418: Charts 15 Change Integrity allows y
- Page 419 and 420: Creating Distribution Charts Change
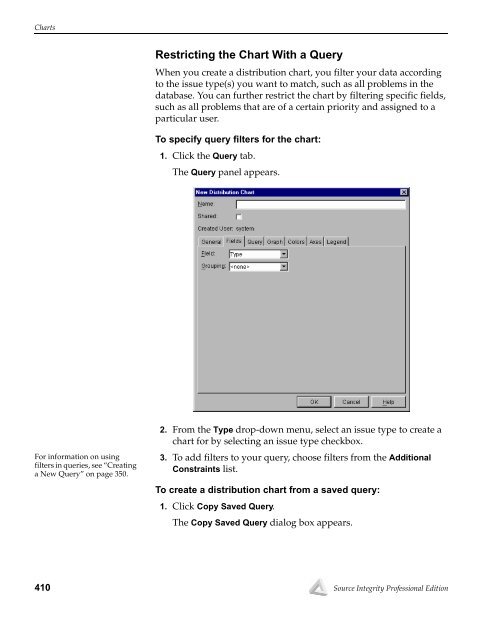
- Page 421: Change Integrity Charts 13. To choo
- Page 425 and 426: 3. Click Add. The Select Color dial
- Page 427 and 428: Change Integrity Charts 2. From the
- Page 429 and 430: Creating Trend Charts Change Integr
- Page 431 and 432: Change Integrity Charts 5. In the N
- Page 433 and 434: Change Integrity Charts 4. From the
- Page 435 and 436: 4. Choose a color from the palette.
- Page 437 and 438: Change Integrity Charts 5. To show
- Page 439 and 440: Editing Existing Charts To edit an
- Page 441 and 442: 2. Select a chart from the Charts l
- Page 443 and 444: Deleting Charts To delete a chart (
- Page 445 and 446: Saving and Printing Charts 3. Renam
- Page 447 and 448: A standard Print dialog box appears
- Page 449 and 450: Integrated Version Control 16 As pa
- Page 451 and 452: Configuring Change Integrity Connec
- Page 453 and 454: Associating Active Issues With Proj
- Page 455 and 456: 2. Click the Change Package tab. Th
- Page 457 and 458: A P P E N D I X Glossary Source Int
- Page 459 and 460: Source Integrity Terms check in An
- Page 461 and 462: Source Integrity Terms keyword A sp
- Page 463 and 464: Source Integrity Terms The revision
- Page 465 and 466: Visual Difference window Source Int
- Page 467 and 468: Change Integrity Terms query A quer
- Page 469 and 470: Index -, 251 $, 274 $$, 274 $$*, 27
- Page 471 and 472: number, 19 root revision, 17 specif
- Page 473 and 474:
Check Out Locked, 84 Checkpoint Pro
- Page 475 and 476:
DIRSEPSTR, 272 distribution charts,
- Page 477 and 478:
Web interface command, 142 History
- Page 479 and 480:
special target directives, 267-271
- Page 481 and 482:
pj set CLI command, 157 pj thaw CLI
- Page 483 and 484:
saving, 392, 400 templates, 387 Res
- Page 485 and 486:
Web interface, 321 status bar graph
- Page 487 and 488:
subprojects, 45 using, 44 Windows N


