Silica (crystalline, respirable) - OEHHA
Silica (crystalline, respirable) - OEHHA
Silica (crystalline, respirable) - OEHHA

You also want an ePaper? Increase the reach of your titles
YUMPU automatically turns print PDFs into web optimized ePapers that Google loves.
FINAL February 2005<br />
Gold miners in South Dakota (Steenland and Brown, 1995)<br />
Steenland and Brown (1995) studied a very large cohort (3330) of white male gold miners in<br />
South Dakota, who had worked at least 1 year underground between 1940 and 1965 (average = 9<br />
years underground). The mine dust contained on average 13% silica (range = 1-48%). A jobexposure<br />
matrix was created for full-time underground workers grouped into five categories.<br />
The authors estimated that most miners were exposed to a median silica level of 0.05 mg/m 3 , but<br />
that those hired before 1930 were exposed to a median level of 0.15 mg/m 3 . A total of 170 cases<br />
of silicosis (5.1% of the cohort) was determined from death certificates only (n = 128 cases),<br />
from two cross-sectional radiographic surveys in 1960 and 1976 (n = 29 cases; ILO category 1/1<br />
or greater), or from both (n = 13 cases). Unfortunately, only 25% of living cohort members were<br />
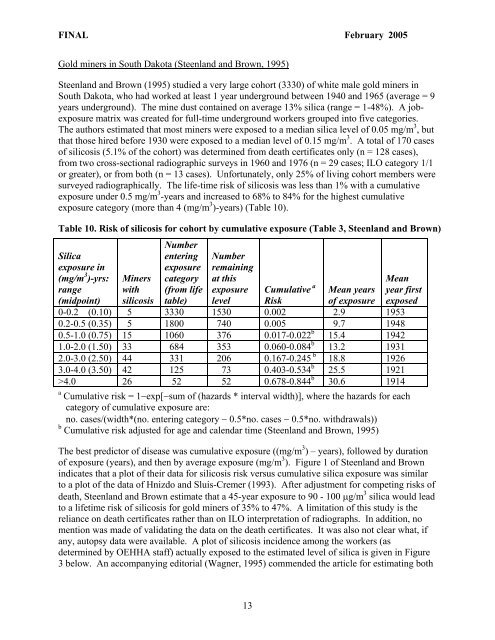
surveyed radiographically. The life-time risk of silicosis was less than 1% with a cumulative<br />
exposure under 0.5 mg/m 3 -years and increased to 68% to 84% for the highest cumulative<br />
exposure category (more than 4 (mg/m 3 )-years) (Table 10).<br />
Table 10. Risk of silicosis for cohort by cumulative exposure (Table 3, Steenland and Brown)<br />
<strong>Silica</strong><br />
exposure in<br />
(mg/m 3 )-yrs:<br />
range<br />
(midpoint)<br />
Number<br />
entering<br />
exposure<br />
category<br />
(from life<br />
table)<br />
Number<br />
remaining<br />
at this<br />
exposure<br />
level<br />
Miners<br />
with<br />
Cumulative<br />
silicosis<br />
a<br />
Mean<br />
Mean years year first<br />
Risk of exposure exposed<br />
0-0.2 (0.10) 5 3330 1530 0.002 2.9 1953<br />
0.2-0.5 (0.35) 5 1800 740 0.005 9.7 1948<br />
0.5-1.0 (0.75) 15 1060 376 0.017-0.022 b<br />
15.4 1942<br />
1.0-2.0 (1.50) 33 684 353 0.060-0.084 b<br />
13.2 1931<br />
2.0-3.0 (2.50) 44 331 206 0.167-0.245 b<br />
18.8 1926<br />
3.0-4.0 (3.50) 42 125 73 0.403-0.534 b<br />
25.5 1921<br />
>4.0 26 52 52 0.678-0.844 b<br />
30.6 1914<br />
a<br />
Cumulative risk = 1−exp[−sum of (hazards * interval width)], where the hazards for each<br />
category of cumulative exposure are:<br />
no. cases/(width*(no. entering category − 0.5*no. cases − 0.5*no. withdrawals))<br />
b<br />
Cumulative risk adjusted for age and calendar time (Steenland and Brown, 1995)<br />
The best predictor of disease was cumulative exposure ((mg/m 3 ) – years), followed by duration<br />
of exposure (years), and then by average exposure (mg/m 3 ). Figure 1 of Steenland and Brown<br />
indicates that a plot of their data for silicosis risk versus cumulative silica exposure was similar<br />
to a plot of the data of Hnizdo and Sluis-Cremer (1993). After adjustment for competing risks of<br />
death, Steenland and Brown estimate that a 45-year exposure to 90 - 100 µg/m 3 silica would lead<br />
to a lifetime risk of silicosis for gold miners of 35% to 47%. A limitation of this study is the<br />
reliance on death certificates rather than on ILO interpretation of radiographs. In addition, no<br />
mention was made of validating the data on the death certificates. It was also not clear what, if<br />
any, autopsy data were available. A plot of silicosis incidence among the workers (as<br />
determined by <strong>OEHHA</strong> staff) actually exposed to the estimated level of silica is given in Figure<br />
3 below. An accompanying editorial (Wagner, 1995) commended the article for estimating both<br />
13