Silica (crystalline, respirable) - OEHHA
Silica (crystalline, respirable) - OEHHA
Silica (crystalline, respirable) - OEHHA

You also want an ePaper? Increase the reach of your titles
YUMPU automatically turns print PDFs into web optimized ePapers that Google loves.
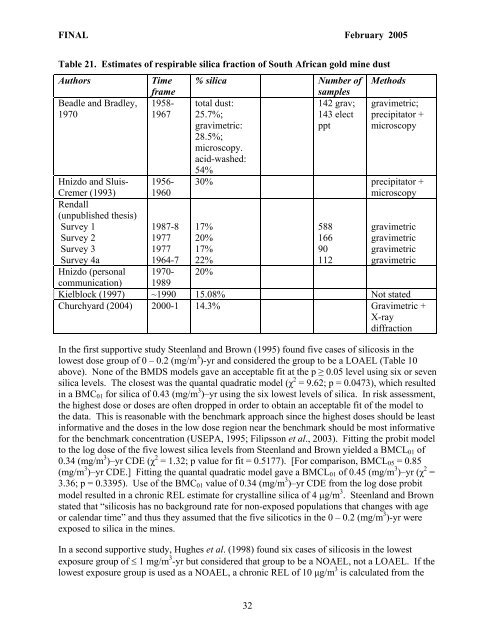
FINAL February 2005<br />
Table 21. Estimates of <strong>respirable</strong> silica fraction of South African gold mine dust<br />
Authors Time % silica Number of Methods<br />
frame<br />
samples<br />
Beadle and Bradley, 1958- total dust:<br />
142 grav; gravimetric;<br />
1970<br />
1967 25.7%;<br />
143 elect precipitator +<br />
gravimetric:<br />
28.5%;<br />
microscopy.<br />
acid-washed:<br />
54%<br />
ppt microscopy<br />
Hnizdo and Sluis- 1956- 30% precipitator +<br />
Cremer (1993)<br />
Rendall<br />
(unpublished thesis)<br />
1960<br />
microscopy<br />
Survey 1<br />
1987-8 17%<br />
588 gravimetric<br />
Survey 2<br />
1977 20%<br />
166 gravimetric<br />
Survey 3<br />
1977 17%<br />
90 gravimetric<br />
Survey 4a<br />
1964-7 22%<br />
112 gravimetric<br />
Hnizdo (personal 1970- 20%<br />
communication) 1989<br />
Kielblock (1997) ~1990 15.08% Not stated<br />
Churchyard (2004) 2000-1 14.3% Gravimetric +<br />
X-ray<br />
diffraction<br />
In the first supportive study Steenland and Brown (1995) found five cases of silicosis in the<br />
lowest dose group of 0 – 0.2 (mg/m 3 )-yr and considered the group to be a LOAEL (Table 10<br />
above). None of the BMDS models gave an acceptable fit at the p ≥ 0.05 level using six or seven<br />
silica levels. The closest was the quantal quadratic model (χ 2 = 9.62; p = 0.0473), which resulted<br />
in a BMC01 for silica of 0.43 (mg/m 3 )–yr using the six lowest levels of silica. In risk assessment,<br />
the highest dose or doses are often dropped in order to obtain an acceptable fit of the model to<br />
the data. This is reasonable with the benchmark approach since the highest doses should be least<br />
informative and the doses in the low dose region near the benchmark should be most informative<br />
for the benchmark concentration (USEPA, 1995; Filipsson et al., 2003). Fitting the probit model<br />
to the log dose of the five lowest silica levels from Steenland and Brown yielded a BMCL01 of<br />
0.34 (mg/m 3 )–yr CDE (χ 2 = 1.32; p value for fit = 0.5177). [For comparison, BMCL05 = 0.85<br />
(mg/m 3 )–yr CDE.] Fitting the quantal quadratic model gave a BMCL01 of 0.45 (mg/m 3 )–yr (χ 2 =<br />
3.36; p = 0.3395). Use of the BMC01 value of 0.34 (mg/m 3 )–yr CDE from the log dose probit<br />
model resulted in a chronic REL estimate for <strong>crystalline</strong> silica of 4 µg/m 3 . Steenland and Brown<br />
stated that “silicosis has no background rate for non-exposed populations that changes with age<br />
or calendar time” and thus they assumed that the five silicotics in the 0 – 0.2 (mg/m 3 )-yr were<br />
exposed to silica in the mines.<br />
In a second supportive study, Hughes et al. (1998) found six cases of silicosis in the lowest<br />
exposure group of ≤ 1 mg/m 3 -yr but considered that group to be a NOAEL, not a LOAEL. If the<br />
lowest exposure group is used as a NOAEL, a chronic REL of 10 µg/m 3 is calculated from the<br />
32