Silica (crystalline, respirable) - OEHHA
Silica (crystalline, respirable) - OEHHA
Silica (crystalline, respirable) - OEHHA
You also want an ePaper? Increase the reach of your titles
YUMPU automatically turns print PDFs into web optimized ePapers that Google loves.
FINAL February 2005<br />
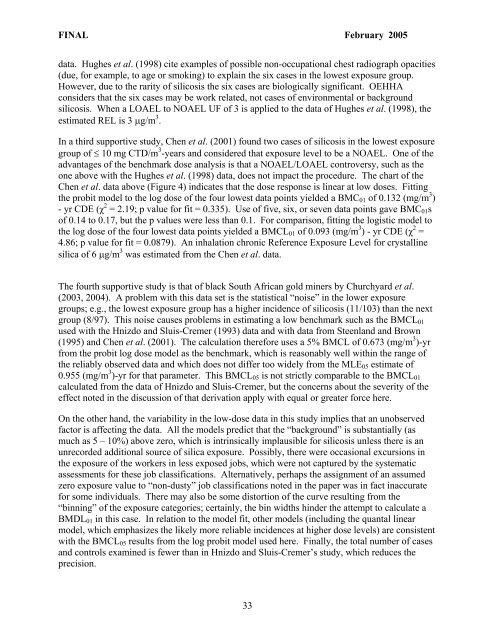
data. Hughes et al. (1998) cite examples of possible non-occupational chest radiograph opacities<br />
(due, for example, to age or smoking) to explain the six cases in the lowest exposure group.<br />
However, due to the rarity of silicosis the six cases are biologically significant. <strong>OEHHA</strong><br />
considers that the six cases may be work related, not cases of environmental or background<br />
silicosis. When a LOAEL to NOAEL UF of 3 is applied to the data of Hughes et al. (1998), the<br />
estimated REL is 3 µg/m 3 .<br />
In a third supportive study, Chen et al. (2001) found two cases of silicosis in the lowest exposure<br />
group of ≤ 10 mg CTD/m 3 -years and considered that exposure level to be a NOAEL. One of the<br />
advantages of the benchmark dose analysis is that a NOAEL/LOAEL controversy, such as the<br />
one above with the Hughes et al. (1998) data, does not impact the procedure. The chart of the<br />
Chen et al. data above (Figure 4) indicates that the dose response is linear at low doses. Fitting<br />
the probit model to the log dose of the four lowest data points yielded a BMC01 of 0.132 (mg/m 3 )<br />
- yr CDE (χ 2 = 2.19; p value for fit = 0.335). Use of five, six, or seven data points gave BMC01s<br />
of 0.14 to 0.17, but the p values were less than 0.1. For comparison, fitting the logistic model to<br />
the log dose of the four lowest data points yielded a BMCL01 of 0.093 (mg/m 3 ) - yr CDE (χ 2 =<br />
4.86; p value for fit = 0.0879). An inhalation chronic Reference Exposure Level for <strong>crystalline</strong><br />
silica of 6 µg/m 3 was estimated from the Chen et al. data.<br />
The fourth supportive study is that of black South African gold miners by Churchyard et al.<br />
(2003, 2004). A problem with this data set is the statistical “noise” in the lower exposure<br />
groups; e.g., the lowest exposure group has a higher incidence of silicosis (11/103) than the next<br />
group (8/97). This noise causes problems in estimating a low benchmark such as the BMCL01<br />
used with the Hnizdo and Sluis-Cremer (1993) data and with data from Steenland and Brown<br />
(1995) and Chen et al. (2001). The calculation therefore uses a 5% BMCL of 0.673 (mg/m 3 )-yr<br />
from the probit log dose model as the benchmark, which is reasonably well within the range of<br />
the reliably observed data and which does not differ too widely from the MLE05 estimate of<br />
0.955 (mg/m 3 )-yr for that parameter. This BMCL05 is not strictly comparable to the BMCL01<br />
calculated from the data of Hnizdo and Sluis-Cremer, but the concerns about the severity of the<br />
effect noted in the discussion of that derivation apply with equal or greater force here.<br />
On the other hand, the variability in the low-dose data in this study implies that an unobserved<br />
factor is affecting the data. All the models predict that the “background” is substantially (as<br />
much as 5 – 10%) above zero, which is intrinsically implausible for silicosis unless there is an<br />
unrecorded additional source of silica exposure. Possibly, there were occasional excursions in<br />
the exposure of the workers in less exposed jobs, which were not captured by the systematic<br />
assessments for these job classifications. Alternatively, perhaps the assignment of an assumed<br />
zero exposure value to “non-dusty” job classifications noted in the paper was in fact inaccurate<br />
for some individuals. There may also be some distortion of the curve resulting from the<br />
“binning” of the exposure categories; certainly, the bin widths hinder the attempt to calculate a<br />
BMDL01 in this case. In relation to the model fit, other models (including the quantal linear<br />
model, which emphasizes the likely more reliable incidences at higher dose levels) are consistent<br />
with the BMCL05 results from the log probit model used here. Finally, the total number of cases<br />
and controls examined is fewer than in Hnizdo and Sluis-Cremer’s study, which reduces the<br />
precision.<br />
33


