Silica (crystalline, respirable) - OEHHA
Silica (crystalline, respirable) - OEHHA
Silica (crystalline, respirable) - OEHHA

You also want an ePaper? Increase the reach of your titles
YUMPU automatically turns print PDFs into web optimized ePapers that Google loves.
FINAL February 2005<br />
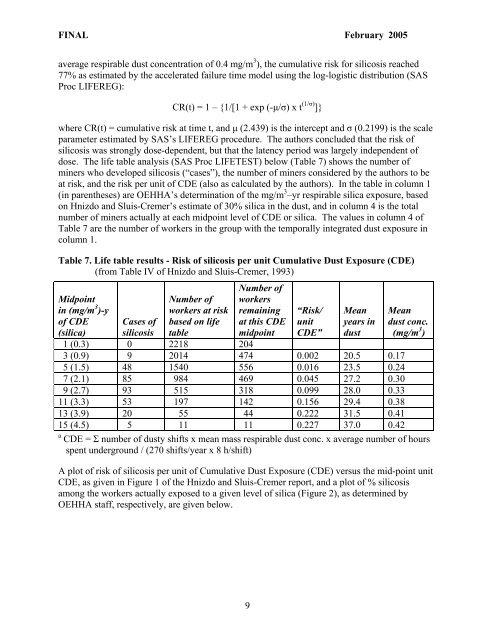
average <strong>respirable</strong> dust concentration of 0.4 mg/m 3 ), the cumulative risk for silicosis reached<br />
77% as estimated by the accelerated failure time model using the log-logistic distribution (SAS<br />
Proc LIFEREG):<br />
CR(t) = 1 – {1/[1 + exp (-µ/σ) x t (1/σ) ]}<br />
where CR(t) = cumulative risk at time t, and µ (2.439) is the intercept and σ (0.2199) is the scale<br />
parameter estimated by SAS’s LIFEREG procedure. The authors concluded that the risk of<br />
silicosis was strongly dose-dependent, but that the latency period was largely independent of<br />
dose. The life table analysis (SAS Proc LIFETEST) below (Table 7) shows the number of<br />
miners who developed silicosis (“cases”), the number of miners considered by the authors to be<br />
at risk, and the risk per unit of CDE (also as calculated by the authors). In the table in column 1<br />
(in parentheses) are <strong>OEHHA</strong>’s determination of the mg/m 3 –yr <strong>respirable</strong> silica exposure, based<br />
on Hnizdo and Sluis-Cremer’s estimate of 30% silica in the dust, and in column 4 is the total<br />
number of miners actually at each midpoint level of CDE or silica. The values in column 4 of<br />
Table 7 are the number of workers in the group with the temporally integrated dust exposure in<br />
column 1.<br />
Table 7. Life table results - Risk of silicosis per unit Cumulative Dust Exposure (CDE)<br />
(from Table IV of Hnizdo and Sluis-Cremer, 1993)<br />
Midpoint<br />
in (mg/m 3 )-y<br />
of CDE<br />
Number of<br />
workers at risk<br />
based on life<br />
Number of<br />
workers<br />
remaining<br />
at this CDE<br />
“Risk/<br />
unit<br />
CDE”<br />
Mean<br />
years in<br />
dust<br />
Mean<br />
dust conc.<br />
(mg/m 3 )<br />
(silica)<br />
Cases of<br />
silicosis table<br />
midpoint<br />
1 (0.3) 0 2218 204<br />
3 (0.9) 9 2014 474 0.002 20.5 0.17<br />
5 (1.5) 48 1540 556 0.016 23.5 0.24<br />
7 (2.1) 85 984 469 0.045 27.2 0.30<br />
9 (2.7) 93 515 318 0.099 28.0 0.33<br />
11 (3.3) 53 197 142 0.156 29.4 0.38<br />
13 (3.9) 20 55 44 0.222 31.5 0.41<br />
15 (4.5) 5 11 11 0.227 37.0 0.42<br />
a<br />
CDE = Σ number of dusty shifts x mean mass <strong>respirable</strong> dust conc. x average number of hours<br />
spent underground / (270 shifts/year x 8 h/shift)<br />
A plot of risk of silicosis per unit of Cumulative Dust Exposure (CDE) versus the mid-point unit<br />
CDE, as given in Figure 1 of the Hnizdo and Sluis-Cremer report, and a plot of % silicosis<br />
among the workers actually exposed to a given level of silica (Figure 2), as determined by<br />
<strong>OEHHA</strong> staff, respectively, are given below.<br />
9