Wiener Stadtwerke Annual Report 2012

Create successful ePaper yourself
Turn your PDF publications into a flip-book with our unique Google optimized e-Paper software.
The internal ratings of banks providing funding (assessments<br />
based on the Internal Ratings-Based Approach defined by<br />
Basel II) are drawn upon in order to assess the Group‘s<br />
creditworthiness. These regularly confirm the outstanding<br />
creditworthiness of <strong>Wiener</strong> <strong>Stadtwerke</strong>.<br />
The contingent liabilities of the <strong>Wiener</strong> <strong>Stadtwerke</strong> Group on<br />
the balance sheet date amount to EUR 496.6 million, around<br />
14.0 percent higher than a year earlier. This position primarily<br />
recognises US cross-border leasing transactions entered into by<br />
<strong>Wiener</strong> Linien, which are offset by means of rights of recourse in<br />
the same amount carried as assets, in addition to partly restricted<br />
and partly unrestricted comfort letters issued on behalf of<br />
e&t Energie Handelsgesellschaft m.b.H. As in the prior year,<br />
these contingent liabilities have been recorded under the<br />
balance sheet total as a net liability position (being the balance<br />
of energy purchase and sale contracts valued at market prices<br />
quoted on 31 December <strong>2012</strong>). Taking into account the<br />
contracts concluded by e&t Energie Handelsgesellschaft m.b.H.<br />
with its trading partners, the net liability position amounts to<br />
EUR 70.3 million (prior year: EUR 20.8 million), which accounts<br />
for the majority of the increase. The liabilities associated with<br />
e&t are partially offset by receivables in the amount of<br />
EUR 17.4 million.<br />
INVESTMENT AND FINANCIAL POSITIONS<br />
in EUR million <strong>2012</strong> 2011 ± ±%<br />
Investments in intangible<br />
assets<br />
18.8 20.7 -1.9 -9.4<br />
Investments in tangible assets 857.2 674.9 182.3 27.0<br />
Investments in financial assets 65.6 335.8 -270.2 -80.5<br />
Total investment 941.6 1,031.4 -89.8 -8.7<br />
Due to the change in the balance sheet date, the <strong>2012</strong> figures for the energy segment relate<br />
to five quarters<br />
In <strong>2012</strong>, the <strong>Wiener</strong> <strong>Stadtwerke</strong> Group undertook investments<br />
with a total volume of EUR 941.6 million, representing an<br />
increase of 8.9 percent even after taking the five quarters<br />
reported in the energy segment into account. The peak in<br />
investment activity seen in 2011 was attributable in part to the<br />
financial investment in shares in Verbund Innkraftwerke GmbH<br />
(Germany). In <strong>2012</strong>, on the other hand, there was a sharp rise in<br />
investment in tangible assets, which rose by 27.0 percent to<br />
EUR 857.2 million. Restated to take the fifth quarter in the<br />
energy segment into account, the increase still amounts to<br />
21.1 percent. This increase is foremostly accounted for by the<br />
assets acquired by <strong>Wiener</strong> <strong>Stadtwerke</strong> TownTown GmbH & Co<br />
Stationsturm KG and the first-time consolidation of Windnet<br />
Windkraftanlagenbetriebs-GmbH & Co KG and Vienna Energy<br />
Természeti Erö kft.<br />
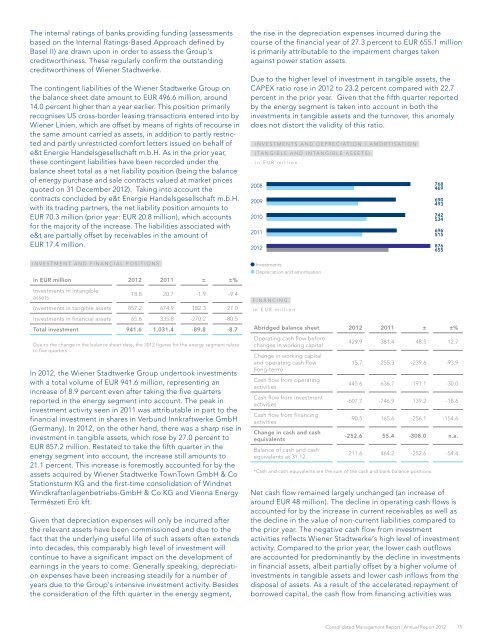
Given that depreciation expenses will only be incurred after<br />
the relevant assets have been commissioned and due to the<br />
fact that the underlying useful life of such assets often extends<br />
into decades, this comparably high level of investment will<br />
continue to have a significant impact on the development of<br />
earnings in the years to come. Generally speaking, depreciation<br />
expenses have been increasing steadily for a number of<br />
years due to the Group‘s intensive investment activity. Besides<br />
the consideration of the fifth quarter in the energy segment,<br />
the rise in the depreciation expenses incurred during the<br />
course of the financial year of 27.3 percent to EUR 655.1 million<br />
is primarily attributable to the impairment charges taken<br />
against power station assets.<br />
Due to the higher level of investment in tangible assets, the<br />
CAPEx ratio rose in <strong>2012</strong> to 23.2 percent compared with 22.7<br />
percent in the prior year. Given that the fifth quarter reported<br />
by the energy segment is taken into account in both the<br />
investments in tangible assets and the turnover, this anomaly<br />
does not distort the validity of this ratio.<br />
INVESTMENTS AND DEPRECIATION / AMORTISATION<br />
(TANGIBLE AND INTANGIBLE ASSETS)<br />
in EUR million<br />
2008 768<br />
469<br />
2009<br />
2010<br />
2011<br />
<strong>2012</strong><br />
Investments<br />
Depreciation and amortisation<br />
FINANCING<br />
in EUR million<br />
690<br />
493<br />
742<br />
534<br />
696<br />
515<br />
876<br />
655<br />
Abridged balance sheet <strong>2012</strong> 2011 ± ±%<br />
Operating cash flow before<br />
changes in working capital<br />
429.9 381.4 48.5 12.7<br />
Change in working capital<br />
and operating cash flow<br />
(long-term)<br />
Cash flow from operating<br />
activities<br />
Cash flow from investment<br />
activities<br />
Cash flow from financing<br />
activities<br />
Change in cash and cash<br />
equivalents<br />
Balance of cash and cash<br />
equivalents at 31.12.<br />
15.7 255.3 -239.6 -93.9<br />
445.6 636.7 -191.1 -30.0<br />
-607.7 -746.9 139.2 -18.6<br />
-90.5 165.6 -256.1 -154.6<br />
-252.6 55.4 -308.0 n.a.<br />
211.6 464.2 -252.6 -54.4<br />
*Cash and cash equivalents are the sum of the cash and bank balance positions.<br />
Net cash flow remained largely unchanged (an increase of<br />
around EUR 48 million). The decline in operating cash flows is<br />
accounted for by the increase in current receivables as well as<br />
the decline in the value of non-current liabilities compared to<br />
the prior year. The negative cash flow from investment<br />
activities reflects <strong>Wiener</strong> <strong>Stadtwerke</strong>‘s high level of investment<br />
activity. Compared to the prior year, the lower cash outflows<br />
are accounted for predominantly by the decline in investments<br />
in financial assets, albeit partially offset by a higher volume of<br />
investments in tangible assets and lower cash inflows from the<br />
disposal of assets. As a result of the accelerated repayment of<br />
borrowed capital, the cash flow from financing activities was<br />
Consolidated Management <strong>Report</strong> | <strong>Annual</strong> <strong>Report</strong> <strong>2012</strong><br />
15