Wiener Stadtwerke Annual Report 2012

You also want an ePaper? Increase the reach of your titles
YUMPU automatically turns print PDFs into web optimized ePapers that Google loves.
available at a charge. Furthermore, the <strong>Wiener</strong> Lokalbahnen<br />
Group is a Europe-wide operator of rail cargo and a provider<br />
of transport services for the disabled.<br />
External factors<br />
As a result of the Public Finance Act (BBG), the Energy Tax<br />
Rebate Act (EAVG) was amended. While production and<br />
service companies have been able to claim back energy tax<br />
over and above a certain defined threshold of the net<br />
production value since 2002, the intention is for a rebate to<br />
only be possible for companies in the manufacturing sector.<br />
The Public Finance Act makes this subject to the regulation<br />
only being applied in the case of companies for whom the<br />
European Commission has approved state aid. Among others,<br />
the <strong>Wiener</strong> Linien division and the <strong>Wiener</strong> Lokalbahnen Group<br />
would lose a considerable amount of their energy tax rebates<br />
as a result of the new legislation. Since <strong>2012</strong>, a legal case<br />
disputing the Energy Tax Rebate Act has been ongoing at the<br />
Constitutional Court.<br />
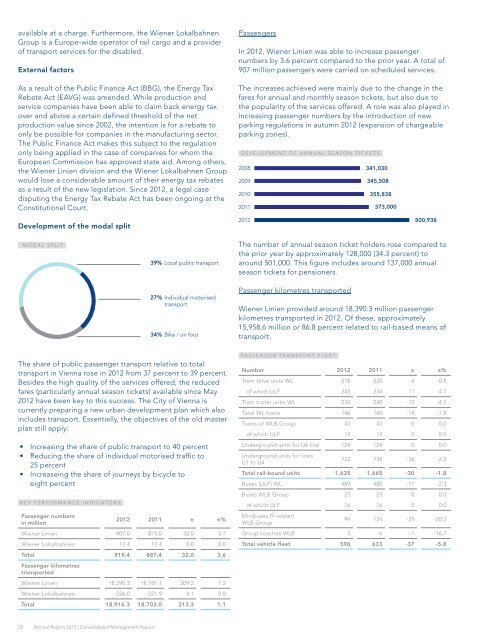
Development of the modal split<br />
MODAL SPLIT<br />
22 <strong>Annual</strong> <strong>Report</strong> <strong>2012</strong> | Consolidated Management <strong>Report</strong><br />
39% Local public transport<br />
27% Individual motorised<br />
transport<br />
34% Bike / on foot<br />
The share of public passenger transport relative to total<br />
transport in Vienna rose in <strong>2012</strong> from 37 percent to 39 percent.<br />
Besides the high quality of the services offered, the reduced<br />
fares (particularly annual season tickets) available since May<br />
<strong>2012</strong> have been key to this success. The City of Vienna is<br />
currently preparing a new urban development plan which also<br />
includes transport. Essentially, the objectives of the old master<br />
plan still apply:<br />
• Increasing the share of public transport to 40 percent<br />
• Reducing the share of individual motorised traffic to<br />
25 percent<br />
• Increaseing the share of journeys by bicycle to<br />
eight percent<br />
KEy PERFORMANCE INDICATORS<br />
passenger numbers<br />
in million<br />
<strong>2012</strong> 2011 ± ±%<br />
<strong>Wiener</strong> Linien 907.0 875.0 32.0 3.7<br />
<strong>Wiener</strong> Lokalbahnen 12.4 12.4 0.0 0.0<br />
Total 919.4 887.4 32.0 3.6<br />
passenger kilometres<br />
transported<br />
<strong>Wiener</strong> Linien 18,390.3 18,181.1 209.2 1.2<br />
<strong>Wiener</strong> Lokalbahnen 526.0 521.9 4.1 0.8<br />
Total 18,916.3 18,703.0 213.3 1.1<br />
Passengers<br />
In <strong>2012</strong>, <strong>Wiener</strong> Linien was able to increase passenger<br />
numbers by 3.6 percent compared to the prior year. A total of<br />
907 million passengers were carried on scheduled services.<br />
The increases achieved were mainly due to the change in the<br />
fares for annual and monthly season tickets, but also due to<br />
the popularity of the services offered. A role was also played in<br />
increasing passenger numbers by the introduction of new<br />
parking regulations in autumn <strong>2012</strong> (expansion of chargeable<br />
parking zones).<br />
DEVELOPMENT OF ANNUAL SEASON TICKETS<br />
2008<br />
2009<br />
2010<br />
2011<br />
<strong>2012</strong><br />
341,030<br />
345,508<br />
355,838<br />
373,000<br />
500,936<br />
The number of annual season ticket holders rose compared to<br />
the prior year by approximately 128,000 (34.3 percent) to<br />
around 501,000. This figure includes around 137,000 annual<br />
season tickets for pensioners.<br />
Passenger kilometres transported<br />
<strong>Wiener</strong> Linien provided around 18,390.3 million passenger<br />
kilometres transported in <strong>2012</strong>. Of these, approximately<br />
15,958.6 million or 86.8 percent related to rail-based means of<br />
transport.<br />
PASSENGER TRANSPORT FLEET<br />
number <strong>2012</strong> 2011 ± ±%<br />
Tram drive units WL 516 520 -4 -0.8<br />
of which ULF 245 234 11 4.7<br />
Tram trailer units WL 230 240 -10 -4.2<br />
Total WL trams 746 760 -14 -1.8<br />
Trams of WLB Group 43 43 0 0.0<br />
of which ULF 14 14 0 0.0<br />
Underground units for U6 line 124 124 0 0.0<br />
Underground units for lines<br />
U1 to U4<br />
722 738 -16 -2.2<br />
Total rail-bound units 1,635 1,665 -30 -1.8<br />
Buses (ULF) WL 469 480 -11 -2.3<br />
Buses WLB Group 23 23 0 0.0<br />
of which ULF 16 16 0 0.0<br />
Minibuses (9-seater)<br />
WLB Group<br />
99 124 -25 -20.2<br />
Group coaches WLB 5 6 -1 -16.7<br />
Total vehicle fleet 596 633 -37 -5.8