

Emerging contaminants in groundwater - NERC Open Research ...
Emerging contaminants in groundwater - NERC Open Research ...
Emerging contaminants in groundwater - NERC Open Research ...

Create successful ePaper yourself
Turn your PDF publications into a flip-book with our unique Google optimized e-Paper software.
OR/11/013<br />
Parsons et al. (2008) carried out an assessment of risk from pesticide metabolites for both the<br />
US and the UK. For the UK, 54 pesticides were identified as represent<strong>in</strong>g 90% of all pesticide<br />
use. The three highest use pesticides without relevant metabolites data were stated to be<br />
chlormequat, MCPP and tri-allate.<br />
A risk <strong>in</strong>dex (RI) was used derived from an exposure <strong>in</strong>dex, E and the acceptable daily <strong>in</strong>take<br />
<strong>in</strong> mg kg -1 body weight day -1 (ADI):<br />
E = A×F×P<br />
where A = amount <strong>in</strong>dex (derived from usage and fraction of metabolite formed), F = fraction<br />
of metabolite <strong>in</strong> the aqueous phase (derived from Kd) and P = persistence <strong>in</strong>dex (derived from<br />
DT50)<br />
and RI = E/ADI<br />
Table A1.2, Appendix 1, shows metabolites assessed as hav<strong>in</strong>g a risk <strong>in</strong>dex of >0.5.<br />
Metabolites with <strong>in</strong>sufficient data were assigned a conservative default. Compounds with the<br />
highest risk <strong>in</strong>dex were metabolites of cyanaz<strong>in</strong>e, followed by those of isoproturon,<br />
flufenacet, tebuconazole and dicamba.<br />
4.4.2 Simple hazard assessment for pesticide metabolites<br />
A simple hazard assessment was made as part of this study. Significant metabolites were<br />
identified from the Footpr<strong>in</strong>t website. Key metabolites for pesticides with usage of<br />
>50,000 ha are listed <strong>in</strong> Table A1.3, Appendix 1. Some properties are also available for<br />
metabolites but these are much less comprehensive than for the parent compounds. The<br />
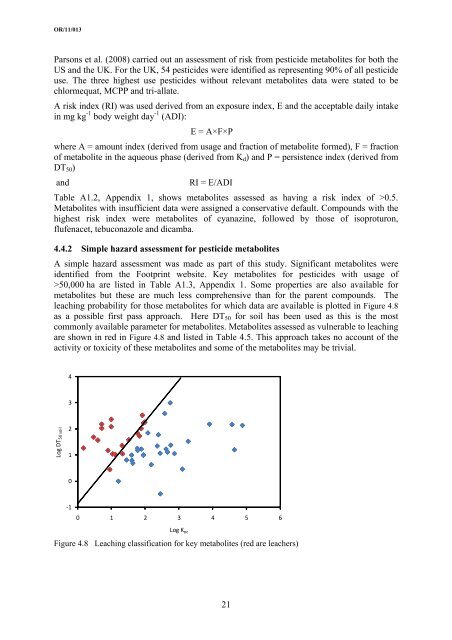
leach<strong>in</strong>g probability for those metabolites for which data are available is plotted <strong>in</strong> Figure 4.8<br />
as a possible first pass approach. Here DT50 for soil has been used as this is the most<br />
commonly available parameter for metabolites. Metabolites assessed as vulnerable to leach<strong>in</strong>g<br />
are shown <strong>in</strong> red <strong>in</strong> Figure 4.8 and listed <strong>in</strong> Table 4.5. This approach takes no account of the<br />
activity or toxicity of these metabolites and some of the metabolites may be trivial.<br />
Log DT 50 soil<br />
4<br />
3<br />
2<br />
1<br />
0<br />
‐1<br />
0 1 2 3 4 5 6<br />
Log K oc<br />
Figure 4.8 Leach<strong>in</strong>g classification for key metabolites (red are leachers)<br />
21


