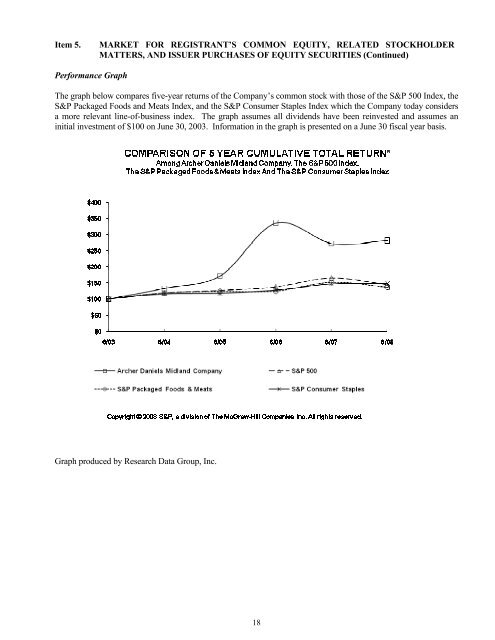
Item 5. MARKET FOR REGISTRANT’S COMMON EQUITY, RELATED STOCKHOLDER MATTERS, AND ISSUER PURCHASES OF EQUITY SECURITIES (Continued) Performance Graph The graph below compares five-year returns of the Company’s common stock with those of the S&P 500 Index, the S&P Packaged Foods and Meats Index, and the S&P Consumer Staples Index which the Company today considers a more relevant line-of-business index. The graph assumes all dividends have been reinvested and assumes an initial investment of $100 on June 30, 2003. Information in the graph is presented on a June 30 fiscal year basis. Graph produced by Research Data Group, Inc. 18
Item 6. SELECTED FINANCIAL DATA Selected Financial Data (In millions, except ratio and per share data) 2008 2007 2006 2005 2004 Net sales and other operating income $69,816 $44,018 $36,596 $35,943 $36,151 Depreciation 721 701 657 665 686 Net earnings 1,802 2,162 1,312 1,044 495 Basic earnings per common share 2.80 3.32 2.01 1.60 0.76 Diluted earnings per common share 2.79 3.30 2.00 1.59 0.76 Cash dividends 316 281 242 209 174 Per common share 0.49 0.43 0.37 0.32 0.27 Working capital $10,834 $7,254 $5,661 $4,344 $3,589 Current ratio 1.7 1.9 1.9 1.8 1.5 Inventories 10,160 6,060 4,677 3,907 4,592 Net property, plant, and equipment 7,125 6,010 5,293 5,184 5,255 Gross additions to property, plant, and equipment 1,789 1,404 841 647 621 Total assets 37,056 25,118 21,269 18,598 19,369 Long-term debt 7,690 4,752 4,050 3,530 3,740 Shareholders’ equity 13,490 11,253 9,807 8,435 7,698 Per common share 20.95 17.50 14.95 12.96 11.83 Weighted average shares outstanding-basic 644 651 654 654 648 Weighted average shares outstanding-diluted 646 656 656 656 650 Significant items affecting the comparability of the financial data shown above are as follows. • Net earnings for 2007 include a gain of $440 million ($286 million after tax, equal to $0.44 per share) related to the exchange of the Company’s interests in certain Asian joint ventures for shares of Wilmar International Limited, realized securities gains of $357 million ($225 million after tax, equal to $0.34 per share) related to the Company’s sale of equity securities of Tyson Foods Inc. and Overseas Shipholding Group Inc. and a $209 million gain ($132 million after tax, equal to $0.20 per share) related to the sale of businesses. • Net earnings for 2005 include a gain of $159 million ($119 million after tax, equal to $0.18 per share) related to the sale of the Company’s interest in Tate & Lyle PLC. • Net earnings for 2004 include a $400 million charge ($252 million after tax, equal to $0.39 per share) related to the settlement of fructose litigation. 19