

APIP Agricultural Policy Implementation Project
APIP Agricultural Policy Implementation Project
APIP Agricultural Policy Implementation Project

Create successful ePaper yourself
Turn your PDF publications into a flip-book with our unique Google optimized e-Paper software.
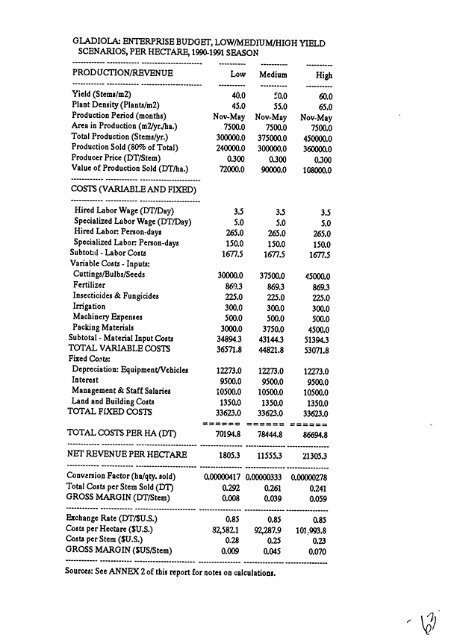
GLADIOLA- ENTERPRISE BUDGET, LOW/MEDIUM/HIGH YIELD<br />
SCENARIOS, PER HECTARE, 1990-1991 SEASON<br />
PRODUCTION/REVENUE Low Medium High<br />
------------- ------------------<br />
Yield (Stems/m2)<br />
Plant Density (Plants/m2)<br />
Production Period (months)<br />
Area in Production (m2/yr./ha.)<br />
---------- ---------- ....<br />
40.0 0.0 60.0<br />
45.0 55.0 65.0<br />
Nov-May Nov-May Nov-May<br />
7500.0 7500.0 7500.0<br />
Total Production (Stems/yr.)<br />
Production Sold (80% of Total)<br />
Producer Price (DT/Stem)<br />
Value of Production Sold (DT/ha.)<br />
300000.0<br />
240000.0<br />
0.300<br />
72000.0<br />
375000.0<br />
300000.0<br />
0.300<br />
90000.0<br />
450000.0<br />
360000.0<br />
0.300<br />
108000.0<br />
------ --------------------- -<br />
COSTS (VARIABLE AND FIXED)<br />
------------ .------- .---- .....-------------<br />
Hired Labor Wage (DT/Day)<br />
Specialized Labor Wage (DT/Day)<br />
Hired Labor Person-days<br />
Specialized Labor: Person-days<br />
Subtotal - Labor Costs<br />
Variable Costs - Inputs:<br />
3.5<br />
5.0<br />
265.0<br />
150.0<br />
1677.5<br />
3.5<br />
5.0<br />
265.0<br />
150.0<br />
1677.5<br />
3.5<br />
5.0<br />
265.0<br />
150.0<br />
1677.5<br />
Cuttings/Bulbs/Seeds 30000.0 37500.0 45000.0<br />
Fertilizer<br />
Insecticides & Fungicides<br />
Irrigation<br />
Machinery Expenses<br />
Packing Materials<br />
Subtotal - Material Input Costs<br />
TOTAL VARIABLE COSTS<br />
Fixed Cotts:<br />
869.3<br />
225.0<br />
300.0<br />
500.0<br />
3000.0<br />
34894.3<br />
36571.8<br />
869.3<br />
225.0<br />
300.0<br />
500.0<br />
3750.0<br />
43144.3<br />
44821.8<br />
869.3<br />
225.0<br />
300.0<br />
500.0<br />
4500.0<br />
51394.3<br />
53071.8<br />
Depreciation: Equipment/Vehicles<br />
Interest<br />
Management &Staff Salaries<br />
12273.0<br />
9500.0<br />
10500.0<br />
12273.0<br />
9500.0<br />
10500.0<br />
12273.0<br />
9500.0<br />
10500.0<br />
Land and Building Costs 1350.0 1350.0 1350.0<br />
TOTAL FIXED COSTS 33623.0 33623.0 33623.0<br />
TOTAL COSTS PER HA (DT) 70194.8 78444.8 86694.8<br />
------------- - ---------<br />
NET REVENUE PER HECTARE<br />
------------ --------------- -------------<br />
1805.3 11555.3 21305.3<br />
------------- -----------<br />
Conversion Factor (ha/qty. sold)<br />
Total Costs per Stem Sold (Dr)<br />
GROSS MARGIN (DT/Stem)<br />
------------ --------------- -------------<br />
0.00000417 0.00000333 0.00000278<br />
0.292 0.261 0.241<br />
0.008 0.039 0.059<br />
------- . ..--.------------.--.... ---------- .......------------------------- ----------------<br />
Exchange Rate (DT/$U.S.) 0.85 0.85 0.85<br />
Costs per Hectare ($U.S.) 82,582.1 92,287.9 10:993.8<br />
Costs per Stem ($U.S.) 0.28 0.25 0.23<br />
GROSS MARGIN ($US/Stem) 0.009 0.045 0.070<br />
....-.... ........-...........-....-............ ................ ...............................<br />
Sources: See ANNEX 2 of this report for notes on calculations.


