Spectroscopic Ellipsometry (Sopra GES 5) - Login | Nanolab, UCLA
Spectroscopic Ellipsometry (Sopra GES 5) - Login | Nanolab, UCLA
Spectroscopic Ellipsometry (Sopra GES 5) - Login | Nanolab, UCLA

You also want an ePaper? Increase the reach of your titles
YUMPU automatically turns print PDFs into web optimized ePapers that Google loves.
SE <strong>Sopra</strong> <strong>GES</strong> 5 <strong>UCLA</strong> Nanoelectronic Facility<br />
Superusers:<br />
<strong>Spectroscopic</strong> <strong>Ellipsometry</strong><br />
(<strong>Sopra</strong> <strong>GES</strong> 5)<br />
PREPARED BY: You-Sheng (Wilson) Lin, <strong>Nanolab</strong> Staff<br />
10-10-2004<br />
Steve Franz X68923<br />
Tom Lee X64641<br />
You-Sheng Lin X68923<br />
1
SE <strong>Sopra</strong> <strong>GES</strong> 5 <strong>UCLA</strong> Nanoelectronic Facility<br />
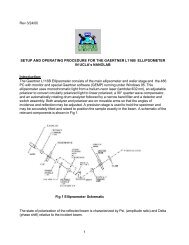
I. Introduction<br />
A. Principle<br />
<strong>Spectroscopic</strong> ellipsometry (SE) is a non-contact, non-destructive optical technique that<br />
enables the determination of material refractive indices and layer thicknesses by<br />
measuring the change in polarization of a probing light beam upon reflection from a<br />
sample. When linearly polarized light reflects from a surface, elliptically polarized light<br />
is generated under certain conditions. The amount of induced ellipticity depends on the<br />
surface properties (refractive index, bulk or layered sample…). <strong>Ellipsometry</strong> technique<br />
measures the phase and amplitude relationships between two orthogonal polarizations (p<br />
and s waves) upon reflection. When p and s waves are reflected, they experience a phase<br />
shift and an amplitude reduction (not necessarily the same for both waves). The<br />
ellipsometric parameter Delta is defined as d1 - d2 where d1 and d2 denotes the induced<br />
phase shift difference between p and s waves, respectively while the ellipsometric<br />
parameter tan(Psi) is defined as the ratio of the complex amplitude of the total reflection<br />
coefficient of the p and s waves ( |RP| / |RS| ). <strong>Ellipsometry</strong> is said to be self-referencing<br />
because measurements do not require any reference sample and are largely insensitive to<br />
variations in the beam intensity and ambient environment, making this technique highly<br />
accurate and reproducible.<br />
B. Instrumentation<br />
The <strong>Sopra</strong> <strong>GES</strong> 5 spectroscopic ellipsometer allows for variable-angle broadband<br />
spectroscopic ellipsometry. It covers a spectral range from 210 nm to 900 nm. And<br />
2
SE <strong>Sopra</strong> <strong>GES</strong> 5 <strong>UCLA</strong> Nanoelectronic Facility<br />
upgradable for wider spectal range in DUV, NIR, and IR ranges. The UV/Visible/NIR<br />
source is a Xenon lamp whose maximum of intensity is located at 450 nm. Two<br />
attenuators are available corresponding to an attenuation of 17 % and 7 % respectively<br />
and the system can be set to automatically remove them during a measurement when the<br />
intensity is very low in order to improve the signal to noise ratio. Our configuration in the<br />
UV-Visible-NIR spectrum is rotating polarizer - fixed analyzer ellipsometry. When the<br />
polarizer rotates, the incident beam is linearly polarized with a direction that rotates in<br />
time. After reflection on the sample, the light is elliptically polarized with its axis<br />
rotating in time. After the analyzer, the light is again linearly polarized with a fixed<br />
direction and a time dependent amplitude. The advantage of this technique is that the<br />
measurement is not affected by the polarization sensitivity of the detector (fixed<br />
polarization) but it requires a perfectly randomly polarized incident beam. The beam size<br />
is typically between 1 mm 2 and 10 mm 2 depending on the aperture. The variable angles<br />
are from 7º to 90º with variable +/- 0.01º.<br />
C. Analysis<br />
The ellipsometric parameters are fitted using the Levenberg-Marquardt regression<br />
method. Different models are available to describe the dispersion relation of the refractive<br />
index of the measured materials including the Gaussian and Lorentz oscillator models,<br />
the Cauchy and Sellmeir laws, the Kramers-Kronig relations, the Forouhi interband<br />
model, the model dielectric function, the Drude model... Point to point calculation (i.e.<br />
calculation of the n and k values from the data at each wavelength for a single layer of<br />
known thickness) is also possible. In addition, whenever the sample is bulk or can be<br />
3
SE <strong>Sopra</strong> <strong>GES</strong> 5 <strong>UCLA</strong> Nanoelectronic Facility<br />
treated as such because of its strong absorption, the dispersion relation is simply obtained<br />
by direct calculation of n and k at all wavelengths without any assumption.<br />
II. Operating Procedure<br />
A. Define the spectral range for the measurement<br />
This procedure will help users to define measurement parameters before starting a<br />
measurement.<br />
1) Definition of the spectral range<br />
• Open Winelli<br />
• Go to File and select Simulation.<br />
The Simulation Parameters Window appears.<br />
• Select Model to define the structure that you will simulate<br />
a. In the folder “Structure”:<br />
• Make sure the Layer type is material<br />
• Add or subtract desire layers<br />
• Click the each layer, and select the material data from the files (by click on the<br />
4
SE <strong>Sopra</strong> <strong>GES</strong> 5 <strong>UCLA</strong> Nanoelectronic Facility<br />
blank space) for the appropriate N.K file. Also, enter the composition and<br />
concentrations if applicable.<br />
• Enter the thickness of the film and by checking the box next to the thickness<br />
will try to fit the thickness close to the estimate thickness.<br />
b. In the folder “Boundaries”:<br />
• Make sure the WaveLength is Variable and Unit is µm.<br />
• Define the first, the last wavelengths and the number of points for the<br />
measurements. Initiate with the visible spectrum (0.3 µm- 0.8 µm) and 200 points<br />
to describe precisely the sample.<br />
• Enter the incidence angle that you will use during the measurement (use 75º).<br />
5
SE <strong>Sopra</strong> <strong>GES</strong> 5 <strong>UCLA</strong> Nanoelectronic Facility<br />
c. In the folder “Special”:<br />
• Check the microspot box (the aperture typically equals 2.0). If you don’t want to<br />
use microspot, please ask staff or superusers for assistant.<br />
• Then press Run. You will come back to the Simulation Parameters Window.<br />
• Press Simulation to plot tan(ψ) and cos(∆) (for the structure you defined in<br />
‘Model’)<br />
6
SE <strong>Sopra</strong> <strong>GES</strong> 5 <strong>UCLA</strong> Nanoelectronic Facility<br />
• Go back to the Simulation Parameters Window. Change the Output (in the right<br />
bottom corner) from graphic to spreadsheet.<br />
• Press Simulation one more time to obtain the values of tan (ψ) and cos (∆) in an<br />
array.<br />
Go to Analysis and select Adjustment. This mode gives you the possibility to change<br />
manually the parameters of your model.<br />
7
SE <strong>Sopra</strong> <strong>GES</strong> 5 <strong>UCLA</strong> Nanoelectronic Facility<br />
• The ‘structure’ screen appears. Check the parameters that you want to vary manually (Thickness,<br />
concentration, …).<br />
• Press Run<br />
• Now, you can adjust manually by using the slide or typing a number, every parameter<br />
checked in the structure.<br />
• So you are able to define the spectral range where the measurements are the most<br />
8
SE <strong>Sopra</strong> <strong>GES</strong> 5 <strong>UCLA</strong> Nanoelectronic Facility<br />
sensitive to parameters variations.<br />
• Then save and exit. (A window should appear concerning the regression. Don’t take<br />
care of it, and select the Simulation Parameters Window)<br />
2) Definition of the optimum number of wavelengths for the measurement<br />
B. Sample alignment Procedure<br />
• Open Gespack by double click the Gespack icon<br />
User: Engineer<br />
Password: <strong>Sopra</strong><br />
1. Place the wafer on the sample stage<br />
2. Make sure the stage is low enough for 75º by lowering the Z<br />
stage.<br />
3. Click on the Show<br />
4. Change the parameter values :<br />
a. λ : the most intense wavelength 0.45 micron<br />
b. Angle of analyzer : 45°<br />
c. Plan of incidence: 75°<br />
5. Press Run (Wait for 1 minute, and the count, signal.......)<br />
6. Adjust the Z position to obtain maximum of signal<br />
7. Attenuators On as required to keep signal around 10 millions<br />
9
SE <strong>Sopra</strong> <strong>GES</strong> 5 <strong>UCLA</strong> Nanoelectronic Facility<br />
8. If the signal is below 5 millions counts, open the slit (right hand side under the table)<br />
to get 10 millions.<br />
9. Adjust the tilt of the sample holder (with both screws) to obtain the maximum signal<br />
and to obtain a symmetry between -1 and +1 if needed.<br />
10. Turn the Attenuators ON as required to keep signal around 10 millions<br />
11. Adjust the Z position again to obtain maximum signal<br />
12. Turn the Attenuators ON as required to keep signal around 10 millions<br />
13. Adjust the slit of the spectrometer to obtain 10 millions.<br />
14. If the slit is fully opened and you don’t have 10 millions, the let the slit fully opened<br />
15. Stop and Exit<br />
• Parameters for the measurement<br />
Analyzer Position Mode (Please make sure that all the following parameters are correct<br />
and don’t change anything unless you discuss with superuser or staff)<br />
In the “Polarisation/Geometry folder”,<br />
Previous tracking: Adjust the analyzer position at ψ where tan ψ is the first<br />
ellipsometric parameter of the previous measurement. More usual mode to<br />
make measurements. You need to put a starting position different than zero<br />
(45 is good). Does not work for very thick samples and a low number of<br />
points (when tan ψ is closed to 0, ψ is closed to 0, so the analyzer position<br />
will be at 0)<br />
10
SE <strong>Sopra</strong> <strong>GES</strong> 5 <strong>UCLA</strong> Nanoelectronic Facility<br />
Incidence angle<br />
Fixed: at the indicated position all along the measurement<br />
Use of calibrated angel: Yes<br />
Theory Angel: 75 and Mea. 75.2<br />
In the “Time and wavelength” folder,<br />
Integration time<br />
Variable: The integration time can change depending on the number of<br />
counts on the detector. The measurement stop is the number of counts<br />
exceed a given value (generally 4 000 000) of a given time (generally 10s or<br />
5s)<br />
Spectrometer position<br />
Scanned: for spectroscopic measurement. Enter the values obtained in step 1<br />
Unit: µm<br />
From the simulated result, put correct set to get right measurement duration.<br />
(Ex: From 0.25 to 0.85; step: 0.003 Number of points = 200)<br />
Background noise<br />
In the “Other” folder,<br />
Meas/Scan: measured at the beginning of each scan<br />
11
SE <strong>Sopra</strong> <strong>GES</strong> 5 <strong>UCLA</strong> Nanoelectronic Facility<br />
Signal correction<br />
Special<br />
Non Linearity + polarization: makes correction of the non linearity of the<br />
detector and of the residual polarization using the values calibrated in the<br />
GETEST software (Mostly used)<br />
Use attenuators: Checked when you adjust the signal on the detector with<br />
both attenuators (Used for optimized the measurement and reduce the noise)<br />
Microspots<br />
Press Run/Accept<br />
C. Start the Measurement<br />
1. By click the Run bottom<br />
2. Depending on the number of data points, it will take up to 20 minutes.<br />
3. At the end of the measurement, save it and analyze it with the software WINELLI<br />
III. Analysis of the data<br />
A. Thickness measurement analysis<br />
1. Open Winelli software<br />
2. Open last measurement data (filename.dat)<br />
12
SE <strong>Sopra</strong> <strong>GES</strong> 5 <strong>UCLA</strong> Nanoelectronic Facility<br />
3. Enter in Analysis menu and Select Regression.<br />
4. Define the structure of your film mixed with void (void.nk)<br />
5. Fit on the thickness of the film and on the concentration of void. Click Run the<br />
regression using function “cos(2psi) and sin(2psi)*cos(delta)” (if you have film<br />
> 500 A) mode.<br />
6. Examine the curve<br />
7. Save and print the regression results.<br />
8. You can fine the thickness data from the table.<br />
B. Analysis using a Cauchy dispersion law (for better fitting, optional)<br />
1. Go back to the Structure screen (Right next to Run on the top)<br />
2. Change the “layer type” into dispersion law and click on “Law parameters”.<br />
3. Select Standard Dielectric Function, UV term, and Cauchy (n,k). Ex: For oxide<br />
films, enter as started values 1.45 for A, 0.01 for B and fit on the three parameters<br />
A,B,C.<br />
4. Fit on the thickness for films. Run the regression using “cos(2psi) and<br />
sin(2psi)*cos(delta)” mode.<br />
5. Examine the curve and fit.<br />
6. Save and Print the regression.<br />
7. Bo back to the structure screen and in law parameter screen. Save the refractive<br />
index as Cauchy.nk.<br />
8. Exit the regression.<br />
13
SE <strong>Sopra</strong> <strong>GES</strong> 5 <strong>UCLA</strong> Nanoelectronic Facility<br />
Appendix:<br />
In the Analyzer<br />
In the “Polarisation/Geometry folder”,<br />
Previous tracking: Adjust the analyzer position at ψ where tan ψ is the first<br />
ellipsometric parameter of the previous measurement. More usual mode to<br />
make measurements. You need to put a starting position different than zero<br />
(45 is good). Does not work for very thick samples and a low number of<br />
points (when tan ψ is closed to 0, ψ is closed to 0, so the analyzer position<br />
will be at 0)<br />
Current tracking: At each step make a first measurement to found tan ψ and<br />
then adjust the analyzer position to ψ. Best accuracy but the measurement is<br />
increased.<br />
Limited tracking: Same mode as previous tracking but the minimum angle<br />
will be 5 degrees. Avoid to have an analyzer position to 0.<br />
Fixed: at the indicated position all along the measurement (not optimized for<br />
accuracy)<br />
14
SE <strong>Sopra</strong> <strong>GES</strong> 5 <strong>UCLA</strong> Nanoelectronic Facility<br />
Incidence angle<br />
Scanned: The angle of incidence is scanned during the measurement.<br />
Fixed: at the indicated position all along the measurement<br />
Use of calibrated angel: Yes<br />
Theory Angel: 75 and Mea. 75.2<br />
In the “Time and wavelength” folder,<br />
Integration time<br />
Scanned: You can repeat the same measurement with a given time step (only<br />
interesting for non stable samples).<br />
Fixed: at the indicated value all along the measurement (non optimized)<br />
Variable: The integration time can change depending on the number of<br />
counts on the detector. The measurement stop is the number of counts<br />
exceed a given value (generally 4 000 000) of a given time (generally 10s or<br />
5s)<br />
SNR: You must indicate the integration time for one measurement, a target<br />
value for the SNR, and a maximum number of iterations<br />
15
SE <strong>Sopra</strong> <strong>GES</strong> 5 <strong>UCLA</strong> Nanoelectronic Facility<br />
Spectrometer position<br />
Scanned: for spectroscopic measurement. Enter the values obtained in step 1<br />
Unit: µm<br />
From the simulated result, put correct set to get right measurement duration.<br />
(Ex: From 0.25 to 0.85; step: 0.003 Number of points = 200)<br />
Fixed: at the indicated position all along the measurement (variable angle<br />
measurement for example)<br />
In both case, the measurement can be done in eV, µm, nm or cm -1 .<br />
Background noise<br />
In the “Other” folder,<br />
Default: fixed at the indicated value (counts/s).<br />
Meas/Scan: measured at the beginning of each scan<br />
Meas/Int: measured before each measurement<br />
16
SE <strong>Sopra</strong> <strong>GES</strong> 5 <strong>UCLA</strong> Nanoelectronic Facility<br />
Signal correction<br />
Special<br />
No correction: no correction for the measured signal (no optimized)<br />
Non Linearity: makes correction of the non linearity of the detector using<br />
the values calibrated in the GETEST software<br />
Non Linearity + polarization: makes correction of the non linearity of the<br />
detector and of the residual polarization using the values calibrated in the<br />
GETEST software (Mostly used)<br />
Use attenuators: Checked when you adjust the signal on the detector with<br />
both attenuators (Used for optimized the measurement and reduce the noise)<br />
Use Microspots<br />
Mirror analyzer: make twice the measurement at A and –A for the analyzer<br />
position (used only for the calibration)<br />
Init Spectrometer: makes an initialization of the spectrometer before each<br />
scanning measurement<br />
Init Goniometer: makes an initialization of the goniometer each scanning<br />
17
SE <strong>Sopra</strong> <strong>GES</strong> 5 <strong>UCLA</strong> Nanoelectronic Facility<br />
measurement<br />
Compensator: only available if compensator option is checked in the setup<br />
of the instrument<br />
18