Annual Report 2007
Annual Report 2007
Annual Report 2007

You also want an ePaper? Increase the reach of your titles
YUMPU automatically turns print PDFs into web optimized ePapers that Google loves.
A n n u a l R e p o r t 2 0 0 7<br />
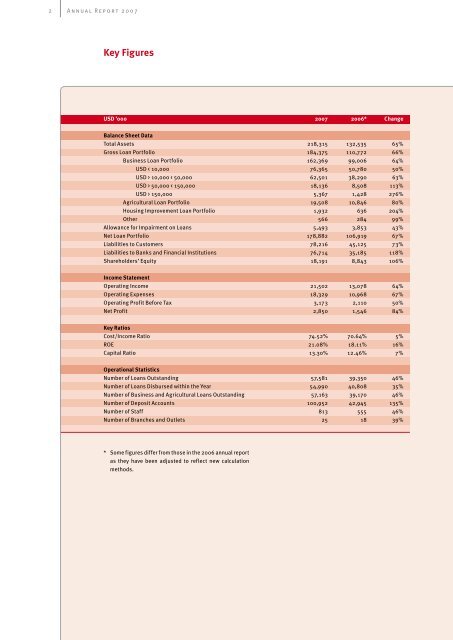
Key Figures<br />
USD ’000 <strong>2007</strong> 2006* Change<br />
Balance Sheet Data<br />
Total Assets 218,315 132,535 65%<br />
Gross Loan Portfolio 184,375 110,772 66%<br />
Business Loan Portfolio 162,369 99,006 64%<br />
USD < 10,000 76,365 50,780 50%<br />
USD > 10,000 < 50,000 62,501 38,290 63%<br />
USD > 50,000 < 150,000 18,136 8,508 113%<br />
USD > 150,000 5,367 1,428 276%<br />
Agricultural Loan Portfolio 19,508 10,846 80%<br />
Housing Improvement Loan Portfolio 1,932 636 204%<br />
Other 566 284 99%<br />
Allowance for Impairment on Loans 5,493 3,853 43%<br />
Net Loan Portfolio 178,882 106,919 67%<br />
Liabilities to Customers 78,216 45,125 73%<br />
Liabilities to Banks and Financial Institutions 76,714 35,185 118%<br />
Shareholders’ Equity 18,191 8,843 106%<br />
Income Statement<br />
Operating Income 21,502 13,078 64%<br />
Operating Expenses 18,329 10,968 67%<br />
Operating Profit Before Tax 3,173 2,110 50%<br />
Net Profit 2,850 1,546 84%<br />
Key Ratios<br />
Cost/Income Ratio 74.52% 70.64% 5%<br />
ROE 21.08% 18.11% 16%<br />
Capital Ratio 13.30% 12.46% 7%<br />
Operational Statistics<br />
Number of Loans Outstanding 57,581 39,350 46%<br />
Number of Loans Disbursed within the Year 54,990 40,808 35%<br />
Number of Business and Agricultural Loans Outstanding 57,163 39,170 46%<br />
Number of Deposit Accounts 100,952 42,945 135%<br />
Number of Staff 813 555 46%<br />
Number of Branches and Outlets 25 18 39%<br />
* Some figures differ from those in the 2006 annual report<br />
as they have been adjusted to reflect new calculation<br />
methods.