LR Rabiner and RW Schafer, June 3
LR Rabiner and RW Schafer, June 3
LR Rabiner and RW Schafer, June 3

Create successful ePaper yourself
Turn your PDF publications into a flip-book with our unique Google optimized e-Paper software.
DRAFT: L. R. <strong>Rabiner</strong> <strong>and</strong> R. W. <strong>Schafer</strong>, <strong>June</strong> 3, 2009<br />
8.5. HOMOMORPHIC FILTERING OF NATURAL SPEECH 469<br />
log magnitude<br />
Phase (Radians)<br />
Phase (Radians)<br />
2<br />
0<br />
−2<br />
(a) Log Magnitude<br />
−4 4096−point DFT of Windowed Signal<br />
−6<br />
Estimate of Vocal Tract Spectrum<br />
0 500 1000 1500 2000 2500 3000 3500 4000<br />
5<br />
0<br />
−5<br />
−10<br />
(b) Unwrapped Phase<br />
4096−point DFT of Windowed Signal<br />
Estimate of Vocal Tract Spectrum<br />
−15<br />
0 500 1000 1500 2000 2500 3000 3500 4000<br />
2<br />
0<br />
−2<br />
(c) Principal Value Phase<br />
0 500 1000 1500 2000 2500 3000 3500 4000<br />
Frequency (Hz)<br />
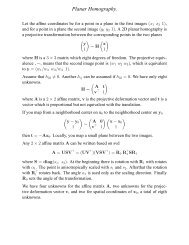
Figure 8.29: Homomorphic analysis of voiced speech; (a) Log magnitude<br />
of short-time Fourier transform, log |X(e jω )|. (Heavy line is estimate<br />
of log |HV (e jω )| obtained by lowpass liftering.) (b) Unwrapped phase<br />
arg{X(e jω )}. (Heavy line is estimate of arg{HV (e jω )} obtained by lowpass<br />
liftering.) (c) Principal value of phase of short-time Fourier transform<br />
ARG{X(e jω )}. (All functions in this figure are plotted as a function analog<br />
frequency F ; i.e., ω = 2πF T .)<br />
DFT frequency. Note that the unwrapped phase curve also displays periodic<br />
“ripples” with period equal to the fundamental frequency. Figures. 8.29a <strong>and</strong><br />
8.29b together comprise the complex logarithm of the short-time Fourier transform;<br />
i.e, they are the real <strong>and</strong> imaginary parts of the Fourier transform of<br />
the complex cepstrum, which is shown in Figure 8.30a. Figure 8.30 is virtually<br />
identical to Figure 8.27 because the DFT length (N = 4096) was large enough<br />
to make the time aliasing effects negligible <strong>and</strong> ensure accurate phase unwrapping.<br />
Notice again the peaks at both positive <strong>and</strong> negative times equal to the<br />
pitch period, <strong>and</strong> notice the rapidly decaying low-time components representing<br />
the combined effects of the vocal tract, glottal pulse <strong>and</strong> radiation. The cepstrum,<br />
which is simply the inverse transform of only the log magnitude with zero<br />
imaginary part, is shown if Figure 8.30b. Note that the cepstrum also displays<br />
the same general properties as the complex cepstrum, as it should, since the<br />
cepstrum is the even part of the complex cepstrum.