LR Rabiner and RW Schafer, June 3
LR Rabiner and RW Schafer, June 3
LR Rabiner and RW Schafer, June 3

Create successful ePaper yourself
Turn your PDF publications into a flip-book with our unique Google optimized e-Paper software.
DRAFT: L. R. <strong>Rabiner</strong> <strong>and</strong> R. W. <strong>Schafer</strong>, <strong>June</strong> 3, 2009<br />
476CHAPTER 8. THE CEPSTRUM AND HOMOMORPHIC SPEECH PROCESSING<br />
Amplitude<br />
0.05<br />
0<br />
−0.05<br />
log magnitude<br />
−2<br />
−4<br />
−6<br />
(a) Speech Segment with Hamming Window<br />
0 50 100 150 200 250 300 350 400<br />
Time (Samples)<br />
(b) Log Magnitude<br />
0<br />
−1<br />
−2<br />
0 500 1000 1500 2000 2500 3000 3500 4000<br />
frequency in Hz<br />
(c) Cepstrum<br />
1<br />
0<br />
DFT of Windowed Signal<br />
Estimate of Vocal Tract Spectrum<br />
−150 −100 −50 0<br />
Quefrency (Samples)<br />
50 100 150<br />
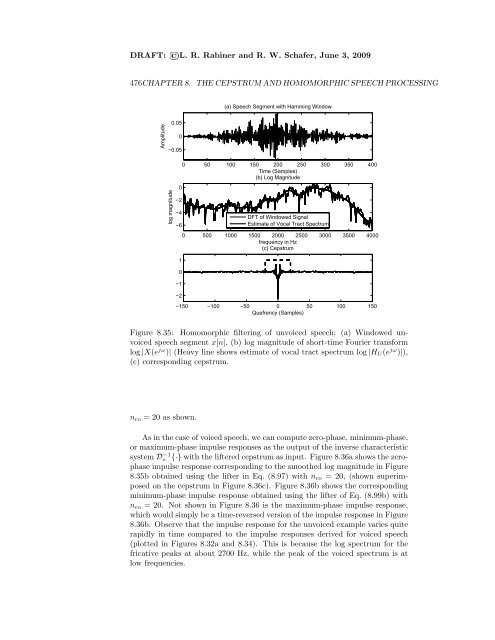
Figure 8.35: Homomorphic filtering of unvoiced speech; (a) Windowed unvoiced<br />
speech segment x[n], (b) log magnitude of short-time Fourier transform<br />
log |X(e jω )| (Heavy line shows estimate of vocal tract spectrum log |HU (e jω )|),<br />
(c) corresponding cepstrum.<br />
nco = 20 as shown.<br />
As in the case of voiced speech, we can compute zero-phase, minimum-phase,<br />
or maximum-phase impulse responses as the output of the inverse characteristic<br />
system D−1 ∗ {·} with the liftered cepstrum as input. Figure 8.36a shows the zerophase<br />
impulse response corresponding to the smoothed log magnitude in Figure<br />
8.35b obtained using the lifter in Eq. (8.97) with nco = 20, (shown superimposed<br />
on the cepstrum in Figure 8.36c). Figure 8.36b shows the corresponding<br />
minimum-phase impulse response obtained using the lifter of Eq. (8.99b) with<br />
nco = 20. Not shown in Figure 8.36 is the maximum-phase impulse response,<br />
which would simply be a time-reversed version of the impulse response in Figure<br />
8.36b. Observe that the impulse response for the unvoiced example varies quite<br />
rapidly in time compared to the impulse responses derived for voiced speech<br />
(plotted in Figures 8.32a <strong>and</strong> 8.34). This is because the log spectrum for the<br />
fricative peaks at about 2700 Hz, while the peak of the voiced spectrum is at<br />
low frequencies.