

SKF Reliability Systems - Library
SKF Reliability Systems - Library
SKF Reliability Systems - Library

You also want an ePaper? Increase the reach of your titles
YUMPU automatically turns print PDFs into web optimized ePapers that Google loves.
An API In Benchmarking Assets<br />
Table 1b API metrics, definitions and weightings (continued)<br />
<strong>Reliability</strong><br />
Availability<br />
1 Maintenance Cost as Percentage<br />
of Asset Replacement Value<br />
2 PM Work Hours as Percentage of<br />
Total Work Hours<br />
3 Percentage of All Equipment<br />
Documented in Master Equipment<br />
List (MEL)<br />
4 Percentage of All Equipment<br />
Assigned with a Criticality Rating<br />
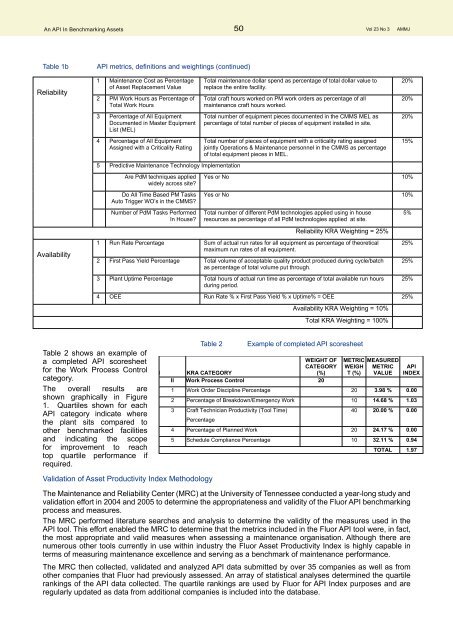
Table 2 shows an example of<br />
a completed API scoresheet<br />
for the Work Process Control<br />
category.<br />
The overall results are<br />
shown graphically in Figure<br />
1. Quartiles shown for each<br />
API category indicate where<br />
the plant sits compared to<br />
other benchmarked facilities<br />
and indicating the scope<br />
for improvement to reach<br />
top quartile performance if<br />
required.<br />
5 Predictive Maintenance Technology Implementation<br />
Are PdM techniques applied<br />
widely across site?<br />
Do All Time Based PM Tasks<br />
Auto Trigger WO’s in the CMMS?<br />
Number of PdM Tasks Performed<br />
In House?<br />
Validation of Asset Productivity Index Methodology<br />
50 Vol 23 No 3 AMMJ<br />
Total maintenance dollar spend as percentage of total dollar value to<br />
replace the entire facility.<br />
Total craft hours worked on PM work orders as percentage of all<br />
maintenance craft hours worked.<br />
Total number of equipment pieces documented in the CMMS MEL as<br />
percentage of total number of pieces of equipment installed in site.<br />
Total number of pieces of equipment with a criticality rating assigned<br />
jointly Operations & Maintenance personnel in the CMMS as percentage<br />
of total equipment pieces in MEL.<br />
The Maintenance and <strong>Reliability</strong> Center (MRC) at the University of Tennessee conducted a year-long study and<br />
validation effort in 2004 and 2005 to determine the appropriateness and validity of the Fluor API benchmarking<br />
process and measures.<br />
The MRC performed literature searches and analysis to determine the validity of the measures used in the<br />
API tool. This effort enabled the MRC to determine that the metrics included in the Fluor API tool were, in fact,<br />
the most appropriate and valid measures when assessing a maintenance organisation. Although there are<br />
numerous other tools currently in use within industry the Fluor Asset Productivity Index is highly capable in<br />
terms of measuring maintenance excellence and serving as a benchmark of maintenance performance.<br />
The MRC then collected, validated and analyzed API data submitted by over 35 companies as well as from<br />
other companies that Fluor had previously assessed. An array of statistical analyses determined the quartile<br />
rankings of the API data collected. The quartile rankings are used by Fluor for API Index purposes and are<br />
regularly updated as data from additional companies is included into the database.<br />
20%<br />
20%<br />
20%<br />
15%<br />
Yes or No 10%<br />
Yes or No 10%<br />
Total number of different PdM technologies applied using in house<br />
resources as percentage of all PdM technologies applied at site.<br />
<strong>Reliability</strong> KRA Weighting = 25%<br />
1 Run Rate Percentage Sum of actual run rates for all equipment as percentage of theoretical<br />
maximum run rates of all equipment.<br />
2 First Pass Yield Percentage Total volume of acceptable quality product produced during cycle/batch<br />
as percentage of total volume put through.<br />
3 Plant Uptime Percentage Total hours of actual run time as percentage of total available run hours<br />
during period.<br />
4 OEE Run Rate % x First Pass Yield % x Uptime% = OEE 25%<br />
Availability KRA Weighting = 10%<br />
Total KRA Weighting = 100%<br />
Table 2 Example of completed API scoresheet<br />
N KRA CATEGORY<br />
WEIGHT OF<br />
CATEGORY<br />
(%)<br />
II Work Process Control 20<br />
METRIC<br />
WEIGH<br />
T (%)<br />
MEASURED<br />
METRIC<br />
VALUE<br />
5%<br />
25%<br />
25%<br />
25%<br />
API<br />
INDEX<br />
1 Work Order Discipline Percentage 20 3.98 % 0.00<br />
2 Percentage of Breakdown/Emergency Work 10 14.68 % 1.03<br />
3 Craft Technician Productivity (Tool Time)<br />
Percentage<br />
40 20.00 % 0.00<br />
4 Percentage of Planned Work 20 24.17 % 0.00<br />
5 Schedule Compliance Percentage 10 32.11 % 0.94<br />
TOTAL 1.97


