NATURAL RESOURCES OF SRI LANKA
NATURAL RESOURCES OF SRI LANKA
NATURAL RESOURCES OF SRI LANKA

Create successful ePaper yourself
Turn your PDF publications into a flip-book with our unique Google optimized e-Paper software.
1<br />
I<br />
I<br />
Hi-<br />
I<br />
I<br />
.1<br />
Ii<br />
I<br />
Ii<br />
i<br />
I<br />
l<br />
I<br />
Il<br />
Scanned from original by I<strong>SRI</strong>C - World Soil Information, as ICSU<br />
World Data Centre for Soils. The purpose is to make a safe<br />
depository for endangered documents and to make the accrued<br />
information available for consultation, following Fair Use<br />
Guidelines. Every effort is taken to respect Copyright of the<br />
materials within the archives where the identification of the<br />
Copyright holder is clear and, where feasible, to contact the<br />
originators. For questions please contact soil.isric(S)wur.nl<br />
indicating the item reference number concerned.<br />
<strong>NATURAL</strong> <strong>RESOURCES</strong> <strong>OF</strong><br />
<strong>SRI</strong> <strong>LANKA</strong><br />
Conditions and Trends<br />
A REPORT PREPARED FOR THE <strong>NATURAL</strong> <strong>RESOURCES</strong>, ENERGY AND SCIENCE AUTHORITY <strong>OF</strong> <strong>SRI</strong> <strong>LANKA</strong>. 1991
I<br />
I<br />
i<br />
i<br />
i<br />
i<br />
i<br />
i<br />
1<br />
i<br />
i<br />
i<br />
i<br />
i<br />
i<br />
i<br />
i<br />
i<br />
i<br />
i<br />
I<br />
Editorial Committee<br />
Prof. B A. Abeywickrama<br />
Mr. Malcolm F. Baldwin<br />
Mr. Malcolm A.B. Jansen<br />
Prof. CM. Madduma Bandara<br />
Mr. L.C.A. deS. Wijesinghe<br />
Major Contributors<br />
Prof. B A. Abeywickrama<br />
Dr. B.K. Basnayake<br />
Ms. N.D. de Zoysa<br />
Mr. S. Dimantha<br />
Prof. C.B. Dissanayake<br />
Prof. H.P.M. Gunasena<br />
Mr. Malcolm A.B. Jansen<br />
Mr. R.B.M. Korale<br />
Prof. CM. Madduma Bandara<br />
Mr. ICA.L. Premaralne<br />
Ms D.H. Sadacharan<br />
Dr. L.R. Sally<br />
Dr. M.UA Tennekoon<br />
Mr. M. Watson<br />
Dr. S. Wickramaratne<br />
Mr. L.CA. de S. Wijesinghe<br />
Other Contributors<br />
Editor<br />
Copy Editor<br />
Word-<br />
Processing<br />
Cartography<br />
Photography<br />
Publisher<br />
Printed By<br />
Cover<br />
Design<br />
Prof.P. Abeygunawardene<br />
Dr. A.T.P.L. Abeykoon<br />
Prof. P. Ashton<br />
Mr. G.B.A. Fernando<br />
Mr. P. lllangovan<br />
Dr. R.C. Kumarasuriya<br />
Mr. V. Nandakumar<br />
Dr.R.H. Wickramasinghe<br />
Dr. KristinWulfsberg<br />
Mr. Malcolm F. Baldwin<br />
Ms Pamela Fabian<br />
Ms Pushpa Iranganie<br />
Ms Beryl Melder<br />
Mr. Milton Liyanage<br />
Studio Times, Ltd.<br />
Mr. Dharmin Samarajeewa<br />
Mr. Dominic Sansoni<br />
Keells Business Systems Ltd<br />
Education Center<br />
Uni Walker Packaging Ltd.<br />
Colombo<br />
Masters Advertising Ltd.
Sponsored by the United States Agency for International Development * ^^<br />
<strong>NATURAL</strong> <strong>RESOURCES</strong> <strong>OF</strong><br />
<strong>SRI</strong> <strong>LANKA</strong><br />
Conditions and Trends<br />
A REPORT PREPARED FOR THE <strong>NATURAL</strong> <strong>RESOURCES</strong>, ENERGY AND SCIENCE AUTHORITY <strong>OF</strong> <strong>SRI</strong> <strong>LANKA</strong>. 1991<br />
I<br />
I
I<br />
I<br />
I<br />
I<br />
I<br />
I<br />
I<br />
I<br />
I<br />
Ii ;<br />
i !<br />
I<br />
I<br />
I<br />
I<br />
I<br />
I<br />
I<br />
I<br />
I<br />
I<br />
Acknowledgements<br />
This report was prepared under the auspices of the<br />
Natural Resources, Energy, and Science Authority of<br />
Sri Lanka, Ministry of Industries, Science and Technology.<br />
Special thanks from the Editorial Committee are<br />
due to Dr. R. P. Jayewardene, Director-General of<br />
NARESA and members of NARESA's Natural<br />
Resources Working Committee for project encouragement<br />
and guidance. Support for this project was<br />
provided by the United States Agency for International<br />
Development The Committee is grateful to Mr. Dennis<br />
Zvinakis, USAID Projects Director, during whose<br />
tenure this report was conceived and developed, and<br />
his successor Mr. William Jeffers.<br />
Many experts provided invaluable technical assistance<br />
in drafting this report. Refinement of papers was<br />
assisted by Mr. Godfrey Gunatilleke, Prof. K.K.Y.W.<br />
Perera, Dr. Gamani Corea, Mr. Lalanath de Silva,<br />
Mr.V.R. Nanayakkara, Mr. M.S. Wijeratne, and Mr.<br />
B.P. Sepalage, at the workshop held by NARESA to<br />
review preliminary project findings. Thanks are due for<br />
the critical technical review of documents by Ms<br />
Dianne Tsitsos, Dr. Ulrich Ernst, Dr. Glenn Anders,<br />
and Mr. Daniel Jenkins of USAID, and for the technical<br />
design contributions of Mr. Daniel Tunstall of the<br />
World Resources Institute. The Editorial Committee<br />
is grateful to Keells Business Systems for the careful<br />
work of its staff in preparing the computer graphics,<br />
and to Ms Neela D. de Zoysa for her help with the<br />
report's design and selection of photographs.<br />
Finally, appreciation must be given to the countless<br />
Sri Lankan scientists and concerned citizens whose<br />
actions have shaped the content of this report and<br />
whose informed energies will be so important to the<br />
future environment of Sri Lanka.<br />
ill
« .<br />
I<br />
I<br />
I<br />
Contents I<br />
I<br />
Research Team II I<br />
Acknowledgements<br />
Contents<br />
list of Boxes<br />
III<br />
IV<br />
XI I<br />
I<br />
Introduction 1<br />
<strong>NATURAL</strong> <strong>RESOURCES</strong> AND THE HUMAN ENVIRONMENT <strong>OF</strong> <strong>SRI</strong> <strong>LANKA</strong> 2<br />
Geographical Setting 2<br />
Physical Features 2 tm<br />
Geology 3 J,<br />
Climate 3<br />
Hydrology 4 am<br />
People 5 |<br />
The Economy 6<br />
Constitutional and Administrative Structure 7 M<br />
Legal Structure Affecting Natural Resource Management 7 g<br />
Key Issues in Natural Resource Management 8<br />
Heritage in Natural Resource Management 11^<br />
Hydraulic Civilization 11 fl<br />
Collapse of the Rajarata Civilization 16 m<br />
The Kandyan Kingdom 16<br />
The Colonial Period 16 •<br />
Population Profile __ 21^ •<br />
POPULATION GROWTH 21 •<br />
Changes in Fertility 21<br />
Mortality 22 I<br />
International Migration 24<br />
Projected Population 24 _<br />
POPULATION DISTRIBUTION 25 |<br />
Population Density 25<br />
Urban-Rural Distribution 28 M<br />
Trends- 28 I<br />
FAMILY SIZE AND HOUSEHOLD COMPOSITION 30<br />
I<br />
I
1<br />
1<br />
1<br />
1<br />
1<br />
1<br />
1<br />
1<br />
1<br />
1<br />
1<br />
1<br />
1<br />
1<br />
1<br />
1<br />
1<br />
1<br />
1<br />
1<br />
1<br />
4<br />
5<br />
Growth of Households and Family Formations<br />
Size of Households<br />
Forecast of Households<br />
HOUSING<br />
Growth of Housing Stock<br />
Quality of Housing Units<br />
Materials of Construction<br />
Age of Housing Stock<br />
Occupancy and Overcrowding<br />
Type of Lighting<br />
Main Sources of Drinking Water<br />
Toilet Facilities<br />
POPULATION AND DOMESTIC FOOD PRODUCTION<br />
LABOR SUPPLY<br />
Population of Working Age<br />
Employment by Industry Sector<br />
Occupational Distribution<br />
Employment Growth Required to Match Labor Supply<br />
Economic Conditions and Trends<br />
HISTORICAL BACKGROUND<br />
RESOURCE AVAILABILITY AND PERFORMANCE IN THE ECONOMY<br />
Gross Domestic Product<br />
Sectoral Contribution: Agriculture<br />
Industry<br />
Services and Construction<br />
Imports<br />
RESOURCE UTILIZATION<br />
Trends in Consumption and Investment<br />
Exports<br />
MICRO-ECONOMIC UMITATIONS AND PRESSURES<br />
Unemployment<br />
Income Distribution and Poverty<br />
Malnutrition<br />
POUCY IMPACT<br />
Environmental Degradation and Economic Development<br />
Energy Resources<br />
ELECTRICITY DEMAND<br />
ROLE <strong>OF</strong> HYDROPOWER<br />
Thermal Generation Options<br />
Economic and Social Costs of Hydropower<br />
PETROLEUM SUPPLY AND DEMAND<br />
•<br />
30<br />
30<br />
32<br />
32<br />
32<br />
32<br />
32<br />
32<br />
35<br />
35<br />
35<br />
35<br />
40<br />
44<br />
44<br />
45<br />
45<br />
45<br />
53<br />
53<br />
55<br />
55<br />
55<br />
58<br />
60<br />
60<br />
60<br />
60<br />
62<br />
64<br />
64<br />
66<br />
66<br />
67<br />
67<br />
71<br />
71<br />
74<br />
75<br />
76<br />
77<br />
V
VI<br />
Supply and Processing 77<br />
Sources of Demand 77<br />
BIOMASSFUEL 81 •<br />
Consumption 81 •<br />
Future Demand Trends 81<br />
Source of Biomass Fuel 83 M<br />
Future Trends in Supplies 83 •<br />
Economic and Social Costs of Fuelwood 85<br />
Other Biofuel Resources 85 M<br />
MAIN ISSUES AND INSTITUTIONAL RESPONSES 87 •<br />
Electricity 87<br />
Conservation 87 •<br />
Biomas Fuel 88<br />
Land" Resources 97<br />
PARTI-LAND <strong>RESOURCES</strong> AND USE 1956 TO PRESENT 99 I<br />
PRESENT USE 100 P<br />
Plantation Agriculture — Focus on Tea 100<br />
Cultivation — Focus on Paddy . 107 I<br />
Grasslands 108<br />
Forest Gardens 108<br />
ALLOCATION FOR SUITABILITY AND SUSTAINABIUTY 108<br />
Soils of Sri Lanka 108<br />
Suitability analysis 108<br />
Lands use Allocation Problems and needs 111<br />
POUCIES AND INSTITUTIONAL RESPONSES 111<br />
Land Ownership 111<br />
Major Land Tenure Laws 112<br />
Government Responsibilities 115<br />
Findings of the Land Commission 116<br />
PART II - LAND DEGRADATION 119<br />
Soil Erosion 119<br />
Landslides and Related Phenomena 123<br />
Coastal Erosion 127<br />
Salinity and Waterlogging 128<br />
EVALUATING IMPACTS AND PRIORITIES 129 •<br />
INSTITUTIONAL RESPONSES 131 •<br />
Allocation of Authority 131<br />
Long-term Planning 131 •<br />
Providing Resources 132 *<br />
Inter-agency Coordination 132<br />
I<br />
I<br />
I<br />
I<br />
I<br />
I<br />
I<br />
I<br />
I<br />
I<br />
I
I<br />
I<br />
I<br />
ç —\<br />
I<br />
I<br />
I<br />
I<br />
I<br />
I I :<br />
i ;<br />
I<br />
I<br />
I !I<br />
I<br />
I<br />
I<br />
I<br />
I<br />
I<br />
Water Resources 137<br />
PART I - WATER <strong>RESOURCES</strong> AND USE 137<br />
GEOGRAPHICAL AND GEOLOGICAL BACKGROUND 137<br />
PRECIPITATION AND WATER AVAILABILITY 141<br />
Average Rainfall 141<br />
Wet and Dry Zones 141<br />
Evapo-transpiration 142<br />
Inter-annual Variability 142<br />
Extremes: Floods and Droughts 142<br />
Rainfall Probability 142<br />
Surface Water 142<br />
Ground Water 146<br />
WATER USES AND REQUIREMENTS 146<br />
WATER <strong>RESOURCES</strong> CONDITIONS AND TRENDS 148<br />
Local Rainfall Decreases 148<br />
Increased Runoff - 148<br />
Ground Water Exploitation 150<br />
DEVELOPMENT POUCIES AND INSTITUTIONAL RESPONSES 150<br />
Institutional Authority • 151<br />
Water Resources Legislation 151<br />
PART II-WATER POLLUTION 157<br />
SOURCES <strong>OF</strong> POLLUTION 157<br />
Urban Wastes 157<br />
Industrial Waste 160<br />
Rural Sanitation 163<br />
Agricultural Wastes 163<br />
Natural Factors 164<br />
Oil Discharges 164<br />
TRENDS IN WATER QUALITY 165<br />
KelaniGanga 166<br />
Mahaweli Ganga 166<br />
Other Rivers» Waterways and Water Bodies 167<br />
Ground Water 169<br />
Estuaries and Lagoons 170<br />
Other Forms of Water Degradation 171<br />
IMPACTS 171<br />
LEGAL AND INSTITUTIONAL RESPONSE 171<br />
KEY ISSUES 174<br />
Domestic Waste Management ' 174<br />
Industrial Waste Management 176<br />
Agricultural Waste Management 176<br />
Ground Water Management 176<br />
Research- and Data Generation 176<br />
Surface Water Quality Monitoring and Control 177<br />
Waste Reduction Technologies; 178<br />
VII
VIII<br />
8 Mineral Resources 181<br />
GEMSTONES<br />
Gem Mining<br />
The Gem Industry X84 I<br />
Emerging Market Trends Ig4 •<br />
Geudato Sapphire - The Addition of Value<br />
Environmental Impacts 186 S<br />
Regulation and Controls 188 •><br />
SAND MINING 190<br />
Environmental Impacts 190 •<br />
GRAPHITE 190 •<br />
ROCK PHOSPHATE 191<br />
CERAMICS 192 I<br />
MINERAL SANDS 193<br />
Environmental Impacts 193 «<br />
CEMENT 194 |<br />
Environmental Impacts 193<br />
FUTURE MINERAL PROSPECTS 194 m<br />
Forest Resources 197<br />
Forest Cover Today 197<br />
<strong>NATURAL</strong> FORESTS 198 m<br />
Forest Ownership 201 f§<br />
Timber Yields from Natural Forests 204<br />
FOREST PLANTATIONS 208 •<br />
Historical Development 208 m<br />
Timber and Fuelwood Production<br />
Ecological Considerations<br />
TIMBER AND FUELWOOD DEMAND AND SUPPLY<br />
208<br />
209<br />
209 I<br />
Industrial Wood - Past Trends 209<br />
Industrial Wood - Future Trends 209 •<br />
Fuelwood - Past Trends 210 •<br />
Fuelwood - Future Trends 211<br />
KEY ISSUES 211 •<br />
Minimum Area Under Forest 211 *<br />
Timber and Fuelwood Supplies 212<br />
Forest Plantations 213 I<br />
Social Forestry 213<br />
Research 213<br />
I<br />
I<br />
I<br />
I<br />
I<br />
I<br />
I
I<br />
I<br />
I<br />
I<br />
I<br />
I<br />
I<br />
I<br />
I<br />
I<br />
I<br />
I<br />
I<br />
I<br />
I<br />
I<br />
I<br />
I<br />
I<br />
I<br />
I<br />
10 Biological Diversity 215<br />
Importance of Biological Diversity 216<br />
<strong>SRI</strong> <strong>LANKA</strong>'S BIODIVERSITY 216<br />
Wild Resources 216<br />
Cultivated Resources 222<br />
STATUS AND TRENDS 226<br />
Loss of Ecosystem Diversity 226<br />
. Loss of Genetic Diversity 227<br />
TRENDS <strong>OF</strong> PROTECTED AREA MANAGEMENT 229<br />
INSTITUTIONAL CONSTRAINTS AND NEEDS 232<br />
Knowledge Base and Analytical Capability 232<br />
Providing Economic Incentives 233<br />
Expanding Awareness : 233<br />
Promotion of Cross-sectoral Collaboration 233<br />
Strengthening Protected area Management 234<br />
Policy Shifts 234<br />
Incorporating values into Economic Planning 234<br />
11 Coastal And Marine Resources 237<br />
ECONOMIC AND SOCIAL SIGNIFICANCE 238<br />
PRESENT CONDITIONS 239<br />
Marine Fishery Resources 242<br />
Large Pelagics 246<br />
Small Pelagics 245<br />
Crustaceans . 246<br />
Coral Reefs 248<br />
Coastal Wetlands 249<br />
Beaches and Dunes 252<br />
MINERAL <strong>RESOURCES</strong> IN THE COASTAL ZONE 252<br />
INSTITUTIONAL RESPONSES AND NEEDS 254<br />
12 Inland Aquatic Resources 257<br />
AQUATIC HABITATS <strong>OF</strong> <strong>SRI</strong> <strong>LANKA</strong> 257<br />
River and Streams (Riverine) 257<br />
Werlands (Palustrine System) 259<br />
Floodplains Associated with Rivers 259<br />
Floodplains Isolated from River 260<br />
Wet Montane Grasslands 260<br />
Swamp Forests 260<br />
Village Tanks and Ponds . 261<br />
Rice Paddies 261<br />
Deepwater Habitats 261<br />
IX
FUNCTION AND VALUES 261 |<br />
Flood Storage and Conveyance<br />
Fishery Production<br />
Wildlife Habitat<br />
261<br />
262<br />
264 I<br />
Livestock and Grazing 264<br />
Water Supply 264 •<br />
IMPACTS AND TRENDS 264 •<br />
Impoundments and Diversions 265<br />
Sedimentation 265 M<br />
Conversion to Alternate Uses 265 <br />
Pollution 267<br />
INSTITUTIONAL CONSTRAINTS AND RECOMMENDED RESPONSES 267 •<br />
Establish Responsibility for Management and Research 267<br />
Set Priorities for Improved Legal Enforcement 268<br />
Establish Incentives for Conservation 268 •<br />
Incorporate Benefits into Projects and Markets 268<br />
Establish Public Dialogue Over Cultural Barriers 268 _<br />
Identify and Redress Key Information Gaps 268 I<br />
13 Toward Sustainable Development 271 I<br />
Trend is Not Destiny 271<br />
Sustainable Development Initiatives 271 I<br />
CAUSES <strong>OF</strong> <strong>NATURAL</strong> <strong>RESOURCES</strong> USE AND MISUSE 271 *<br />
Significant Global Forces on the Environment 271<br />
Poverty Cycle 271 I<br />
Domestic Economic Policies 272<br />
Population Growth and Demographic Shifts 272 _<br />
CONSTRAINTS ON SUSTAINABLE DEVELOPMENT 272 J<br />
Land Degradation 272<br />
Watershed Degradation 273 am<br />
Biological Resource Degradation 273 g<br />
Contamination of Ground and Surface water 274<br />
Degradation of the urban environment 275 m<br />
POLICY RESPONSES 275 |<br />
Integrating Biological Resources into Development and Planning 275<br />
Correcting Institutional Constraints 276<br />
Efficient Environmental Management Cooperation 277<br />
Private Responsibilities and Incentives 277<br />
Improving Information Gathering, Analysis, and Use 278 •<br />
Integrating Environmental Impacts 279 m<br />
VISION <strong>OF</strong> THE FUTURE 279<br />
I<br />
I<br />
I<br />
I<br />
I<br />
I<br />
I
I<br />
I<br />
I<br />
' List of Boxes<br />
I<br />
I<br />
I<br />
Rapid Urbanization in Sri Lanka: Implications and Challenges 42<br />
• Price of Pollution 57<br />
i Energy Efficiency-- Sri Lanka's Cheapest Energy Resource 84<br />
• Air Pollution 89<br />
i Sources and Effects of Air Pollution 91<br />
JÊ Whither Chena 101<br />
[ } Forest Gardens 113<br />
W Chena Cultivation With a Difference 130<br />
! Profile of Water Pollution 158<br />
• Beira Lake Pollution - Causes and Remedies 165<br />
! Ground Water Pollution in Jaffna 173<br />
Forest Plantation for Shelter 207<br />
The Forestry Development Program 210<br />
Sinharaja 230<br />
: Significance of the Coastal Region 238<br />
f Coral Mining 247<br />
' Muthurajawela Marshes - Negombo Lagoon: Preparing a Master Plan 266<br />
I<br />
1<br />
I<br />
I<br />
I<br />
XI
I<br />
I<br />
I<br />
I I<br />
I<br />
I<br />
I<br />
I<br />
I<br />
I<br />
I<br />
I<br />
I<br />
I<br />
II ,<br />
1 i<br />
I<br />
I<br />
I I<br />
1 INTRODUCTION<br />
Can Sri Lanka achieve a future of environmentally<br />
sustainable development? What, in fact, constitutes<br />
"sustainable" development, and what are the environmental<br />
conditions essential to achieve it? Should present<br />
policies and programs change? Answers depend<br />
on how well we understand the conditions of Sri<br />
Lanka's natural resources and the dynamic changes<br />
that affect them.<br />
This profile describes these conditions and trends<br />
at a critical time. A tropical island in the Indian Ocean,<br />
smaller than Scotland or Tasmania and half the size of<br />
the State of New York, Sri Lanka nonetheless possesses<br />
infinite variety, rich scenic beauty, unusual water, mineral,<br />
and biotic resources, and an ancient cultural heritage.<br />
These attributes exist today with a population of<br />
some 17 million people, which places Sri Lanka second<br />
after Bangladesh in population density among developing<br />
countries.<br />
Unmistakable signs of environmental stress in Sri<br />
Lanka are now cause for serious concern. They include<br />
loss of natural forest cover, contamination of waters,<br />
degradation of rural lands, and rising levels of air,<br />
water, and solid waste pollution. A projected population<br />
of 25 million by 2040 will create unprecedented<br />
demands for food, fiber, energy, developable land and<br />
other natural resources. Without prompt management<br />
actions, these demands will aggravate the negative<br />
trends.<br />
Sri Lanka might respond by enhancing the social<br />
benefits that can be sustained from natural systems of<br />
land, water, wetlands, and their biological resources. It<br />
can increase its wealth by avoiding costly environmental<br />
abuse. Significant new laws and programs have begun<br />
to shift in this direction. Actual results will depend in<br />
part on how well planners, decision makers, and citizens<br />
apply what they know about Sri Lanka's natural<br />
resources.<br />
This profile will provide concerned citizens in and<br />
out of government with the best available information<br />
on significant natural resource conditions and trends in<br />
Sri Lanka; It builds on findings of the National Conservation<br />
Strategy and fills gaps in other recent studies on<br />
the environmental and economic dimensions of development.<br />
It should help government and private sector<br />
institutions identify and rank national priorities for<br />
action when they face a dauntingly vast number of<br />
environmental problems, demands, and choices.<br />
For practical reasons.this conditions and trends<br />
assessment is considered in discrete pieces, but true<br />
perspective and sound policy also require understanding<br />
of complex interactions among ecological, and social<br />
systems over time and space. This introduction<br />
follows with an overview of Sri Lanka's setting and the<br />
relationships of her resources to her people. The subsequent<br />
chapters, with their tables and graphics, describe<br />
important conditions and trends in detail.<br />
Chapter 2 describes the ancient heritage of Sri Lanka<br />
— a history of irrigated agriculture and forest use that<br />
strongly affects Sri Lankans' present political, social,<br />
and environmental perspectives. Three subsequent<br />
chapters describe the dynamic factors of population,<br />
economics, and energy use that most strongly affect<br />
natural resources. Subsequent chapters then focus on<br />
natural resource conditions and trends affecting physical<br />
and biological resources, and the environmental<br />
pollutants that threaten productive and sustainable<br />
resource use. Each chapter addresses institutional responses<br />
and experiences. The concluding chapter describes<br />
the environmental stresses likely to affect Sri<br />
Lanka in the future and the opportunities and paths for<br />
achieving sustainable development.<br />
To supplement these chapters, topical "boxes" interspersed<br />
throughout the profile give readers a more<br />
integrated perspective on many significant conditions<br />
and trends discussed in the chapters.
This profile is only a beginning. The contributions<br />
of more than a score of Sri Lanka's best scientists and<br />
experts to this profile indicate deficiencies in information<br />
and analysis that need prompt attention. Wise<br />
economic, social, and environmental decisions will require<br />
long-term efforts to refine and enlarge Sri<br />
Lanka's body of practical environmental information<br />
and analysis. Fortunately Sri Lanka's growing community<br />
of environmentally concerned citizens and professionals<br />
.have the capacity to fill these gaps.<br />
<strong>NATURAL</strong> <strong>RESOURCES</strong> AND<br />
THE HUMAN ENVIRONMENT<br />
<strong>OF</strong> <strong>SRI</strong> <strong>LANKA</strong><br />
Geographical Setting<br />
Sri Lanka's location, astride the sea routes between<br />
the east and'the west, exposed it to wide cultural and<br />
political influence throughout its history. The island<br />
was well known to travellers of many nationalities from<br />
ancient'times and its reputation for precious stones,<br />
spices, elephants and scenic beauty is documented in<br />
the tales of Greeks, Romans, Arabs and Chinese. Historically<br />
Sri Lanka's dose proximity to the sub-continent<br />
brought it under the cultural, religious, linguistic<br />
and political influence of India.<br />
From the middle of the first millennium B.C. to well -<br />
after the first millennium A.D. Sri Lanka sustained an<br />
advanced hydraulic civilization centered around village<br />
tanks and irrigation schemes, described in Chapter 2.<br />
The island was dominated by successive European sea<br />
powers beginning with Portugal from the early sixteenth<br />
century to the mid-seventeenth, followed by the<br />
Netherlands until the end of the eighteenth century,<br />
and finally Britain until Independence. The last Sinhalese<br />
king reigned until 1815, and Sri Lanka was not<br />
independent again until 1948.<br />
Physical Features<br />
Sri Lanka's development has been largely determined<br />
by the natural and economic attributes of its<br />
physical features. Based on elevation and nature of the<br />
terrain five geomorphic regions can be identified: the<br />
coastal fringe, the central highlands,, the southwest<br />
Introduction<br />
country, the east and southeast, and the north central<br />
lowlands.<br />
The chapter on coastal resources describes a<br />
coastal fringe consisting of estuaries, peninsulas,<br />
beaches, and offshore islands that support 90 percent<br />
of the fisheries, most of the tourism and industry, agriculture,<br />
and human settlements. The length of the<br />
coastline open to the sea, including that of the bays and<br />
the shores of the offshore islands, is. about 1,600 kilometers.<br />
Koddiyar Bay (Trincomalee) is one of the<br />
finest natural harbors in the world, but Colombo itself<br />
has become an important commercial port. The continental<br />
shelf skirting the bland forms a narrow ledge of<br />
approximately 20 kilometers along the western, southern<br />
and eastern coasts, while to the northwest it is<br />
continuous with that of peninsular India.<br />
The central massif from which headwaters of all Sri<br />
Lanka's major rivers originate, as described in the<br />
chapter on water resources, is a compact physiographic<br />
unit bounded on the south by a high mountain wall with<br />
precipices offering magnificent views toward the sea<br />
from World's End. Sri Lanka's highest point is over<br />
2^24 meters at Piduruthalagala Peak. The Horton<br />
Plains, now an important national park, is the best<br />
known of several high-plain surfaces in the island.<br />
Until the coming of nineteenth century plantation agriculture,<br />
natural forests and grasslands covered this<br />
region. Today these areas are covered largely by rubber,<br />
eucalyptus, or pine; natural forests are small and<br />
scattered. Evidence of upland soil erosion and overuse<br />
of pesticides and fertilizers creates potentially serious<br />
but still poorly understood problems for downstream<br />
land and water use, including water for drinking, irrigation,<br />
and hydroelectric generation. Major-aspects of<br />
these conditions and trends are described in chapters<br />
on land, water, forestry, and inland aquatic resources.<br />
Topography of the southwest - the other part of<br />
Sri Lanka's Wet Zone - is characterized by long parallel<br />
ridges cut by the rivers beginning in the hill country.<br />
This is the most densely populated region. The Forest<br />
Resources chapter describes its rapid deforestation;<br />
natural forests now cover only 8 percent of the wet,<br />
intermediate and montane zones. The 47,370-hectare<br />
group of Sinharaja forests is the last remnant of the<br />
once-vast southwestern rain forests. The chapter on<br />
I<br />
I<br />
I<br />
I<br />
I<br />
I<br />
I<br />
I<br />
I<br />
I<br />
I<br />
I<br />
I<br />
I<br />
I<br />
I<br />
I<br />
I<br />
I<br />
I<br />
I
I<br />
I<br />
I<br />
I<br />
1<br />
I<br />
I<br />
I<br />
I<br />
I<br />
I<br />
I<br />
I<br />
I<br />
I<br />
I<br />
I<br />
I<br />
I<br />
biological diversity describes the rich flora and fauna of<br />
this region.<br />
Rolling hills, undulating plains, and isolated residual<br />
hills characterize Sri Lanka's eastern and southeastern<br />
lowlands. The coastal fringe has important<br />
fisheries and the region contains large parks and wildlife<br />
refuges that are home for wild elephants. Together<br />
with the north central lowlands it contains an estimated<br />
25 million hectares of land that are considered capable<br />
of development for forestry, agriculture or human settlement.<br />
The north central lowlands are somewhat similar<br />
to those in the east, with massive residual rocks such as<br />
Sigiriya, adorned by its monuments of fifth century<br />
civilization. Here Sri Lanka's hydraulic civilization<br />
flourished, and continues to be a center of archaeological<br />
and tourist interest. The Mahaweli Ganga, which<br />
drains about 16 percent of the island, has its floodplain<br />
in this region, one of Sri Lanka's most important wildlife<br />
and agricultural attributes.<br />
Sri Lanka is endowed with lands that can be highly,<br />
productive so long as they have adequate water. Over<br />
two-thirds of the land area is flat or undulating with<br />
gentle slopes; extremely steep lands with slopes over 60<br />
degrees gradient comprise only 1 percent of the land.<br />
About one-third of Sri Lanka is put to agricultural use.<br />
Forests and wildlife use another third, and the rest is<br />
under transportation, human settlements, and a variety<br />
of other uses.<br />
Most gently sloping lands are within the agriculturally<br />
rich areas of the Dry Zone, but agriculture is also<br />
important in the central hill country where slopes range<br />
from 30-60 percent. Plantation agriculture has flourished<br />
there since the beginning of the British colonial<br />
era. Sections of the Land Resources chapter focus<br />
particularly on rice paddy and tea plantation agriculture<br />
in these two regions; the Economics chapter describes<br />
their importance to the nation's economy.<br />
Impacts of Sri Lanka's oldest form of agriculture —<br />
shifting (chena) cultivation — are also significant, however.<br />
About 18 percent of the island, including lands<br />
on steep slopes, is devoted to chena cultivation, which,<br />
as now practised, contributes to significant soil erosion<br />
and most of the apparently increasing symptoms of land<br />
Introduction<br />
degradation. Chena problems and prospects are described<br />
in the chapter on land and in several topical<br />
boxes.<br />
Geology<br />
Beneath Sri Lanka's landscape lie some important<br />
minerals, most notably its world-famous gems, and<br />
other minerals as yet only modestly exploited. No oil<br />
or coal can be found under the land mass, although<br />
petroleum may exist offshore.<br />
Sri Lanka, like the Indian peninsula and Antarctica,<br />
formed part of Gondwanaland in the distant geological<br />
past, and it was never fully submerged by the sea.<br />
The only major marine transgression was in Tertiary<br />
times when Miocene sediments were laid down in the<br />
northwestern belt of the island, including the Jaffna<br />
Peninsula. As a result, nearly 90 percent of the area of<br />
the island is not covered by any sedimentary rocks.<br />
Precambrian rocks consist-predominantly of a sedimentary<br />
succession of a variety of metamorphosed sedimentary<br />
rocks that are conventionally divided into two<br />
groups on the basis of their lithology and structure —<br />
the Highland Series and the Vijayan Series. Miocene<br />
formations cover large areas in the northwest and in the<br />
Jaffna Peninsula. They are important aquifers used<br />
extensively in the north for irrigation.<br />
- Among the superficial deposits of recent origin in<br />
many parts of the country are alluvium on the river<br />
floodplains and loose unconsolidated sands infthe<br />
coastal belt. As the Mineral Resources chapter-describes,<br />
these superficial deposits are economically important<br />
not only as grass lands and agricultural lands<br />
but as sources of gems, heavy mineral sands, and industrial<br />
clays.<br />
Climate<br />
As tourists come to know, Sri Lanka's tropical<br />
location ensures uniformly high temperatures throughout<br />
the year, but influence of the sea makes the island<br />
free from the temperature extremes experienced by<br />
continental interiors. Although mean annual temperatures<br />
in the lowlands are around 27°C, with a mean daily<br />
range of about 6°C, ground frost can sometimes appear<br />
in Nuwara Eliya in the central highlands, where the<br />
mean annual temperature is 15°C. In most parts of the
country daily temperature ranges are more significant<br />
than the seasonal change.<br />
Unlike conditions in mid-latitudes of the globe,<br />
seasons in Sri Lanka bring almost unnoticeable temperature<br />
fluctuations. Seasonality primarily results from<br />
variations in the rainfall rhythm, but because Sri Lanka<br />
is a predominantly agricultural country rainfall distribution<br />
over time and space is of great concern.<br />
Climatologjsts divide Sri Lanka's climatic year into<br />
five seasons:<br />
» The convectional-convergence period (March to<br />
mid-April), when the island comes under the influence<br />
of the Inter-Tropical Convergence Zone.<br />
This is a constant daily weather sequence with<br />
bright clear mornings that induce convectional activity<br />
leading to the formation of rain clouds by<br />
early afternoon and thunderstorms in the late afternoon.<br />
» Tliepre-monsoonalperiod (mid-April to late May),<br />
has transitional weather patterns. During this time<br />
convectional weather is gradually suppressed by<br />
surges of the southwest monsoon.<br />
•- The southwest monsoon period(late May to late<br />
September), which brings the largest amount of<br />
rainfall to the southwestern lowlands and<br />
• windward slopes of the central highlands, where<br />
some places receive over 5,000 millimeters annually.<br />
The southwestern monsoon blows across the<br />
northern, north central, and southeastern lowlands<br />
as a dry, desiccating wind.<br />
• Vie convectional cyclonic period (late September<br />
to late November), which begins to appear with the<br />
weakening of the southwest monsoon. Unlike the<br />
convectional weather in March-April, this period<br />
can include cyclones. When combined with convectional<br />
weather, cyclones occasionally produce<br />
periods of heavy rainfall causing widespread floods<br />
and landslides.<br />
• Tlie northeast monsoon (November to February),<br />
has a weak and dry wind compared with that of the<br />
southwest monsoon- However, the northeast mon-<br />
Introduction<br />
soon brings agriculturally significant rainfall to the<br />
northern and eastern parts of the country.<br />
Conventionally Sri Lanka recognizes two distinct<br />
climatic regions - the Wet and Dry Zones — although<br />
precise demarcation is subject to academic debate.<br />
Application of the term "Dry Zone" to an area that<br />
receives over 1,000 millimeters of rainfall can be misleading,<br />
however, and tends to create a psychological<br />
barrier to the human settlement and development of its<br />
resources. In addition some have identified an "Intermediate<br />
Zone" between the 'Wet' and 'Dry* zones,<br />
while others have chosen to depict the coastal areas of<br />
the northwest and those in the southeast as "arid zones."<br />
Hydrology<br />
Sri Lanka's rains feed a radial network of rivers that<br />
begins in the central highlands. Some 103 distinct river<br />
basins cover 59,217 square kilometers. The rest of the<br />
: land is practically devoid of surface water basins of any<br />
significance (Arumugam, 1969). Most identifiable<br />
stream basins are less than 100 square kilometers and<br />
many carry water only during the rainy season.<br />
The chapter on water resources describes the critical<br />
factors that determine how much surface water is<br />
actually or potentially available to Sri Lankans before<br />
it evaporates or reaches the sea, and how much can be<br />
obtained from the ground water recharged by the rains.<br />
Sri Lanka receives about 12 million hectare meters of<br />
water annually from rainfall, of which more than 50<br />
percent is lost through evapotranspiration. Another 20<br />
percent seeps down to replenish ground water. Only<br />
30 percent, or about 35 million hectare meters, is available<br />
as stream flow for irrigation or other purposes.<br />
A substantial proportion of surface water is already<br />
used for irrigation and hydropower generation. The<br />
chapter on inland aquatic systems describes how many<br />
of these uses have already affected the fishing and<br />
wildlife productivity of inland marshes, tanks and other<br />
waters that constitute an unusually high proportion of<br />
Sri Lanka's surface area. Land use in catchment areas<br />
affects the quality of these waters. Sedimentation may<br />
ultimately reduce original estimates of the lifetimes of<br />
dams and irrigation systems. Although water shortages<br />
constrain developments in the Dry Zone, excessive<br />
water flow in the Wet Zone often poses serious prob-<br />
I<br />
I<br />
I<br />
I<br />
I<br />
I<br />
I<br />
I<br />
I<br />
I<br />
I<br />
I<br />
I<br />
I<br />
I<br />
I<br />
I<br />
I<br />
I<br />
I<br />
I
I<br />
I<br />
I<br />
I<br />
I<br />
I<br />
I<br />
I<br />
I<br />
p<br />
I i :<br />
I<br />
I<br />
I<br />
I<br />
I<br />
I<br />
I<br />
I<br />
I<br />
lems of flooding and inundation, aggravated by floodplain<br />
settlement and misuse of uplands.<br />
Use and development of water resources has been<br />
an integral part of Sri Lanka's heritage, as described in<br />
the Inland Aquatic Resources chapter. About 12,000<br />
small village tanks now irrigate some 269,000 hectares<br />
mainly in the Dry Zone. Since ancient times they have<br />
been recognized as valuable sources of fish. Inland<br />
reservoirs now provide about 20 percent of Sri Lanka's<br />
fish production.<br />
Large-scale development of water resources for<br />
irrigation and hydro-power progressed rapidly during<br />
the last fifty years. Today largely because of dams on<br />
the Mahaweli, hydro-power provides 90 percent of Sri<br />
Lanka's electric energy. The large reservoirs irrigate<br />
over 500,000 hectares of land, and have an aggregate<br />
installed capacity of 938 Megawatts (1988). But opportunities<br />
for projects of large-scale water resource development,<br />
with a few limited exceptions, have been<br />
exhausted with the Mahaweli- Development Programme.<br />
Now attention must focus largely on opportunities<br />
for, small hydro-generation and more efficient<br />
use and distribution of existing water resources and<br />
developments.<br />
Pollution of Sri Lanka's waters, described in the<br />
section on water degradation, occurs throughout the<br />
island from domestic, industrial, and agricultural<br />
sources. Problems appear to be increasing. Health<br />
impacts are a basic indicator of this problem, but comprehensive<br />
data: are inadequate. Less than 25 percent<br />
of Sri Lankan households have access to pipe-borne<br />
water. The large majority still depend on water from<br />
wells, while about 7 percent draw water from rivers and<br />
reservoirs for domestic use. Industrial waste is in most<br />
cases untreated; Sri Lanka's only sewers exist in Colombo,<br />
serving about 20 percent of the larger Colombo<br />
metropolitan region of 1.8 million, but none of the<br />
discharge is treated.<br />
Ground water provides an increasingly important<br />
source of water for irrigation and domestic use. Contamination<br />
of wells from improper waste disposal is a<br />
rising concern in rural and urban areas. In the north<br />
central region investments in tube wells have substantially<br />
increased in recent years, but data and analysis of<br />
Introduction<br />
ground water conditions and trends indicate serious<br />
deficiencies. In Jaffna, however, symptoms of over-exploitation<br />
as well as contamination of well water from<br />
urban discharges and agro-chemical use threaten populations<br />
and economic development. These impacts<br />
are described in a topical box.<br />
People<br />
At the last census (1981) Sri Lanka had a population<br />
of 14.9 million and at present it is estimated to be<br />
nearing the 17 million mark. The great majority (75<br />
percent) of the people are Sinhalese. The Tamil population<br />
accounts for 18 percent including those in the<br />
estate sector, who are descendants of the workers from<br />
India brought to Sri Lanka by the British in the nineteenth<br />
century to work on plantations. The Moors,<br />
mostly Tamil-speaking, form the next largest minority<br />
comprising 7 percent of the population. All other minorities,<br />
including Burghers (descendants of Dutch and<br />
other Europeans), Eurasians, and Chinese, account for<br />
less than one percent, but remain as distinct ethnic<br />
groups.<br />
The growth and distribution patterns of Sri Lanka's<br />
population are described in detail in the chapter on<br />
population. Population has increased from 2.76 million<br />
in 1881 to the present 17 million, recording a sharp<br />
increase particularly after Independence. It is projected<br />
to reach about 20 million by the end of the<br />
century and to level off at about 25 million by 2046.<br />
Population concentrates heavily in the southwest<br />
and central regions of the island and in the Jaffna<br />
Peninsula. The Dry Zone, in spite of state-aided settlement<br />
schemes in recent decades, remains sparsely populated.<br />
Although the average density of population of<br />
the island is around 250 per square kilometer, it varies<br />
considerably from 50-3,000 between the areas of lowest<br />
and highest densities.<br />
Most Sri Lankans live in villages. Despite a steady<br />
flow of migration from rural to urban areas, the urban<br />
component of the population has remained virtually<br />
static at about 22 percent during the past decade.<br />
These trends have been expected to change with industrialization<br />
and scarcity of available rural land, and may<br />
reach 30 percent by the end of the century, which<br />
translates into an 88 percent increase in Sri Lanka's
urban population over its present urban component.<br />
Most of this increase will occur in the urban fringes,<br />
where public services are already under stress.<br />
The spoken language of the large majority of the<br />
people in Sri Lanka is Sinhala, while Tamil is the dominant<br />
language in the north and to some extent in the<br />
eastern and central regions. Use of English is most<br />
widespread among urban and educated classes, while<br />
it serves as a link language between different linguistic<br />
groups. Nearly 70 percent of the people are Buddhists,<br />
15 percent are Hindus, and the balance is equally divided<br />
between Muslims and Christians.<br />
Civil disturbances since 1983 in the north and east,<br />
and from 1987-1989 in other parts of the country, have<br />
affected natural resources and their management in<br />
many ways. One consequence has been an inability to<br />
carry out essential data gathering and field studies,<br />
including analyses of coastal, wildlife, forestry, and<br />
water resources. Other impacts include significant restrictions<br />
on resource management and enforcement.<br />
Profile chapters allude to many of these constraints.<br />
The Economy<br />
Since Independence Sri Lanka has achieved a high<br />
level of literacy (85 percent), a low rate of infant mortality<br />
and a high level of life expectancy at birth. Sri<br />
Lanka's economic performance until recently has been<br />
characterized by low output and poor employment<br />
growth in contrast to other countries that have grown<br />
rapidly; in 1960 Sri Lanka was more prosperous than<br />
South Korea and in 1970 more prosperous than Taiwan.<br />
As described in the chapter on the economy, real Gross<br />
Domestic Product (GDP) grew at 2.9 percent per year<br />
from 1971-1977. From 1978-1986, however, it grew at<br />
5.6 percent per year under a more liberalized economy<br />
and with substantial new foreign assistance and investment,<br />
including support for the Accelerated Mahaweli<br />
Development Project. Civil disturbances brought<br />
sharp declines from 1987-1989, when GDP grew at 2.2<br />
percent per year.<br />
In spite of changes since the late 1970s Sri Lanka<br />
remains primarily an agricultural country. Agriculture<br />
accounts for over 25 percent of the total GDP, nearly<br />
half the total employment and. export earnings, and<br />
about 40 percent of government revenues. Over 90<br />
Introduction<br />
percent of the rural population directly or indirectly<br />
depends on agriculture. Traditionally agriculture has<br />
consisted of the export-oriented plantation sector --<br />
primarily tea, rubber and coconut ~ and the household<br />
fanner sector, growing mainly paddy and subsidiary<br />
food crops for domestic consumption. Many varieties<br />
of fruits, vegetables and potatoes are grown in the hill<br />
country areas. A highly productive home garden sys-<br />
tem based on traditional land use patterns remains<br />
important and can be replicable in many parts of the<br />
island.<br />
Available information indicates that 27 percent of<br />
rural households are landless, 42 percent of the hold-<br />
ings are less than half a hectare. These statistics paint<br />
a distressing picture of the rural scene, and indicate<br />
some of the pressures that are exerted on the natural<br />
resource base.<br />
Plantation crops spread over about 800,000 hect-<br />
ares, particularly in the hill country and the wet and<br />
intermediate climatic zones. Although areas under all<br />
plantation crops, particularly rubber, have declined<br />
significantly over the last three decades, they remain<br />
important, sources of export earnings. Several other<br />
perennial crops such as cocoa, coffee, cinnamon, car-<br />
damom, pepper, nutmeg and cloves, often referred to<br />
as "minor export crops," have recently become signifi-<br />
cant exports.<br />
The industrial base is narrow. Major manufactur-<br />
ing industries, still primarily operated by the govern-<br />
ment, include cement, steel, paper, tires and ceramics.<br />
With the launching of the Free Trade Zone, the gar-<br />
ment industry has gained prominence through private<br />
investment Although foreign investment and external<br />
collaboration have given Sri Lanka access to important<br />
export markets, particularly for garments, other indus-<br />
tries have not yet expanded sufficiently to provide solu-<br />
tions to the twin problems of poverty and<br />
unemployment Yet, as the chapters on population and<br />
the economy make clear, Sri Lanka needs to create two<br />
million new jobs over the next decade to match popu-<br />
lation increases and relieve pressures on the land.<br />
I<br />
I<br />
I<br />
I<br />
I<br />
I<br />
I<br />
I<br />
I<br />
I<br />
I<br />
I<br />
I<br />
I<br />
I<br />
I<br />
I<br />
I<br />
I<br />
I<br />
I
I<br />
I<br />
I<br />
I<br />
I<br />
I<br />
I<br />
I<br />
I<br />
n<br />
1<br />
• i<br />
I<br />
I<br />
I<br />
I<br />
I<br />
I<br />
I<br />
I<br />
I<br />
I<br />
Constitutional and Administrative<br />
Structure<br />
Management of natural resources has increasingly<br />
depended on national administrative and legal structures.<br />
The Democratic Socialist Republic of Sri Lanka<br />
is a unitary state whose legal and administrative structure<br />
is based on its republican constitution. The national<br />
Constitution (1978) forms the supreme law under<br />
an Executive Presidency and a single house of Parliament.<br />
Sri Lanka consists of 25 administrative districts and<br />
nine provinces. The hierarchy of regional administrative<br />
divisions that supports the central government now<br />
consists of Provinces, Districts, Divisions and Grama<br />
Niladhari units, in descending administrative order and<br />
area.<br />
The Thirteenth Amendment to the Constitution in<br />
1987 provided for devolution of power to the provinces,<br />
and this process, potentially significant for natural<br />
resource management, is still underway. Provinces are<br />
now the fundamental administrative units of regional<br />
governance, and they have concurrent jurisdiction with<br />
the central government over the protection of the environment,<br />
soils, coastal fisheries, and wildlife, among<br />
other resources. Districts still form the basic units in<br />
the parliamentary election process, but they have lost<br />
much of their traditional local authority. The<br />
Kachcheries that once formed the hub of district administration<br />
may continue to function as administrative<br />
arms of the Central Government with a reduced staff<br />
and resources.<br />
At the village administrative level significant<br />
changes are also taking place. The former Grama Seva<br />
Niladhari Divisions have been made smaller, and a<br />
unified village-level administrative service has been introduced<br />
by bringing together the former Grama Seva<br />
Niladhari, Vaga Niladhari (Cultivation Officer) and<br />
Visesa Seva Niladhari (Special Services Officers) into<br />
one rank, renamed as Grama Niladhari.<br />
The authorities in the Central Government executive<br />
structure rank from the President to the Cabinet of<br />
Ministers, Project Ministers and State Ministers, and<br />
from Governors to Chief Ministers and their Cabinets<br />
at the provincial level. The elected government officers<br />
Introduction<br />
in Sri Lanka are the President, Members of Parliament,<br />
and Members of the Provincial Councils. In the hierarchy<br />
of administrative officials, Secretaries to the Cabinet,<br />
Project and State Ministers, Heads of<br />
Departments and Corporations function at the central<br />
government level. Chief Secretaries and Secretaries to<br />
provincial ministries operate in the provinces. The<br />
Divisional Secretaries (former Assistant Government<br />
Agents) and the Grama Niladhari carry out vital functions<br />
at the divisional levels.<br />
Translation of government policy into action is<br />
often entrusted to the bureaucracy, which has established<br />
its own norms for administrative and financial<br />
procedures. No cadre of environmental professionals<br />
exists, however, within the Sri Lanka Administrative<br />
Service.<br />
Legal Structure Affecting Natural<br />
Resource Management<br />
Article 28 of the Constitution states that "it is the<br />
duty of every person in Sri Lanka to protect nature and<br />
conserve its riches." To help implement this goal Sri<br />
Lanka has over 100 statutes directly or indirectly important<br />
to natural resource management and environmental<br />
protection.<br />
Compared with most developing countries, Sri<br />
Lanka has a long history of natural resource legislation.<br />
Laws supplement village traditions of resource use that<br />
operate in many parts of the island and may be most<br />
significant in coastal fisheries. Some of the statutes<br />
date back to the middle of the last century, including<br />
the Crown Lands Encroachment Ordinance of 1840,<br />
Irrigation Ordinance of 1856 and the Thoroughfares<br />
Ordinance of 1861. Among the more prominent<br />
pieces of legislation related to natural resources are the<br />
Forest Ordinance of 1907, the Land Development Ordinance<br />
of 1935, Fauna and Flora Protection Ordinance<br />
of 1937, Mines, Quarries and Minerals<br />
Ordinance of 1947, Crown Lands Ordinance of 1947,<br />
and the Soil Conservation Act of 1951. More recently,<br />
Parliament enacted the Coast Conservation Act of<br />
1981, the National Aquatic Resources Act of 1981, the<br />
National Heritage and Wilderness Act of 1987, and the<br />
National Environmental Act of 1980, which was<br />
amended in 1988 to require environmental impact as-
sessments and licenses for industries potentially producing<br />
air, water, and land pollution.<br />
The large numbers of government entities responsible<br />
for implementing environmental laws, and the<br />
gaps, overlaps and needs for cooperation and coordination<br />
that make this task difficult, are noted in each<br />
chapter.<br />
Key Issues- in Natural Resource<br />
Management<br />
Each chapter that follows raises major challenges<br />
that confront Sri Lanka as it grapples with environmental<br />
stress caused by rising population and increased<br />
demands on natural resource systems. Underlying<br />
these challenges are several key issues and questions<br />
that run through the text, and these are also addressed<br />
in the final chapter.<br />
One issue concerns how to obtain and use information<br />
on environmental conditions and trends in the most<br />
cost-effective manner possible. Whether the topics<br />
concern causes and effects of land, water, air, or biological<br />
resource degradation or other topics, they give<br />
rise to difficult but important practical questions.<br />
These include: who should gather and analyze the information,<br />
how should it be made available to all who<br />
need it, and how can it best be used for making decisions?<br />
A second issue concerns how to obtain informed<br />
public debate about the nature and direction of environmentally<br />
sustainable development in Sri Lanka.<br />
Introduction<br />
What are the essential elements of environmental conservation<br />
around which different interest groups can<br />
agree? Should, for example, development projects and<br />
investments focus most strongly on creating new employment<br />
that is environmentally sustainable, or on<br />
ways to maximize environmental benefits or agricultural<br />
productivity? Where should industrial growth<br />
occur — in Colombo, in smaller cities, in villages? How<br />
should concerns for decentralization of authority or<br />
distributive justice affect the components of sustainable<br />
development?<br />
A third basic issue concerns needs for effective<br />
implementation of environmental objectives by governmental<br />
and non-governmental entities..Nearly every<br />
chapter of this profile highlights the proliferation of<br />
agencies and other institutions involved in some aspect<br />
of land, water, or other natural resource. How can<br />
these resources be managed more effectively -- more<br />
efficiently -- given increased threats of environmental<br />
degradation, and needs for productivity? How can<br />
information on environmental costs and benefits be<br />
integrated into government and private sector economic<br />
decisions? What greater roles are possible by<br />
citizens, villages, businesses, and others? How should<br />
and could government change its role vis a vis the<br />
environment?<br />
We can be sure of one thing. Responses to these<br />
issues and questions will unfold over the next decade.<br />
By the turn of this century Sri Lanka will have made<br />
significant, in some cases irrevocable, environmental<br />
decisions affecting its future development.<br />
I<br />
I<br />
I<br />
I<br />
I<br />
I<br />
I<br />
I<br />
I<br />
I<br />
I<br />
I<br />
I<br />
I<br />
I<br />
I<br />
I<br />
I<br />
I<br />
I<br />
I
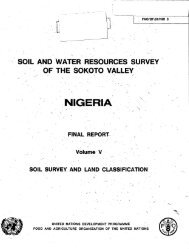
Introduction
10<br />
Among, the many ancient monuments of Sri Lanka's hydraulic civilization are these ruins at Yapahuwa<br />
I<br />
I<br />
I<br />
I<br />
I<br />
I<br />
I<br />
I<br />
I<br />
I<br />
I<br />
I<br />
I<br />
I<br />
I<br />
I<br />
I<br />
I<br />
I<br />
I<br />
I
I<br />
I<br />
I<br />
I<br />
i<br />
i<br />
i [ ;<br />
!<br />
i<br />
I<br />
i<br />
i<br />
i<br />
I<br />
i<br />
i<br />
I<br />
2 Heritage in Natural Resource<br />
Management<br />
Sri- Lanka's history of natural resources management<br />
and conservation has few parallels even among<br />
countries with old civilizations. Until the arrival of<br />
settlers around, the fifth century BC, Sri Lanka was<br />
affected only by prehistoric man. The few studies of its<br />
primeval landscape (Noon & Noon, 1941; Perera, 1975)<br />
suggest that the prehistoric Bandarawelian community<br />
used stone implements capable of clearing the forests<br />
and practicing a form of chena cultivation, possibly<br />
leading to the creation of some patana grasslands.<br />
Nevertheless, impacts on prehistoric man on the<br />
landscape and natural resources appear insignificant.<br />
The: legendary, story of civilization in Sri Lanka<br />
begins when the island was inhabitedby people of the<br />
original tribes Yakka, Raksa, and Naga. These early<br />
people gradually developed systems of sedentary<br />
agriculture based on irrigation, and folklore maintains<br />
that the Yakkas built some ancient irrigation tanks. By<br />
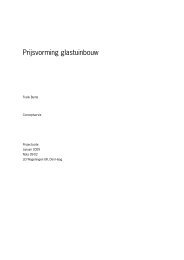
the arrival of Vijaya, a prince from North India, around<br />
500 BC, small-scale irrigation systems were already<br />
operational (Figure 2.1).<br />
The early Vijayan settlers probably harnessed the<br />
skills of local inhabitants predominantly Yakkas, to<br />
construct irrigation works and clear forests. In time<br />
these Yakkas merged with the Sinhalese to form a single<br />
community; those who resisted assimilation probably<br />
retreated to the interior forest and rock fastness, where<br />
jungles sustained them. The Nagas also integrated with<br />
the Sinhalese, but the Naga culture left a lasting imprint,<br />
particularly on water resources development. Some<br />
believe that the multi-headed cobra symbol often discovered<br />
at the sites of ancient irrigation structures and<br />
other water works, was the insignia of a Naga line of<br />
royalty well versed in hydraulic engineering.<br />
Hydraulic Civilization<br />
The early hydraulic societies thrived on small irrigation<br />
systems with unique assemblages of land uses<br />
and agricultural attributes (Leach, 1959). Possibly<br />
these systems evolved from early rain-fed shifting<br />
agriculture into small-scale irrigation that, in turn, led<br />
to major systems. The sedentary way of life facilitated<br />
by this hydraulic base led to land tenure, property<br />
inheritance, and social organizations that persisted for.<br />
centuries. Community leadership patterns had to be<br />
strong and effective with increasing size and complexity<br />
of irrigation systems. These-conditions eventually led<br />
to centralized authority representing a form of "oriental<br />
despotism" (WitfogeL 1959);<br />
Conveyance of irrigation water over long distances<br />
needed efficient control: over distribution and. allocation<br />
between the top- and tail-ends of the system.<br />
Smooth functioning of all hydraulic structures required<br />
efficient maintenance. Irrigation depending on microcatchments<br />
required careful watershed management to<br />
reduce siltation and ensure catchment water yields.<br />
The land and water use system that developed over<br />
centuries to satisfy these requirements has been<br />
described as a "cascading system" (Madduma Bandara,<br />
1985).<br />
Organization of small tanks into a cascading sequence<br />
within micro-catchments allowed greater efficiencies<br />
in water use (see Figure 22). Drainage from<br />
the paddy fields in the upper part of the cascade flowed<br />
into a downstream tank for reuse in the paddy fields<br />
below. The system fully expressed the well known dictum<br />
by the King Parakramabahu (AD 1153) that "not a<br />
single drop of water received from rain should be allowed<br />
to escape into the sea without being utilized for<br />
human benefit."<br />
System, management required community effort<br />
and coordination. A breach in the upper-most tank<br />
bund through neglect or excess water would threaten<br />
the collapse of the entire sequence of tanks below.<br />
Similarly, if the capacity of a tank was increased ar-
12 Heritage<br />
The Relative Number of Tanks (in use and abandoned)<br />
24 48<br />
miles<br />
Th» rectangles indicate the different sheets under which Sri Lanka is mapped on the scale of one inch to a mile<br />
Rgure 2.1
I<br />
I<br />
I<br />
I<br />
I<br />
I<br />
I<br />
I<br />
I<br />
I i<br />
[ •<br />
i<br />
I<br />
I<br />
I<br />
I<br />
I<br />
bitrarily by one village raising the bund or the spillway,<br />
it could inundate the lowermost paddy fields in an<br />
upstream village. Interdependent between villages in<br />
a cascade required well-coordinated management of<br />
land and water resources.<br />
The land use associated with tank cascades<br />
demonstrated a profound knowledge of resource<br />
management in a challenging environment essentially<br />
transformed from natural ecosystems into agroecosystems<br />
(Abeywickrema, 1990). Integrated land<br />
and water resources management in ancient times is<br />
reflected in the zonation of land use within the microcatchments.<br />
The tanks and the paddy fields occupied<br />
the valleys where Low-Humic-Gley soils with poor<br />
drainage had limited use other than for bunded paddy<br />
cultivation. Ridge summits, often strewn with rock<br />
outcrops and inselbergs, were converted into works of<br />
art and places of worship and spiritual retreat. The<br />
influence of Buddhism led to the establishment of<br />
sanctuaries early in history (de Alwis, 1969) and the<br />
enduring protection of wildlife unusual in many parts<br />
of the world (Kablishingh, 1988).<br />
The middle part of the catena between the ridge<br />
tops and valley bottoms was used for rain fed chena<br />
farming where Reddish Brown Earths proved ideal for<br />
many subsidiary seasonal food crops. Although in the<br />
modern context, chena wastes resources in Sri Lanka's<br />
early history long fallow periods allowed vegetative<br />
regeneration, and use was sufficiently infrequent to<br />
avoid serious soil erosion and environmental damage.<br />
Moreover village farmers spared large trees to provide<br />
shade and places for watch-huts. Small trees were<br />
lopped at breast height to enable them to sprout again<br />
at the end of the rainy season. Even during the Dutch<br />
period, introduction of cinnamon in chena lands was<br />
apparently done to enrich forest with cinnamon rather<br />
than to grow it as a monoculture (Abeywickrema,<br />
1990).<br />
The ancient village with its typical threefold land<br />
use system — paddy field, home garden, and chena was<br />
self-sufficient and provided a stable base for long-term<br />
use. As Brohier (1934) noted, "tank" would appear to<br />
be synonymous with "village," implying that each<br />
agricultural settlement had a tank; and paddy field<br />
below it.<br />
Heritage 13<br />
The remainder of the ancient population lived in<br />
the larger irrigation areas that developed subsequently,<br />
or in cities like Anuradhapura in the Dry Zone<br />
lowlands. The hill country and the Wet Zone attracted<br />
only a few settlements.<br />
The skills in irrigation technology possessed by the<br />
ancients were unique for a small country like Sri Lanka.<br />
As Needham noted "[ajlready in the first century AC,<br />
they understood the principle of the oblique weir.... the<br />
height of dam spillways were adjusted by removable<br />
pillar sluices were well understood, ... the inside surfaces<br />
of reservoir abutments were faced with 'ripple<br />
bands'... which acted as wave-breaking groynes ... the<br />
most striking invention was the intake-towers or valve<br />
towers (bisokötuwa)." They developed the knowledge<br />
to construct long canals with extremely low gradients,<br />
such as the Jaya Ganga, which carried water from<br />
Kalawewa to the city tanks of Anuradhapura along a<br />
canal 87 kilometers long (Figure 2.3). This yoda ela,<br />
which had a gradient of less than 10 cm per kilometer<br />
within its first 27 kilometers, continued to maintain<br />
itself as a natural stream. Some of the major ancient<br />
tanks, such as Yodawewa in Mannar district, were constructed<br />
to feed a large number of small tanks.<br />
The establishment of forests and construction of<br />
ponds, reservoirs and irrigation systems were considered<br />
great meritorious acts in accordance with<br />
popular Buddhism, the faith of the leaders and the large<br />
majority of the people. Sri Lanka's history is full of<br />
achievements of kings who contributed to the<br />
development of water resources. Since the first century<br />
AD kings such as Vasabha (67-111 AD) Mahasena<br />
(276-303 AD), Dhatusena (455-473 AD), Agbo II (575-<br />
608 AD) and Parakramabahu I (1153-1186 AD) built<br />
numerous reservoirs and irrigation systems which fed<br />
vast expanses of paddy field in the Dry Zone. Construction<br />
and upkeep of these irrigation systems became<br />
massive undertakings. An indigenous expertise<br />
developed over the centuries which appears to have<br />
been called upon by other countries of South Asia.<br />
Not all irrigation systems remained operational<br />
throughout this history (Figure 2.1). Their numbers<br />
and command areas expanded and contracted with<br />
population changes. Nevertheless, up to the twelfth<br />
century AD the ancient Dry Zone supported a dense
14<br />
— — - Moinaxifotcascad»<br />
PoddyfitWt<br />
M Homtsttod<br />
km<br />
Heritage<br />
Cascades of Village Tanks<br />
Figure 2.2<br />
Slyambala Wtwa<br />
:'^W/ Bandara Ratmal*<br />
Timbiri Wtwa
I<br />
I<br />
I Heritage 15<br />
HSSA WEWA (JAYA WAPI)<br />
Built in 3O9 B.C.<br />
Restored 1809 V»5<br />
Channel constructed before Yj.<br />
Nachchaduwa Tank was H<br />
built to tap the Malwatu Oyd<br />
Not restored<br />
Channel built circa 459-479 A.O.<br />
conducting water from Kala Wewa<br />
to Tisso Wewa<br />
Restored 1835-88 A.O.<br />
DIAGRAM SHOWING<br />
NACHCHADUWA.NUWARA WEWA.TISSA WEWA<br />
NUWARA WEWA<br />
Built I s» Century 0. C.<br />
Restored 1839 A.O.<br />
NACHCHADUWA TANK ,'i<br />
Built B66-90IA.0.<br />
Restored 1906 A.D.<br />
Tirappane, source of Talawe Ela down wich the<br />
Jaya Ganga was directed into Wiloehchiya Korale<br />
Trabe of Ancient Channel from the<br />
Jaya Ganga to Kussawa Tank submerged<br />
by Nachchaduwa Traced in 1888<br />
by Mr Muray, Gmt. Agent<br />
Figure 2.3<br />
AND<br />
THE ANCIENT CANAL SYSTEM<br />
Scale: Two Miles to One Inch<br />
Approximate position of<br />
Anicut which deflected<br />
the water into Nuwara Wtwa<br />
The dressed stone was .<br />
removed in \B73 tor<br />
Erecting the road bridge
16<br />
population. Folklore maintains that the density of<br />
houses allowed a fowl to move continuously from<br />
Anuradhapura to Polonnaruwa by hopping over the<br />
rooftops! Attempts to estimate the ancient population<br />
on the basis of tank densities, without considering their<br />
temporal changes, have led to gross over-estimations<br />
which exceeded even the present population.<br />
However, the population in the capital city appears to<br />
have been high, as reflected by the urban limits of<br />
Anuradhapura, which encompassed an area the size of<br />
Greater London today.<br />
Collapse of the Rajarata Civilization<br />
The ancient hydraulic civilization of the Dry Zone<br />
disappeared after the twelfth century. Climatic change,<br />
malaria, depletion of soil fertility, foreign invasions and<br />
famine are some of the reasons cited. The breakdown<br />
of the efficient irrigation management system may have<br />
resulted' from annihilation of the kulinas — the Dry<br />
Zone nobility who possessed irrigation expertise — by<br />
invading South. Indian forces (Paranavitana, 1960).<br />
Some scholars (Farmer, 1957) cite a combination of<br />
factors, including a push-pull effect that led to<br />
demographic shifts from the Dry Zone to the Wet Zone<br />
(Roberts, 1971). Whatever the reasons for collapse, the<br />
outcome indicates the ecological and social fragility of<br />
a human settlement pattern based on surface irrigation<br />
systems.<br />
The Kandyan Kingdom<br />
With the decline of the hydraulic civilization Sri<br />
Lanka's capital began to shift from the Dry to the Wet<br />
Zone and to the hill country, which eventually became<br />
the stronghold of the Sinhalese people against invading<br />
forces. First Anuradhapura, capital of Sri Lanka for<br />
over a millenium, yielded its status to Polonnaruwa.<br />
Then after brief spells in Dambadeniya, Kotte, Gampola<br />
and Sitavaka, the capital was finally established<br />
in Kandy until the British conquest. Population shifts<br />
across different ecological zones, from the Dry Zone,<br />
to the Wet Zone, and to the hill country, required an<br />
agrarian society to adjust to new environments and try<br />
new ways of managing land and water.<br />
In the hill country the people modified their life to<br />
suit the wetter and' more rugged terrain; The paddy<br />
Heritage<br />
cultivation in thedeniyas (valley bottoms) was irrigated<br />
during the drier periods through canals that collected<br />
water from springs in the hill slopes. Hills performed<br />
the function of reservoirs, and the management of<br />
watersheds necessarily formed an integral component<br />
of the agricultural enterprise. Different ecological segments<br />
of the slopes were recognized, as reflected in<br />
village names such as Ovita, Ovilla and Ovilikanda<br />
according to their location. Valley bottoms around<br />
which settlements arose were named after the valley<br />
with the suffix of deniya (e.g. Gurudeniya, Aideniya,<br />
Peradeniya). At the lower segment of the catena, forest<br />
gardens were developed in the homesteads. Farther<br />
up, chena cultivation was practiced occasionally on a<br />
largely sustainable basis. Hilltops were permanently<br />
kept under a thick forest cover, which helped control<br />
soil erosion and regulate water flow.<br />
The Kandyan Forest Garden became a man-made<br />
forest consisting of various fruits and other economically<br />
useful tree species, such as nutmeg and cloves. It<br />
essentially copied the diversity and intricate interrelationships<br />
of the natural forest. Kandyan Forest<br />
Gardens are located between the valley bottoms and<br />
high slopes to avoid damp conditions and benefit from<br />
a deep soil cover and seepage of moisture from the<br />
upper regions. Aerial photographs can distinguish<br />
Kandyan homesteads from the natural forests by the<br />
sand-strewn compounds in front of the houses, which<br />
brought much fresh air and sunshine. The micro- environment<br />
of a Kandyan homestead provided a suitable<br />
base for the continuity of human settlements in a wet<br />
montane setting.<br />
The Colonial Period<br />
The Portuguese, and then the Dutch, ruled the<br />
maritime areas of the island after the beginning of the<br />
sixteenth century. Canals began to change some coastal<br />
areas, and exploitation of natural resources on a<br />
commercial scale began during this period except in the<br />
hillyinterior of the country, which continued under the<br />
monarchy. Far more significant changes in the natural<br />
environment of the island began after the Kandyan<br />
Kingdom fell to the British in 1815.<br />
The full brunt of the colonial rule began with the<br />
enforcement of new land laws by the British in the first
I<br />
I<br />
I<br />
I<br />
I<br />
I<br />
I<br />
II<br />
I<br />
half of the nineteenth century. The land policy pursued<br />
by the British was based on the concept of "crown land,"<br />
which led to the enactment of legislation to bring vast<br />
extents of land directly under colonial administration.<br />
The Crown Lands Encroachments Ordinance of 1840<br />
proclaimed that "all forest, waste, unoccupied or uncultivated<br />
land shall be presumed to be the property of the<br />
crown until the contrary thereof be proved." Thus over<br />
90 percent of the country fell under direct control of the<br />
colonial government, which eventually paved the way<br />
for large-scale enterprises of plantation agriculture.<br />
The adverse social impacts of colonial land policy,<br />
particularly on the villages of the hill country, are better<br />
documented than their ecological consequences. The<br />
large majority of the peasantry that owned land through<br />
various forms of inheritance were unable to produce<br />
documentary proof of their ownership rights. Further,<br />
no proof of ownership was possible for the common<br />
land used for c/te/ta cultivation. The colonial<br />
government took all these lands, the majority of which<br />
were under some forest cover, and sold them cheaply<br />
to private parties. The hill country, still clothed in thick<br />
montane rain forests, became almost totally denuded<br />
within less than a half a century. Over four thousand<br />
elephants may have been killed in the process.<br />
Equally devastating impacts on landscape ecology<br />
followed the process of deforestation. Soil erosion,<br />
landslides and siltation of stream and reservoir beds<br />
became rampant and significantly altered the surface<br />
hydrology. Serious land degradation became so obvious<br />
that the colonial government reacted by devis-<br />
References<br />
Abeywickrema, B.A. (1990). Integrated conservation for human<br />
survival - International symposium on Ecology and<br />
Landscape Management in Sri Lanka, Colombo.<br />
Brohier, R.L. (1934-35). Ancient irrigation works in Ceylon parts<br />
I, II and HI. Government Press, Ceylon.<br />
Crown Lands Ordiance (1947). No. 8 of 1947 and amendments.<br />
Government Press, Colombo.<br />
Encroachment upon crown lands ordinance (1840). Government<br />
Press, Colomba<br />
Heritage 17<br />
ing means to preserve the area above 1,500 meters. The<br />
birth of the forest department was associated initially<br />
with the need for soil conservation in the highlands.<br />
Similarly wildlife protection began with concern for<br />
preserving game reserves. Crown ownership nevertheless<br />
facilitated preservation of natural forest cover,<br />
which accounted for some 45 percent of Sri Lanka by<br />
the time of National Independence. Plantation<br />
agriculture also developed soil conservation technologies<br />
such as contour drains and stone terracing,<br />
which proved efficient in many well-maintained estates.<br />
Despite these attempts, however, soil erosion remained<br />
a recurrent public concern in the last years of the<br />
colonial rule.<br />
The colonial heritage provided Sri Lanka with a<br />
wide variety of legislation that facilitated conservation<br />
of natural resources through land orders and regulations.<br />
The Crown Land Ordinance of 1947, one such<br />
example, provided for the protection of coastal<br />
resources, stream banks and the beds of reservoirs. To<br />
a large degree the Soil Conservation Act of 1951,<br />
though passed after Independence, is a similar legacy<br />
of colonial times. The Kothmale landslides of 1947<br />
which destroyed much life and property, requiring<br />
resettlement of many families, stimulated public concern,<br />
a comprehensive study (Gorrie, 1949), and eventually<br />
enactment of the Soil Conservation Act of 1951.<br />
Its failure as a regulatory tool suggests the need for a<br />
reappraisal of effective techniques -- perhaps based on<br />
village community behavior and incentives more soundly<br />
linked to Sri Lanka's traditional concern for a sustainable<br />
and productive environment.<br />
Farmer, B.H. (1957). Pioneer peasant colonization in Ceylon. A<br />
study in Asian agrarian problems. Oxford University Press,<br />
London.<br />
Gorrie, Maclagen (19S4). Kotmale landslides and adjoining catchments.<br />
Sessional paper No. XVII of 1954. Government Press.<br />
Leach. E.R. (19S9). Hydraulic society of Ceylon, past and present.<br />
Vol. 15, pp. 2-26.<br />
Madduma Bandara, CM. (1985). Catchment ecosystems and village<br />
tank cascades in the Dry Zone of Sri Lanka - in
18 Heritage<br />
Needham, J. (1971). Gvil engineering and nautics - science and<br />
civilization in China. CambridgeUniversity Press.<br />
Paranavithana, S. (1960). The withdrawal of Sinhalese from the<br />
ancient capitals. History of Ceylon, Vol. I. University of<br />
Ceylon, Peradeniya.<br />
Perera, N.P. (197S). The human influence on the natural vegetation<br />
of Sri Lanka highlands. Vidyodaya Journal of Arts,<br />
Science and Literature, Vol. V.<br />
Roberts, M. (1971). The ruin of ancient Ceylon and drift to the<br />
southwest: The Ceylon Journal of Humanities, Vol II, No. 1.<br />
Toynbee, Arnold J. (193S). A study of history. London.<br />
Witfogel, ICA. (1957). Oriental Despotism; a comparative study<br />
of total power. Yale University Press, New Haven.
I<br />
I<br />
I<br />
I<br />
Heritage ig
A festival scene in Negombo. Sri Lanka's urban population is growing faster than rural population<br />
I<br />
I<br />
I<br />
I<br />
I<br />
I<br />
I<br />
I<br />
I<br />
I<br />
I<br />
I<br />
I<br />
I<br />
I<br />
I<br />
I<br />
I<br />
I<br />
I<br />
I
3 Population Profile<br />
Population Growth<br />
Sri Lanka's population has grown rapidly until recently.<br />
By 1986 it reached 16.8 million, yet in the first<br />
modern census, conducted in 1822 after the British<br />
occupation, population was 889,584. By the next census<br />
in 1871 population had increased to 2.4 million, largely<br />
due to natural increase and immigration from South<br />
IB<br />
14<br />
12<br />
10<br />
8<br />
6<br />
4<br />
2<br />
the birth and death rates, the cohort sizes of females in<br />
reproductive age groups, and slow decline in fertility,<br />
have contributed to the natural increases that account<br />
for over 95 percent of the total population growth in the<br />
past few decades.<br />
Changes in Fertility<br />
Population of Sri Lanka in Census Years<br />
1871 - 1981<br />
Enumerated Population (Millions)<br />
India for the plantations (Figure 3.1).<br />
Sri Lanka had high birth rates at the beginning of<br />
1871 1881 1891 1901 1911 1921 1931 1941 1951 1961 1971 1981<br />
Population increased by 518.5 percent between<br />
1871 and 1981, but the rates and causes of growth have<br />
been very different. For the intercensal periods 1891-<br />
1901,1921-1931 the percentage increase over each ten-<br />
year period was about 18 percent and the average<br />
annual rate of growth was about 1.7 percent, but in the<br />
first period it stemmed from large-scale migration into<br />
the country, and in the latter period it largely resulted<br />
from natural increases. Increases in the gap between<br />
Figure 3.1<br />
/<br />
the century. Crude birth rate (CBR) fluctuated between<br />
38-40 per thousand in the first few decades of the<br />
twentieth century but has now declined to 21.8 per<br />
thousand. A more refined measure of population<br />
growth is the total fertility rate, defined as the average<br />
number of children that would be born to a woman<br />
during her lifetime if she passed through her childbearing<br />
years conforming to the age-specific fertility<br />
rate of a given year. The total fertility rate, estimated<br />
at 53 in 1953, was nearly halved by 1987. This decline<br />
is reflected in the following rates.<br />
y<br />
21
22<br />
Year<br />
1953<br />
1963<br />
1971<br />
1974<br />
1981<br />
1987<br />
1.5<br />
1<br />
0.5<br />
POPULATION PR<strong>OF</strong>ILE<br />
Projected Population Growth Rates<br />
Avarag* Annual Rat« of Growth<br />
-<br />
0<br />
198 I-86 86-91 91-96 96-2001 01-06<br />
Period<br />
Total Fertility Rate<br />
5.3<br />
5.0<br />
4.2<br />
3.5<br />
3.3<br />
Figure 3.2<br />
Rapid population growth during the past decades,<br />
slow economic growth, and problems of unemployment<br />
and productivity have determined governmental policy<br />
on population. Policies that provide family planning<br />
information and contraceptive services contribute to<br />
continued decline marital fertility. Population projections<br />
constructed in 1988 assumed a linear total fertility<br />
decline to 2.1 by 2011, slightly lower than projected in<br />
1985. Some projections have been based on a fertility<br />
decline to 2.1 by the year 2000, based on findings of high<br />
motivation among" married couples to reduce fertilty<br />
rates. It is important to note that projections in this<br />
analysis, however, assume that total fertility will remain<br />
stable throughout the period of projection.<br />
2.8<br />
Figure 3.3<br />
06-11<br />
Mortality<br />
11-16 16-21 21-26<br />
I<br />
I<br />
I<br />
I<br />
I<br />
I<br />
I<br />
I<br />
I<br />
I<br />
I<br />
Until the 1940s the crude death rate remained at<br />
high levels, reaching 30 per thousand in some decades •<br />
(1911-1920). Several reasons have been cited: "... wide- •<br />
spread prevalence of endemic and epidemiological diseases,<br />
inadequate curative preventive health services, I<br />
low standards of living, high illiteracy rates and igno- *<br />
ranee of simple health rules among the mass of the<br />
people" (ESCAP 1974). Improvements in health and I<br />
sanitation services and in living standards and literacy<br />
levels reduced the live death rates to approximately 23 -^<br />
per thousand by 1930. The malaria eradication pro-1<br />
gram, improvement of health infrastructure and provision<br />
of basic services made it possible to achieve a sharp _<br />
decline in mortality in the mid-1940s. Between 19461<br />
and 1947 the crude death rate declined from 20 per<br />
thousand to 14 per thousand, and it has continued to «m<br />
decline to 6 per thousand. Life expectancy at birth I<br />
increased from 44 years for males and 42 years for<br />
females in 1946, to 64 years for males and 68.8 years for<br />
females by 1971. The life expectancy further increased<br />
to 65.6 for males and 69.9 for females according to data<br />
for 1978-1980.<br />
The crude death rate will probably not decline<br />
further. As fertility declines and the population ages,<br />
I<br />
I<br />
I
I<br />
I<br />
j<br />
I<br />
I<br />
I ; ;<br />
1<br />
I<br />
I<br />
(<br />
I<br />
I<br />
I<br />
I<br />
I<br />
I<br />
1{ •<br />
1<br />
I<br />
I<br />
I<br />
I<br />
16 Millions<br />
Millions<br />
POPULATION PR<strong>OF</strong>ILE 23<br />
Projected Total Population<br />
by Selected Age Groups 1981 - 2051<br />
2011 2021 2031 2041<br />
I 0 - 14 Years EZZ115 - 59 Years 60 * Years<br />
Figure 3.4<br />
Population Distribution<br />
by Climatic Zones 1871 - 1981<br />
1871 1881 1891 1901 1911 1921 1931 1941 1951 1961 1971 1981<br />
Years<br />
Maritime Districts i Plantation Districts<br />
Figure 3.5<br />
Dry Zone Districts
24<br />
the crude death rate will be close to the crude birth rate,<br />
and population growth will reach a replacement plateau.<br />
International Migration<br />
It is difficult to predict migration trends, given the<br />
social, political and economic variables in countries of<br />
origin and destination. The inflow of Indian migrant<br />
workers resulted in large net immigration until midcentury.<br />
Migration into Sri Lanka on a large scale and<br />
on systematic basis began in the early 1830s<br />
with the opening up of the hill country areas<br />
for coffee plantations. The reluctance of the<br />
indigenous labor to accept employment on the<br />
newly opened estates resulted in a regular<br />
recruitment by the European planters of large<br />
numbers of indentured labourers from South<br />
India. In the past while Sri Lanka has been<br />
receiving a large number of immigrants, the<br />
number of nationals emigrating from the country<br />
had been negligible. None of the indigenous<br />
communities are migratory in character.<br />
They are attached to their land and have had<br />
better fortune with it than have the South Indian<br />
peasants. (ESCAP 1974).<br />
Citizenship laws of 1949 regulated immigration,<br />
and political changes and new language policies after<br />
independence stimulated emigration of Eurasian and<br />
Burgher communities to North America, Western Europe,<br />
Australia, and other parts of Asia. The Indo-Ceylon<br />
Agreement of 1964 for repatriation of Indian<br />
migrant workers substantially increased out-migration<br />
in the 1970s. Outflows of nationals to developed countries<br />
for economic reasons commenced at the end of the<br />
1960s and assumed brain drain proportions in the<br />
1970s. Demand for labor in the Middle East raised the<br />
volume of temporary migration after the mid-1970s,<br />
when total volume of migration to this region peaked<br />
around 225,000. It declined after 1984 and more rapidly<br />
with the Gulf crisis in 1990. Ethnic violence in the<br />
1980s resulted in migration of Sri Lankan Tamils to<br />
India, estimated at 100,000. Violence and terrorist activities<br />
also caused clandestine migration to Western<br />
Europe and North America, mostly for economic rea-<br />
POPULATION PR<strong>OF</strong>ILE<br />
sons. The flows were large but reliable data are not<br />
available.<br />
The population projection constructed in 1988 assumed<br />
net outilow of 50,000 per year in the short term<br />
until 1991, and average rates of 35,000 per year from<br />
1991 to 2006 and 25,000 per year thereafter. Major<br />
changes in social, political and economic conditions<br />
could seriously alter these estimated migration flows,<br />
however, especially in the short term.<br />
Projected Population<br />
The population projection used in this profile was<br />
constructed in 1988 based on the assumptions outlined<br />
above on fertility, mortality and migration. The projection<br />
provides only tentative estimates to 2056, primarily<br />
to examine the size and composition of the population<br />
as growth rates decline. Long range projections have<br />
been found reliable only in the short and medium term.<br />
According to the current projection, population<br />
has increased from 15.046 million in 1981 to 16.587<br />
million in 1986 and is projected to rise to 20.05 million<br />
in 2001,22.01 million in 2011, and 23.725 million in 2021.<br />
In 2046 it should peak at 25.444 million, resulting in a<br />
69 percent increase since 1981. The average rates of<br />
annual growth are given in Figure 3.3 and numerical<br />
increase in Figure 3.4.<br />
In contrast, other projections have concluded that<br />
population will increase to less than 20 million by the<br />
year 2000 and will stabilize at about 23 million by 2040.<br />
They are based on less conservative basic assumptions.<br />
This projection discloses several noteworthy<br />
trends concerning pre-school and elderly populations.<br />
The pre-school age group of 0-4 years would increase<br />
from the base year 1981 until 1986, decline until 2006,<br />
increase again to 2016, and then decline (Figure 3.4).<br />
The relative share of this age group would continuously<br />
decline from 13.5 per cent in 1986 to 6.5 per cent toward<br />
the end of the projection period. Young dependents in<br />
the age group 0-14 years would peak near 1991, at about<br />
5.9 million, and would decline thereafter. In contrast,<br />
the elderly population shows a dramatic increase. The<br />
population over 60 years of age would increase more<br />
than threefold, from 982,000 in 1981 to 3.15 million by<br />
2016. Ranks of the elderly would continue to increase<br />
I<br />
I<br />
I<br />
I<br />
I<br />
I<br />
I<br />
I<br />
I<br />
I<br />
I<br />
I<br />
I<br />
I<br />
I<br />
I<br />
I<br />
I<br />
I<br />
I<br />
I
I<br />
I<br />
I<br />
I<br />
I<br />
I<br />
I<br />
I<br />
I<br />
I<br />
I i<br />
I<br />
I<br />
I<br />
I<br />
I<br />
I<br />
I<br />
I<br />
I<br />
to over 6 million toward the end of the projection. As<br />
a result, old age dependency would continue to rise.<br />
Cost of old age dependency may be less than youth<br />
dependency; instead of costs of schools, for example,<br />
outlays would be mainly for pensions, health care, and<br />
special facilities needed by the elderly.<br />
POPULATION DISTRIBUTION<br />
We can best examine social and economic development<br />
in terms of agro-climatic zones by dividing the<br />
population into geographical boundaries. The Wet<br />
Zone is defined by administrative districts of Colombo,<br />
Gampaha, Kalutara, Galle, Matara, Kandy, Nuwara<br />
Eliya, Ratnapura and Kegalle, with the Dry Zone comprising<br />
the remaining sixteen districts. Within the Wet<br />
Zone districts it is useful to distinguish Colombo,<br />
Gampaha, Kalutara, Galle and Matara, all of which<br />
have maritime boundaries. They also differ from other<br />
Wet Zone districts by having relatively high levels of<br />
development, industrial employment and urban population.<br />
In contrast hill country Wet Zone districts have<br />
large plantation sectors.<br />
The distribution of population by climatic zones for<br />
the period 1871-1981 is given in Figure 3.5. It shows<br />
that since 1871, and until recently, population has<br />
largely concentrated in the Wet Zone districts. By<br />
1946, two-thirds of the population lived in 23.7 percent<br />
of the country. The increase resulted primarily from<br />
the development of the plantation industry in the Wet<br />
Zone, the influx of Indian immigrant plantation laborers,<br />
growth of trade and commercial activities in Wet<br />
Zone maritime districts, and the prevalence of malaria<br />
in the Dry Zone. Increased density in the Wet Zone<br />
caused overcrowding and reduced per capita availability<br />
of agricultural land.<br />
Since 1946 the government has sought to improve<br />
the Dry Zone through irrigation, new settlements, and<br />
improved health care, education and communication<br />
facilities. Repatriation of Indian immigrant labor was<br />
also encouraged particularly from hill country plantation<br />
districts, where the share declined from 26.4 percent<br />
in 1931 to 2L1 percent Today the relative share<br />
of the Wet Zone- population has diminished to 54.7<br />
POPULATION PR<strong>OF</strong>ILE 25<br />
percent. Substantial additional redistribution of the<br />
population to Dry Zone agricultural land is not anticipated.<br />
Instead, population growth will occur in existing<br />
urban areas, and other areas selected for industrial and<br />
commercial development.<br />
Population Density<br />
Sri Lanka is one of the most densely populated<br />
countries in the world, second only to Bangladesh<br />
among the less developed countries and otherwise exceeded<br />
in Asia only by Japan, Republic of Korea, and<br />
small island states such as Singapore and Hong Kong.<br />
Population density in Sri Lanka, on the basis of the<br />
current estimated population of 16.8 million, amounts<br />
to 260 persons per sq. km. Uneven concentration of<br />
population in the Wet Zone causes further pressure on<br />
natural resources. (Figure 3.6.)<br />
Regional variation of population densities and the<br />
growth trends for the decennial period are shown in<br />
Figure 3.8, summarized and given by province in Figure<br />
3.7. Some provinces are still relatively sparsely populated.<br />
Densities in 1988 varied from a low 42 persons<br />
per sq. km. in Vavuniya and 46 in Mullaitivu in the<br />
Northern Province to nearly 2,900 per sq. km. in the<br />
Colombo district. Wide variation in the Provincial densities<br />
occur as well, from 1,175 per sq. km. in the Western<br />
Province to 94 persons per sq. km. in the North<br />
Central Province. The North Central, Eastern, and Uva<br />
Provinces have population densities below 125 persons<br />
per sq. km., substantially below the densities of all other<br />
provinces except the Northern Province, with its relatively<br />
low 145 persons per sq. km.<br />
Since independence, inter-provincial and interdistrict<br />
migration, and peasant settlement in the Dry<br />
Zone have reduced disparities in population concentrations.<br />
The distribution of population and population<br />
densities are also determined by the industrial profile<br />
of the area, and access to jobs. In rural areas, where<br />
demographic, social and economic differences are generally<br />
not sharply pronounced, migration has depended<br />
on opportunities for work, including wage employment<br />
in nearby urban centers. The rise in unemployment<br />
levels in urban areas has reduced the volume of these<br />
rural flows.
26<br />
POPULATION PR<strong>OF</strong>ILE<br />
Population Danalty Par Square Kllomatar<br />
anti<br />
600<br />
BG - BANGLADESH<br />
IN • INDIA<br />
NE - NEPAL<br />
i A An<br />
14UO<br />
1200-<br />
1000-<br />
800-<br />
600-<br />
400<br />
200-<br />
0-<br />
NP - Nothern Province<br />
UVA' - Province of Uva<br />
EP - Eastern Province<br />
400<br />
200<br />
0<br />
8Q KO JA SL IN<br />
KO - KOREA<br />
VI-VIETNAM<br />
CH-CHINA<br />
BU- BURMA<br />
Population Density in<br />
VI PH PA NE<br />
Country<br />
JA - JAPAN<br />
1986<br />
CH TH ID BU MA<br />
SL - <strong>SRI</strong> <strong>LANKA</strong><br />
PH - PHILIPPINES PA - PAKISTAN<br />
TH • THAILAND<br />
MA - MALAYSIA<br />
Figure 3.6<br />
ID • INDONESIA<br />
Population Density & Distribution<br />
by Province<br />
'opulation Per Square Kilometer<br />
1 1<br />
1 • •<br />
III..• .II<br />
• • • m m m m m m m\<br />
WP CP SP NP EP NWP NCP UVA SAB ALL<br />
Province<br />
NCP - North Central Province NWP - North Western Province<br />
SAB - Province of Sabaragamuwa CP - Central Province<br />
WP - Western Province- SP - Southern Province<br />
Figure 3.7<br />
I
I<br />
I<br />
I<br />
I<br />
I<br />
I<br />
I<br />
I<br />
I<br />
II •<br />
Ï<br />
I I<br />
I<br />
I<br />
I<br />
I<br />
I<br />
I<br />
I<br />
I<br />
I<br />
Province / District<br />
Sri Lanka<br />
Western Province<br />
Colombo<br />
Gampaha<br />
Kalutara<br />
Central Province<br />
Kandy<br />
Matale<br />
Nuwara Biya<br />
Southern Province<br />
Galle<br />
Matara<br />
Ambantota<br />
Northern Province<br />
Jaffna<br />
Mannar<br />
Vavuniya<br />
Mullaitivu<br />
Eastern Province<br />
Batticaloa<br />
Am para<br />
Trincomalee<br />
North Western Province<br />
Kurunegala<br />
Puttalam<br />
North Centeral Province<br />
Anuradhapura<br />
Polonnaruwa<br />
Uva Province<br />
Badulla<br />
Moneragala<br />
Sabaragamuwa Province<br />
Ratn apura<br />
Kegalle<br />
Land area<br />
Square KM<br />
64,651.83<br />
3,657.84<br />
652.42<br />
1,398.85<br />
1,606.57<br />
5,583.24<br />
1,890.76<br />
1.988.59<br />
1,703.85<br />
5,513.83<br />
1,673.91<br />
1,246.56<br />
2,593.36<br />
8.685.53<br />
2,072.25<br />
2,002.06<br />
2,645.16<br />
1,966.06<br />
9.622.07<br />
2,464.63<br />
4,539.22<br />
2,618.22<br />
7,749.76<br />
4.772.83<br />
2,976.93<br />
10,532.97<br />
7,129.21<br />
3.403.76<br />
8,405.04<br />
2.818.17<br />
5.586.87<br />
4,901.55<br />
3,238.78<br />
1,662.77<br />
POPULATION PR<strong>OF</strong>ILE 27<br />
Density Of Population Per Square Kilometer<br />
By Province And District 1871 -1988<br />
%<br />
100.0<br />
5.7<br />
1.0<br />
2.2<br />
2.5<br />
3.6<br />
2.9<br />
3.1<br />
2.6<br />
8.5<br />
2.6<br />
1.9<br />
4.0<br />
13.4<br />
3.2<br />
3.1<br />
4.1<br />
3.0<br />
14.9<br />
3.8<br />
7.0<br />
4.0<br />
^^.0<br />
7.4<br />
4.6<br />
16.3<br />
11.0<br />
5.3<br />
13.0<br />
4.4<br />
8.6<br />
7.6<br />
5.0<br />
2.6<br />
Figure 3.8<br />
1953<br />
125<br />
610<br />
838<br />
328<br />
245<br />
359<br />
87<br />
268<br />
205<br />
314<br />
336<br />
74<br />
66<br />
193<br />
18<br />
09<br />
37<br />
38<br />
31<br />
110<br />
133<br />
25<br />
22<br />
22<br />
56<br />
56<br />
182<br />
132<br />
287<br />
Density per Square km<br />
1963<br />
165<br />
776<br />
1,089<br />
398<br />
304<br />
466<br />
130<br />
328<br />
259<br />
388<br />
418<br />
107<br />
85<br />
248<br />
25<br />
19<br />
57<br />
81<br />
72<br />
54<br />
149<br />
181<br />
103<br />
37<br />
40<br />
34<br />
78<br />
188<br />
19<br />
229<br />
171<br />
352<br />
1971<br />
196<br />
930<br />
2,297<br />
839<br />
454<br />
350<br />
508<br />
158<br />
377<br />
301<br />
439<br />
470<br />
131<br />
101<br />
336<br />
37<br />
23<br />
22<br />
75<br />
104<br />
60<br />
72<br />
181<br />
215<br />
127<br />
52<br />
55<br />
48<br />
96<br />
218<br />
35<br />
269<br />
208<br />
387<br />
1981<br />
230<br />
1.072<br />
2,605<br />
994<br />
516<br />
360<br />
486<br />
180<br />
420<br />
341<br />
487<br />
516<br />
164<br />
128<br />
401<br />
53<br />
36<br />
39<br />
101<br />
134<br />
86<br />
98<br />
220<br />
254<br />
165<br />
81<br />
82<br />
77<br />
109<br />
227<br />
49<br />
302<br />
246<br />
412<br />
1988<br />
257<br />
1,174<br />
2.891<br />
1.067<br />
570<br />
385<br />
644<br />
204<br />
309<br />
389<br />
542<br />
596<br />
190<br />
146<br />
408<br />
62<br />
42<br />
46<br />
120<br />
159<br />
100<br />
115<br />
251<br />
288<br />
192<br />
94<br />
96<br />
90<br />
122<br />
244<br />
60<br />
332<br />
277<br />
440
28<br />
Urban-Rural Distribution<br />
Urban growth in developed countries has accompanied<br />
economic and industrial development, but that<br />
is not necessarily true in developing countries; despite<br />
urbanization their national economies can still remain<br />
primarily agrarian.<br />
Internationally recognized yardsticks delineate<br />
urban and rural areas. The UN has identified five:<br />
administrative area, population size, local government<br />
area, urban characteristics, and predominant economic<br />
activity. In Sri Lanka, with its traditional agricultural<br />
economy, urban areas can retain largely rural characteristics.<br />
This was true long ago, as described by the<br />
census report in 1946.<br />
The great city of Anuradhapura in ancient times,<br />
notwithstanding its size and architectural features was<br />
not altogether 'urban', for it contained within its limits<br />
irrigation tanks, paddy fields, and even forests. Within<br />
the municipal limits of Kandy today, there are situated<br />
estates of appreciable acreage, while within the area<br />
under the administrative jurisdiction of the Badulla<br />
urban council there are large paddy fields. Some of the<br />
larger villages are more densely populated than some<br />
'towns' which had been brought under the operation of<br />
the Small Towns Sanitary Ordinance. Town and village<br />
are ordinarily wards of somewhat vague application<br />
and are not easily defined and distinguished. (Census<br />
of Population 1946 : General Report.)<br />
In recent times the delineation of urban boundaries<br />
in Sri Lanka has not necessarily been based on urban<br />
character or well-defined guidelines. Today, census<br />
definitions of urban areas include Town Councils,<br />
Urban Councils, and Municipal Councils. But from<br />
1963 to 1971, for example, Town Council status was<br />
given to communities with populations ranging from<br />
less than 2,000 to over 40,000. As a result, many truly<br />
"urban" areas have been considered "rural." Precise<br />
urban-rural distinctions remain somewhat arbitrary<br />
and may underestimate urban environmental conditions<br />
or growth trends. Unless these factors are recognized,<br />
urban statistics may mislead planners and policy<br />
makers required to identify needs for urban infrastructure,<br />
housing, potable water supplies, health-, and other<br />
basic human requirements in highly populated areas.<br />
POPULATION PR<strong>OF</strong>ILE<br />
Trends<br />
Between 1871 and 1981 Sri Lanka's urban population<br />
increased twelvefold, and the urban share increased<br />
from approximately 11 percent to nearly 22<br />
percent. Urbanization has slowed during the past four<br />
decades and declined during the intercensal period<br />
1971-1981. Policies of the past five or six decades that<br />
emphasized development of rural infrastructure and<br />
social sector programs, kept urbanization rates at modest<br />
levels, as did low rates of industrialization. Urbanization<br />
rates have been lower than those of many<br />
countries of the region and the urban sector share of<br />
the population has been relatively low (see Figure 3.9).<br />
Nevertheless, contrary to these national trends, unusually<br />
high rates of growth have occurred within the Colombo<br />
Urban Area. (See box on urbanization in Sri<br />
Lanka.)<br />
The urban population of 1 million in 1946 increased<br />
to 3.2 million in 1981, while total population<br />
increased from 6.6 million to 14.8 million (Figure 3.10).<br />
Between 1946 and 1981 the urban percentage share of<br />
population increased by approximately 6 percentage<br />
points. Growth of urban population was higher between<br />
1953 and 1963, when the growth rate reached<br />
4.88 percent per annum, after which the growth rate<br />
declined.<br />
Variation in the urban population percentage<br />
among the provinces ranges from 46.7 percent in the<br />
Western Province to 6.2 percent in the North Western<br />
Province. The percentage of urban population in the<br />
Western Province is more than double that of any other<br />
province except the Northern Province. In the Western<br />
Province the urban percentage has steadily increased<br />
from 33 percent in 1946 to 48 percent in 1971, showing<br />
a decline in 1971-1981. If we included the developed<br />
areas, outside the local authority areas then the urban<br />
percentage would be even higher. More importantly,<br />
57 per cent of the country's urban population resides in<br />
the Western Province. Figure 3.11 shows that the urban<br />
population in the Northern Province, lower than the<br />
national average in 1946 and 1953, exceeded the national<br />
average by 1963. Urban population growth has<br />
been relatively slow in the North Central Province and<br />
Central Province.<br />
I<br />
I<br />
I<br />
I<br />
I<br />
I<br />
I<br />
I<br />
I<br />
I<br />
I<br />
I<br />
I<br />
I<br />
I<br />
I<br />
I<br />
I<br />
I<br />
I<br />
I
I<br />
I<br />
I<br />
I<br />
I<br />
I<br />
I<br />
II<br />
I<br />
I<br />
1<br />
I<br />
I<br />
I<br />
I<br />
I<br />
I<br />
I<br />
j<br />
I i<br />
i<br />
Country<br />
Bangladesh<br />
Burma<br />
India<br />
Indonesia<br />
Laos<br />
Malaysia<br />
Nepal<br />
Pakistan<br />
Philippines<br />
Singapore<br />
Sri Lanka<br />
Thailand<br />
Vietnam<br />
Total Population (millions)<br />
20<br />
1 c<br />
10<br />
5<br />
I<br />
i<br />
-<br />
oP<br />
1881<br />
POPULATION PRORLE 29<br />
Percentage Urban in Total Population<br />
Urban<br />
1891 1901 1911<br />
40 60<br />
Percentage<br />
•11965 ES<br />
Figure 3.9<br />
Population 1881<br />
•<br />
1921 1931 1941<br />
Census Years<br />
80<br />
1985<br />
- 1981<br />
WM Rural Population Ë=Üi Urban Population<br />
Figure 3.10<br />
100 120<br />
1951 1961 1971 1981
30<br />
Significant changes in urbanization rates are not<br />
foreseeable in the long term. Rates of economic<br />
growth, and increased industrial employment will<br />
largely determine urban growth in the short and medium<br />
term. Population growth, pressures on agricultural<br />
land and rising rural land prices, expansion of<br />
trade and commerce, provision of urban electricity,<br />
communication services and amenities and needs to<br />
develop manufacturing industries may slowly raise urbanization<br />
levels. If, as is possible, urbanization reaches<br />
30 percent by the end of the century, then the population<br />
living in urban areas would increase to 6.015 million —<br />
an 88.4 percent increase over the current urban population.<br />
If the present urban distribution pattern continues,<br />
then as much as 50 percent of the urban population<br />
will remain in the Western Province.<br />
These urban projections, when added to existing<br />
urban needs (see sections on water and air degradation),<br />
point compellingly to new urban planning and<br />
investment challenges.<br />
Many other Third World cities now grapple with almost<br />
intractable problems of pollution,transportation,and<br />
infrastructure inadequacy that have rapidly outpaced<br />
urban planning and investment. Sri Lanka would do<br />
well to anticipate and prevent a similar fate by attention<br />
to potentially significant increases in problems of waste<br />
water management, drinking water supply and quality,<br />
air quality, solid waste disposal, and adequate housing,<br />
transportation, and health services.<br />
FAMILY SIZE AND<br />
HOUSEHOLD COMPOSITION<br />
Analyses of families and households determine,<br />
and in turn are influenced by, basic demographic variables<br />
of fertility, mortality and migration. Recent censuses<br />
have paid increased attention to the household as<br />
a basic socio-economic unit that supplies and demands<br />
goods and services.<br />
The concept of the household is based on the arrangements<br />
made by persons individually or in groups<br />
to provide themselves with food or other living essentials.<br />
A household may be either a one-person household,<br />
or a multi-person household that pools income<br />
and uses a common budget. Household members may<br />
or may not be related.<br />
POPULATION PR<strong>OF</strong>ILE<br />
The censuses and surveys conducted in Sri Lanka<br />
have used household as the basic unit of enumeration.<br />
The concept of the household as a unit in Sri Lanka has<br />
always denoted one or more family units residing in a<br />
housing unit. Although a household could comprise<br />
more than one family unit the reverse is not feasible.<br />
The extended family relationship is accommodated by<br />
a definition allowing integration of several family units<br />
under one household. The head of the household is<br />
accepted as the adult person, male or female, who is<br />
responsible for the care of the household.<br />
Growth of Households and Family<br />
Formations<br />
Since the census of 1953 the total number of households<br />
in Sri Lanka increased nearly 90 percent, from 1.6<br />
million to 3.05 million in 1981. Urban households trebled,<br />
from 0.19 million to 0.59 million, due to the rise of<br />
new urban centers, internal migration, and increased<br />
family size in urban areas. Growth of rural households<br />
was slower; including the estate sector, rural households<br />
grew by only 73.0 percent. Average household<br />
size increased for the country as a whole from 5.0 in 1953<br />
to 5;2 by 1971, due in part to the slow growth of available<br />
housing. It declined thereafter to 4.9 persons by 1981.<br />
(Figure 3.12 and 3.13)<br />
Trends data show that family formation has occurred<br />
at a slightly higher rate than population increase,<br />
but in the urban sector population growth outstripped<br />
the rate of family formation.<br />
Size of Households<br />
A declining trend in household size is evident from<br />
the Consumer Finance surveys, which provide broadly<br />
comparable data.<br />
Declines in household size and family size resulted<br />
from declines in fertility that began in the late 1950s.<br />
Urban sector households have been consistently larger<br />
because of boarders, domestic servants and aides.<br />
Scarcity of housing in the urban centers has probably<br />
slowed the formation of new h< ..=^holds as children<br />
delay leaving the nuclear family. In contrast, the size of<br />
estate sector households has always been lower than the<br />
all-island average.<br />
I<br />
I<br />
I<br />
I<br />
I<br />
I<br />
I<br />
I<br />
I<br />
I<br />
1<br />
I<br />
I<br />
I<br />
I<br />
I<br />
I<br />
I<br />
I<br />
I<br />
I
I<br />
I<br />
I<br />
Ii •<br />
I<br />
I<br />
I<br />
1<br />
j<br />
I<br />
I<br />
I<br />
I<br />
I<br />
I<br />
I<br />
I<br />
1<br />
I<br />
I<br />
I<br />
Thousands<br />
2000<br />
1500<br />
1000<br />
500<br />
Millions<br />
POPULATION PRORLE 31<br />
Distribution of Urban Population<br />
by Province 1953 - 1981<br />
WP CP SP NP EP NWP NCP UVA SAB<br />
Province<br />
1953 1963 1971 1981<br />
Figure 3.11<br />
Growth of Households by Sector<br />
1953 - 1981<br />
Sri Lanka Urban Rural Sri Lanka Urban Rural Sri Lanka Urban Rural Estate<br />
1953 1971 1981<br />
••^Population f^ N ^ Households<br />
Rgure 3.12
32<br />
Forecast of Households<br />
Projections for number of households and the rate<br />
of growth of households improve estimates of housing<br />
requirements and the provision of amenities. A general<br />
paucity of data on households and family formation<br />
and headship collected through censuses and<br />
surveys makes projections difficult, however. Based on<br />
a formula developed by the UN, and the data from<br />
Censuses of Population and Housing 1971 and 1981,<br />
estimates have been developed for the total number of<br />
households for the quinquennial years 1981-2001, the<br />
rate of increase of households in this period, and the<br />
average size of households (See Figure 3.14).<br />
The forecast shows the total number of households<br />
reaching 4.575 million by the end of the century. This<br />
means nearly 400,000 households added during each<br />
quinquennial period — or 1,600,000 householders between<br />
1981 and 2001. Housing facilities and suitable<br />
locations will be needed to meet this increased demand.<br />
Even so, the rate of increase in the number of households<br />
will decline during this period. The average size<br />
of households will drop from 4.9 in 1981 to 4.4 in 2001<br />
(Figure 3.13).<br />
HOUSING<br />
The Census of Population 1981 estimated the total<br />
number of dwelling places at 3.029 million, of which<br />
2.924 million were housing units and 0.105 million were<br />
living quarters other than housing units. The total number<br />
of occupied housing units amounted to 2.813 million,<br />
and of them 0.110 million, or 3.8 percent, were<br />
vacant at the time of enumeration. The percentage of<br />
vacant housing units varied in the different sectors, 43<br />
percent were vacant in the rural sector, 4.7 percent in<br />
the estate sector, and only 13 percent in the urban<br />
sector.<br />
Growth of Housing Stock<br />
During the intercensal period 1971-1981 the housing<br />
stock increased by 26.9 percent while the population<br />
increased by 17 percent. Hence the housing stock increased<br />
at an average annual rate of 2.4 percent. In<br />
contrast housing stock increased by only 12.5 percent<br />
in the intercensal period 1963-1971, when population<br />
increased by 19.9 percent. The growth of population<br />
POPULATION PR<strong>OF</strong>ILE<br />
and housing stock between 1971 and 1981 and the<br />
percentage intercensal increases are illustrated in Figure<br />
3.15.<br />
Quality of Housing Units<br />
The structural quality of housing depends on the<br />
construction materials used. Three types of housing<br />
units have been identified based on construction material<br />
used for walls, roofing and floors: permanent, semipermanent,<br />
and improvised units. In general where all<br />
material consists of durable products like cement,<br />
bricks, tiles or asbestos sheets, the unit may be considered<br />
permanent If units use perishable materiab such<br />
as cadjan, or discarded wooden planks, the unit is<br />
classified as improvised, and when a mixture has been<br />
used we consider it semi-permanent. (Figure 3.16) In<br />
the intercensal period 1971-1981 the percentage of permanent<br />
units increased from 35.4 percent to 41.9 percent,<br />
a 50 percent increase. The percentage share of<br />
permanent units increased in all three sectors, whereas<br />
the relative share of improvised units declined. The<br />
major part of the increase in permanent units was in the<br />
rural sector. Data on the age of stock show distinct<br />
improvements in the pace of permanent housing construction<br />
after 1977.<br />
Materials of Construction<br />
The percentage distribution of occupied housing<br />
units by principal materials used for walls, roofing and<br />
floor by sector is shown in Figure 3.17. Slightly more<br />
than half of all housing units have used materials such<br />
as mud, wood, cadjan or palmyrah for the construction<br />
of walls. For roofing material approximately 42 percent<br />
used cadjan, palmyra or similar materials. Just over 50<br />
percent of all occupied housing units used wood, mud<br />
or other materials for the floors. All the materials are<br />
of domestic origin, although timber and cement imports<br />
are beginning to be needed.<br />
Age of Housing Stock<br />
The age of housing stock ascertained at the 1981<br />
Census was based on the year of completion or first<br />
occupation. The increase in housing units since 1971<br />
is shown in Figure 3.18. This distribution shows that 62<br />
percent of the housing units were constructed in 1970<br />
or before, and 73.2 percent were permanent units.<br />
I<br />
I<br />
I<br />
I<br />
I<br />
I<br />
I<br />
I<br />
I<br />
I<br />
I<br />
I<br />
I<br />
I<br />
I<br />
I<br />
I<br />
I<br />
I<br />
I<br />
I
I<br />
I<br />
I<br />
I<br />
I<br />
I<br />
I<br />
I<br />
I j<br />
I<br />
I<br />
j •<br />
I<br />
I<br />
I<br />
I<br />
I<br />
I r :<br />
j<br />
I<br />
I<br />
1<br />
1<br />
CAAft<br />
ouuu<br />
4000<br />
POPULATION PRORLE 33<br />
Average Size of Households by Sector<br />
1953 - 1981<br />
No. of Persons/Household<br />
,_——<br />
3000<br />
2000<br />
1000<br />
1953<br />
Urban ESS Rural Sri Lanka<br />
Figure 3.13<br />
Total No. of Households in Thousands<br />
0<br />
1981<br />
Forecasts<br />
^___<<br />
1986<br />
•—<br />
- m<br />
1981<br />
Estate<br />
of Households 1981 - 2001<br />
1991<br />
Year<br />
— Total No. Forecast<br />
Figure 3.14<br />
^ —<br />
1996 2001
34<br />
Sector<br />
Urban<br />
Rural<br />
Estate<br />
All Sectors<br />
100<br />
80<br />
60<br />
40<br />
20<br />
0<br />
-20<br />
-40<br />
-60<br />
-80<br />
POPULATION PR<strong>OF</strong>ILE<br />
Growth of Total Population and Increase in Occupied Housing 1971 - 1981<br />
Increase<br />
1971<br />
2.848<br />
8.707<br />
1.134<br />
12.689<br />
All<br />
Total<br />
(million)<br />
Total Population<br />
1981<br />
3.192<br />
10.720<br />
.933<br />
14.847<br />
%of<br />
Increase<br />
12.1<br />
23.1<br />
-17.7<br />
17.0<br />
Figure 3.15<br />
1971<br />
0.421<br />
1.558<br />
0.238<br />
2.217<br />
Occupied Houslnj1<br />
Units<br />
1981<br />
0.512<br />
2.085<br />
0.217<br />
2.813<br />
%of<br />
Increase<br />
21.5<br />
33.7<br />
-8.6<br />
26.9<br />
Percent Increase of Occupied Housing<br />
by Type & Sector 1971 - 1981<br />
Urban Rural<br />
Sectors<br />
vvv<br />
Estate<br />
Permanent Semi-Permanent I I Improved<br />
Figure 3.16
I<br />
I<br />
I<br />
I<br />
I<br />
I<br />
I<br />
1<br />
I<br />
I<br />
I<br />
I !<br />
I<br />
I<br />
I<br />
I<br />
I<br />
I<br />
I<br />
I<br />
I<br />
Those constructed between 1971 and 1975 amounted<br />
to 10.5 percent of the total stock. The growth rate<br />
accelerated to 3.9 in 1976, declined to 3.4 percent by<br />
1977, then increased to 4.2 percent in 1978 and 5.3<br />
percent by 1980.<br />
Occupancy and Overcrowding<br />
Sharing of housing units had declined by 1981 in<br />
numerical magnitude and as a percentage. The Census<br />
of 1981 disclosed that over 90 percent of the housing<br />
units in each sector were occupied by single households.<br />
Only 4.8 percent of the housing units were<br />
shared by more than one household in 1981, compared<br />
to 7.6 percent in 1971.<br />
Type of Lighting<br />
The Census of 1981 found that 82 percent of all<br />
housing units depended on kerosene lamp lighting<br />
(Figure 3.19). Electric lighting increased from 9 percent<br />
in 1971 to 14.9 percent in 1981. Housing units<br />
using electricity in the urban sector increased from<br />
approximately 33 percent to over 45 percent. In the<br />
rural sector, only 8.3 percent of the houses received<br />
electricity, but the number of rural housing units using<br />
electric lighting rose substantially, from 44,000 to<br />
172,000.<br />
In the estate sector, however, the number of housing<br />
units using electricity was only 5.6 percent. Rural<br />
electrification programs undertaken during the past<br />
years may have raised these proportions, but the backlog<br />
of units not yet provided with electricity remains<br />
substantial in the rural and estate sectors.<br />
Main Sources of Drinking Water<br />
Housing units with access to piped water increased<br />
from 0.444 million in 1971 to 0.497 million in 1981, but<br />
the proportion with piped water declined from 20 percent<br />
to 17.5 percent (Figure 3.20). Housing units dependent<br />
on wells for drinking water increased from 63.8<br />
percent to 72.9 percent. Thus wells remain the main<br />
source of drinking water for nearly three-fourths of the<br />
country's population, and the proportion dependent on<br />
rivers, tanks, and other surface sources has remained<br />
around 7 percent. By 1981 nearly all urban housing<br />
POPULATION PR<strong>OF</strong>ILE 35<br />
units had access to piped water. The share of estate<br />
sector housing units with this facility has been traditionally<br />
high at about two-thirds. An insignificant proportion<br />
(about 5 percent) of the rural housing units are<br />
served with piped water, and about 85 percent depend<br />
on well water. Although wells are still Sri Lanka's principal<br />
source of drinking water, as many as 20 percent of<br />
wells are unprotected and allow inflow of polluted<br />
water.<br />
Dispersal of housing units in village areas, absence<br />
of potable ground water for drinking, and the cost of<br />
providing pipe borne water will remain important development<br />
issues, especially because approximately<br />
800,000 additional housing units must be supplied between<br />
1990 and the end of the century. The magnitude<br />
of this backlog of housing units requiring safe drinking<br />
water is evident from Figure 3.21, which provides data"<br />
on the main source of drinking water by district. In 14<br />
out of the 25 districts (Kalutara, Matale, Galle, Matara,<br />
Hambantota, Mullaitivu, Ampara, Kurunegala, Anuradhapura,<br />
Polonnaruwa, Badulla, Moneragala,<br />
Ratnapura and Kegalle) more than one-third of the<br />
population do not have access to safe drinking water<br />
and are using unprotected wells, rivers and tanks. In<br />
rural areas the shallow wells used for drinking water are<br />
frequently holes dug in the ground that run dry during<br />
the dry season and receive polluted water during the<br />
rainy season.<br />
Toilet Facilities<br />
Poor sewerage facilities for housing lead to contamination<br />
of water sources and the spread of disease.<br />
The 1981 Census data disclosed that one out of every<br />
three houses lacked sanitary toilet facilities, down from<br />
35.5 percent in 1971. In the urban sector during this<br />
period, the proportion not served by sanitary toilet<br />
facilities remained unchanged at approximately 20 percent.<br />
The rural sector made some gains; the proportion<br />
declined from 42J percent to 36.5 percent, but in the<br />
estate sector the position deteriorated.<br />
Part of the overall decline may have been due to a<br />
change in the definition used in the 1981 Census, which<br />
categorized a unit using a toilet of another housing unit<br />
as one lacking a toilet.
36<br />
MuO 16.5<br />
Brick ar CaDook 52.3<br />
Cement Blocks<br />
63<br />
Brick or CaDook<br />
15.9<br />
Tile 37.6<br />
POPUUTION PRORLE<br />
Urban-Walls Rural - Walls<br />
Wood 9.4<br />
Othar 0.7<br />
Cement Blocks 18<br />
Palmyrah. Cadjan 5.1<br />
Brick or CaOook 27.6<br />
Mud 53<br />
Estate - Walls Urban - Roof<br />
Rural - Roof<br />
Otner 2<br />
Mud<br />
18.6<br />
Cadian, Straw 48.6<br />
Metal Sheets 7.7<br />
Palmyrah. Cadjan<br />
0.5<br />
Asbestos sneets 4.1<br />
Rgure 3.17<br />
Tlie 48.2<br />
Asbestos sheets 16.2<br />
Metal Sheets 71.5<br />
Estate - Roof<br />
, Cement Blocks 11.9<br />
Other 0.6<br />
Palmyrah. Cadian 5.6<br />
Wood 1.3<br />
Metal Sheets 12.9<br />
Other 1<br />
Cadian. Straw 21.8<br />
ASDBSIOS sneets 13.1<br />
Tiia 12<br />
Otner 0.6<br />
' Caajan. Straw 2.86<br />
i<br />
i<br />
i
I<br />
I<br />
I<br />
I<br />
I<br />
I<br />
I<br />
I<br />
I<br />
I:<br />
i<br />
i<br />
i<br />
i<br />
i<br />
t<br />
i<br />
i<br />
i<br />
Cement or ' •-. ' _• -•<br />
Wood 0 2<br />
POPULATION PRORLE<br />
Urban - Floor<br />
Rural - Floor<br />
Mud 54.6<br />
Estate - Floor<br />
Rgure 3.17<br />
Other 0.5<br />
Mud 18.8<br />
Cement or Tiie 44.7<br />
wood 0.3<br />
Wood 0.9<br />
Other 0.5<br />
Cement or Tile 24 5<br />
Otnei o l<br />
37
38<br />
Mo. of units (Thousands)<br />
3000-<br />
2500-<br />
2000-<br />
1500-<br />
1000-<br />
500-<br />
opre<br />
Age and Increase<br />
POPULATION PR<strong>OF</strong>ILE<br />
1970 71-75 76 77<br />
Year of<br />
Kerosene<br />
82.5%<br />
of Housing<br />
^ — ^<br />
78<br />
Construction<br />
Figure 3.18<br />
Stock<br />
79<br />
Domestic Lighting 1981<br />
Total No. of Housing Units > 2.813,444<br />
Figure 3.1»<br />
Other<br />
3.6%<br />
1981<br />
^——<br />
Electricity<br />
14.9%<br />
80 81
I<br />
I<br />
I<br />
I<br />
I<br />
I<br />
I<br />
1<br />
I<br />
Î I<br />
I<br />
I<br />
I<br />
I<br />
I<br />
I i<br />
I<br />
I<br />
District<br />
Sri Lanka<br />
Colombo<br />
Gampaha<br />
Kalutara<br />
Kandy<br />
Matale<br />
Nuwara Biya<br />
Galle<br />
Matara<br />
Hambantota<br />
Jaffna<br />
Mannar<br />
Vavunia<br />
Mullaitivu<br />
Batticaloa<br />
Am para<br />
Trincomalee<br />
Kurunegala<br />
Puttalam<br />
Anuradhapura<br />
Polonnaruwa<br />
Badulla<br />
Moneragala<br />
Ratnapura<br />
Kegalle<br />
100<br />
Main Source Of<br />
Total<br />
Number<br />
2813844<br />
272,488<br />
265,951<br />
160,422<br />
178,379<br />
68,208<br />
122,828<br />
146.385<br />
121,755<br />
80,496<br />
157,609<br />
18,049<br />
17.703<br />
13,505<br />
69,090<br />
77,974<br />
47,822<br />
263.504<br />
105,169<br />
107,914<br />
48,183<br />
120,182<br />
51,551<br />
158,686<br />
139,992<br />
POPULATION PR<strong>OF</strong>ILE<br />
Distribution of Occupied Housing Units<br />
by Source of Drinking Water<br />
1071 1061<br />
Urban<br />
EE3 pipwi w»t»r ES3 wall<br />
1071 1071 1081<br />
Rural Estate<br />
• Rlvar. Tank« «to- E3 Not Stat«»<br />
Figure 3.20<br />
Drinking Water In Occupied Housing Units<br />
By Districts 1981<br />
%<br />
100.0<br />
100.0<br />
100.0<br />
100.0<br />
100.0<br />
100.0<br />
100.1<br />
100.0<br />
100.0<br />
100.0<br />
99.9<br />
100.0<br />
99.9<br />
100.9<br />
99.9<br />
100.0<br />
100.0<br />
99.8<br />
100.0<br />
99.9<br />
100.0<br />
100.0<br />
100.0<br />
100.0<br />
99.9<br />
Piped<br />
Water<br />
%<br />
17.6<br />
52.0<br />
8.7<br />
5.5<br />
29.3<br />
14.2<br />
61.0<br />
6.2<br />
9.9<br />
11.2<br />
10.8<br />
21.3<br />
4.6<br />
3.8<br />
4.0<br />
7.5<br />
6.7<br />
2.2<br />
7.4<br />
6.7<br />
2.4<br />
43.5<br />
4.7<br />
19.4<br />
10.0<br />
Figure 3.21<br />
Protected<br />
Well<br />
%<br />
52.2<br />
37.8<br />
66.1<br />
59.1<br />
44.0<br />
46.6<br />
13.2<br />
61.3<br />
47.4<br />
41.5<br />
76.9<br />
70.3<br />
74.1<br />
59.6<br />
75.9<br />
61.6<br />
64.0<br />
64.5<br />
66.8<br />
60.0<br />
47.9<br />
24.0<br />
35.3<br />
34.8<br />
51.6<br />
Unprotec-<br />
ted Well<br />
20.6<br />
7.4<br />
21.9<br />
28.7<br />
19.7<br />
24.2<br />
8.0<br />
27.6<br />
36.0<br />
30.1<br />
8.0<br />
5.7<br />
13.4<br />
27.5<br />
9.3<br />
13.9<br />
16.7<br />
26.7<br />
18.8<br />
23.4<br />
39.5<br />
14.9<br />
29.3<br />
21.4<br />
28.3<br />
River.tank &<br />
Other Source<br />
%<br />
7.0<br />
0.5<br />
0.6<br />
3.8<br />
4.7<br />
12.8<br />
10.4<br />
3.1<br />
4.9<br />
16.1<br />
2.1<br />
Z1<br />
3.7<br />
6.3<br />
9.0<br />
12.3<br />
10.6<br />
4.5<br />
5.1<br />
7.7<br />
6.7<br />
13.8<br />
28.8<br />
22.5<br />
7.6<br />
Not<br />
Stated<br />
%<br />
2.5<br />
2.3<br />
2.7<br />
2.9<br />
2.3<br />
2.2<br />
7.5<br />
1.8<br />
1.8<br />
1.1<br />
2.1<br />
0.6<br />
4.1<br />
2.7<br />
1.7<br />
4.7<br />
2.0<br />
1.9<br />
1.9<br />
2.1<br />
1.6<br />
3.8<br />
1.9<br />
1.9<br />
2.4<br />
39
Percentage<br />
The number of housing units using flush toilets also<br />
had declined by nearly 9 percent. As a consequence the<br />
relative share of this facility declined by nearly 2 percentage<br />
points to 4.8 percent. However, the number of<br />
water sealed toilets nearly doubled between 1971 and<br />
1981. (Figure 322). In the urban sector the number of<br />
bucket toilets had declined from 81,000 to 42,000, and<br />
the percentage share of this type in all sectors declined<br />
nationwide to only 1.9 percent. Figure 3.23 shows the<br />
wide variation in the different types of toilets in use and<br />
the variations in districts. Outside Colombo the proportion<br />
of flush toilets is relatively small, with Jaffna<br />
having 8 percent and Kandy 5.5 percent. Water sealed<br />
toilets are more evenly distributed. Pit toilets, however,<br />
remain the most widely used toilet while the bucket is<br />
becoming obsolete. The percentage of housing units<br />
which lack any toilets has been exceedingly high. In<br />
districts such as Mannar, Vavuniya, Mullaitivu,<br />
Batticaloa, Ampara and Trincomalee, more than twothirds<br />
of the housing lacked toilet facilities.<br />
POPULATION AND DOMESTIC<br />
FOOD PRODUCTION<br />
Sri Lanka's traditionally dominant agricultural sector<br />
has largely produced tea, rubber and coconut products<br />
for export, while food imports used a major part of<br />
the export earnings. Recognizing the cost of feeding a<br />
POPULATION PR<strong>OF</strong>ILE<br />
Occupied Housing Units by Type of Toilet<br />
by Sector 1971 - 1981<br />
1971 1981 1971 1981 1971 1981<br />
Urban Rural Estate<br />
) Flush ES3 Water Seal H Pit EZ3 Bucket S3 No Toilet<br />
Figure 3.22<br />
I<br />
I<br />
I<br />
I<br />
I<br />
I<br />
I<br />
I<br />
I<br />
I<br />
growing population, policies since the 1930s have encouraged<br />
development of croplands in the Dry Zone, I<br />
through irrigation and peasant settlements. •*<br />
Between 1946 and 1962 162,0004 hectares of new<br />
land were cultivated, and another 147,800 hectares developed<br />
for agriculture between 1962 and 1973. Agricultural<br />
land increased by 18 percent over this period,<br />
raising agricultural croplands from 26.0 percent to 31.5<br />
percent of the country's total land area. The scale of<br />
new land development slowed after 1973, but the area<br />
developed for paddy alone between 1973 and 1986<br />
amounted to 134,500 hectares. Cultivated land now<br />
increases by 10,100 hectares per year.<br />
The agricultural sector still contributes as much as<br />
22.4 percent of the national product and 45.0 percent<br />
of total employment. These figures would be even<br />
higher if they included industries dependent on agricultural<br />
raw material.<br />
Information on land availability and agricultural<br />
production has been canvassed through a series of<br />
agricultural censuses in 1946,1962,1973, and 1982, with<br />
the next census planned for 1992. In 1946 agricultural<br />
lands totalled 1.727 million hectares. They increased to<br />
2.037 million hectares by 1973. Because of under-enumeration<br />
of agricultural lands, particularly paddy<br />
I<br />
I<br />
I<br />
I<br />
I<br />
I<br />
I<br />
I<br />
I<br />
I
I<br />
I<br />
i<br />
i<br />
i<br />
i<br />
i<br />
i<br />
i<br />
i<br />
I<br />
i<br />
i<br />
i<br />
i<br />
i<br />
i<br />
i<br />
i<br />
i<br />
i<br />
i<br />
Percentage<br />
100<br />
Colombo<br />
E=3 Fluth Toilet<br />
EZ3 Bucket<br />
POPULATION PR<strong>OF</strong>ILE 41<br />
Occupied Housing Units by Type of<br />
Toilet Facilities & District 1981<br />
Kandy Gall«<br />
Diatrieta<br />
ES Watar Toilet<br />
529 Nona<br />
fields, at the Census of Agriculture 1982, that census<br />
did not disclose the growth of agricultural land during<br />
the intercensal period.<br />
The extent of agricultural land ascertained in the<br />
1946,1973 and 1982 censuses and agricultural land per<br />
capita in 1982 are given in Figure 3.24. Average agricultural<br />
land availability has been 0.13 hectare per<br />
person for the country as a whole. In the predominantly<br />
agricultural districts of the Dry Zone the agricultural<br />
land availability varied between 0.16 hectare per person<br />
to a maximum of 0.28 hhectare per person in Vavuniya.<br />
In densely populated areas such as Gampaha and<br />
Jaffna it declined to about 0.06 hectare per person.<br />
Current distribution and use patterns of agricultural<br />
lands by crop are displayed bellow.<br />
Crop<br />
Tea<br />
Rubber<br />
Coconut<br />
Other permanent crops<br />
Paddy<br />
Highland temporary crops<br />
Total<br />
Hectare»<br />
222,700<br />
242,900<br />
415.000<br />
176,100<br />
729,900<br />
253,000<br />
2,037,600<br />
Rgure 3.23<br />
Jaffna Battlealoa<br />
mm pit<br />
CD Not 3tated<br />
Plantation crop lands have not increased, but<br />
paddy increased from 390300 hectares in 19S2 to<br />
727,900 hectares in 198S. It accounts for, about 11<br />
percent óf the total land area, and 35 percent of the total<br />
cultivated area. Production also increased from<br />
595,000 metric tons to a maximum of 2,661,000 metric<br />
tons. A considerable part of this increase resulted from<br />
improved productivity.<br />
Lands devoted to other cereals, pulses, roots and<br />
tubers and other annuals total approximately 253,000<br />
hectares. Although much of the cultivation is rainfed<br />
and yields are low, productivity can improve substantially.<br />
About 90 percent self-sufficiency, has been<br />
achieved for rice. Barring major droughts, if Sri Lanka<br />
maintains its recent productivity gains, it should meet<br />
the increasing rice demands in the near future. Continued<br />
imports of wheat flour will be necessary in the<br />
medium term at current levels. Substantial expansion<br />
of sugar acreage will be required to meet rising demands<br />
without increased imports.<br />
Projections for food requirements show that the<br />
calorie availability needs from vegetables and fruits<br />
have not been met and that demand for these items will<br />
be about 25 percent above current supply by the end of<br />
the century. Per capita calorie, protein, and fat supplies<br />
have slowly improved over the past decade despite
42 POPULATION PR<strong>OF</strong>ILE<br />
Rapid Urbanization In Sri Lanka: Implications<br />
and Challenges<br />
Rapid growth of the Colombo Urban Area (CUA), with a currently estimated population of 1.6<br />
million, has gravely concerned local authorities. Fourteen local authorities make up the CUA: two<br />
municipal councils (Colombo and Dehiwela-Mount Lavinia), five Urban Councils (Kotte, Moratuwa,<br />
Kolonnawa, Peliyagoda and Wattala-Mabole) and the seven Town Councils (Maharagama, Battaramulla,<br />
Kotikawatta, MuUeriyawa, Kelaniya, Dalugama and Hendala). Each authority functioned as a distinctly<br />
individual entity until about twenty years ago. Now the CUA has grown so as to fuse each local authority<br />
with the others. An array of new social, economic and environmental problems has arisen from this high<br />
concentration of urban poverty, overloading the urban sewer, water and drainage infrastructure.<br />
The annual rate of growth of urban population for all of Sri Lanka declineddramatically to L2 percent<br />
between 1971 and 1981 — down from 62 percent and 5.1 percent during the previous two periods,<br />
1953-1963 and 1963-1971 respectively. However, phenomenal growth rates were recorded during the<br />
1971-1981 period by a majority of local authorities in the CUA — Moratuwa (40 percent), Battaramulla<br />
(27.8 percent), Hendäla (24.5 percent), Maharagama (192 percent), Kelaniya (12.4 percent), Dalugama<br />
(12.1 percent), Wattala-Mabole (10.6 percent) and Kotikawatta (102 percent)^ Further,.while the density!<br />
for all of Sri Lanka was only 230 persons/sqJan, density for the CUA was7,844persons/sqJani and 15,9174"<br />
persons/sqJcm for the Colombo Municipal Council. ' V -<br />
The physical consequences of such rapid, urban growth include sub-standard shelter, improper <strong>OF</strong><br />
inadequate water supply, unhygienic toilet facilities, undesirable and unsanitary solid waste disposal, and<br />
gradual elimination of a network of storm water basins.<br />
Shelter<br />
The acute shelter problems, like other urbanization problems, are mostly confined to Colombo's<br />
shanty and slum settlements. With nearly 50 percent (or 65,000 households) of the Colombo Municipal<br />
Council area's population cramped in. such settlements, the urban housing: component of the Million<br />
Houses Programme, launched by the government in 1984, was aimed at rehabilitating these settlements.<br />
Shelters in these settlements are overcrowded and built of improvised material on marginal, usually flood<br />
prone land, Occupants typically lack legal rights to the land they occupy.<br />
Through the Million Houses Programme (MHP), families ia shanty and slum settlements have been<br />
given legal tenure to the land, along with loans of up to 15,000 rupees to improve their shelter through *<br />
Housing Optio» Loans Package (HOLP). As of August 1988; nearly 30#00shanty families had benefited<br />
from the Million Houses Programme. . -<br />
To overcome acute shortage of land, especially for low-income housing, the government reduced the<br />
minimum size of plots for residential development from 303 to 152 square meters, and in some spécial<br />
cases to 51 square meters. The resulting increase in spot densities has strained the infrastructure to its<br />
limits andJócar officials have found themselves unable to controi,illegal and unauthorized construction^<br />
usually extensions for cooking, areas, which; due to restrictedspacev often abut toilets* cattle sheds, or<br />
poultry runs in the adjoining plot. The result of these uiiauthonzedstnicture» »unhygienic cooking;<br />
I<br />
I<br />
I
I<br />
I<br />
I<br />
I<br />
I<br />
I<br />
I<br />
i i<br />
11<br />
Water Supply and Sanitation<br />
POPULATION PR<strong>OF</strong>ILE 43<br />
As shanty and slum improvement schemes increase so does demand for water supply. Rehabilitation<br />
settlements therefore have posed a challenge to the National Water Supply and Drainage Board<br />
(NWS&DB). Existing supply lines are already overloaded and new supply now appears feasible only by<br />
tapping ground water where the quality is found suitable for human consumption. Collection of rain water<br />
is also being explored.<br />
Rising Risk of Water Pollution<br />
In the Colombo District in 1981 about 37 percent a» *e approximately 272^00 housing units had<br />
either pit toilets (24 percent), bucket toilets or none at -m* Afcout half (52 percent) of all housing units<br />
had piped water, and over a third (37.8 percent) had pmaecferi wells. About 10 percent of the housing<br />
units used shallow wells highly susceptible to domestic i mil Mniilinii. or they used untreated river water<br />
or other sources. At 5.48 persons per unit - the average urbaafcousehold size in 1981/1982 - some 150,000<br />
residents in the Colombo Distria were at potentially high risk of contracting some waterborne disease<br />
from water contamination. Today, assuming no change in the percentage of people who use unprotected<br />
water, this high risk group may have increased by more than 20,000 because of Colombo's growing urban<br />
population; Numbers at risk will be higher still if piped water or protected well water becomes contaminated.<br />
Only 375,000 in Colombo are served by sewers.<br />
Conditions in the Gampaha District are potentially more serious. About 60 percent of the 266,000<br />
housing units had pit toilets (43.8 percent), bucket types, or none (14.8 percent). Of these units, 9 percent<br />
received piped water, 66 percent used protected wells, and the remaining 25 percent used unprotected<br />
wells, rivers and other sources. This means about 364,000 people were at high risk from contaminated<br />
water in 198L Today there are about 400,000.<br />
If Colombo and other urban areas increase their growth rate over the next ten years as forecast, water<br />
pollution problems will obviously grow more serious unless there is significant new investment in urban<br />
water and sanitation infrastructure.<br />
In local authorities where wells are the sole source of drinking water, the building of septic tanks<br />
within a 152 - square meter plot hits a snag: by-laws require septic tanks to be 1525 meters away from a<br />
well, whether one's own or a neighbors,, in order to prevent contamination. Several surveys have shown<br />
that these by-laws are not strictly obeyed.<br />
The local authorities along the sea coast face a peculiar problem arising from persistent rural habits<br />
unsuited to urban- settlement. Squatters encroaching on sea coast reservations are in the practice of<br />
relieving themselves directly on the beach. The excreta, washed away by the sea, resurface and pollute<br />
other beaches, some of which are frequented by tourists. Providing these settlements with any form of<br />
toilet has not yet proved effective.<br />
Solid Waste Collection and Disposal<br />
Domestic garbage disposal requires urgent attention in the CUA. In most parts of the CUA garbage<br />
is either collected by "hand carters" from residences and pfled at central collection points or households<br />
are expected to bring their garbage to these points. The collected garbage remains for a number of days,<br />
polluting the environment and inviting rats and dogs, as wdfaucavenging by the poor, until garbage trucks<br />
take it away for disposal, usually dumping in marshy Ian* atmy from residential areas.
44<br />
POPULATION PR<strong>OF</strong>ILE<br />
Safe andiconvenient disposal sites, however, have become increasingly scarce; As a result, the whole<br />
process of garbage collection and disposal has become inefficient; garbage piled at temporary locations<br />
often remains unattended for a considerable period, causing a nuisance and health hazard to residents.<br />
With rising urban population and garbage output estimated at 470 tons per day by 1992, cost effective<br />
alternatives to present garbage collection and disposal systems have become an urgent need.<br />
Elimination of Storm Water Basins<br />
Skyrocketing urban, land prices force low and middle income Households to seek cheaper residential<br />
lands away from the dty center. One direct result is the Glling of marshy land for residential development.<br />
A network of such marshy land within the CUA has served as a natural drainage system for storm waters.<br />
With the filling in of these storm water basins — over 200 hectares by the Sri' Lanka Reclamation and<br />
Development Corporation alone since 1968 storm drainage malfunctions are causing floods in most of<br />
the low-lying areas within the CUA. In the absence of a clear policy to maintain these storm water basins,<br />
local authorities have no alternative but to approve applications for fillmg; by developers-or individual<br />
house builders. "• '"''•• '.'"'"; ••• Ä ^--/^ %<br />
problems of equitable distribution to low income<br />
groups.<br />
LABOR SUPPLY<br />
Population censuses and labor force surveys conducted<br />
since Independence have shown rapid growth<br />
in Sri Lanka's labor force. It increased from 2.6 million<br />
in 1946 to 3.4 in 1963, to 45 million in 1971 and reached<br />
5.9 million in 1985 (See Figure 325). Annual rates of<br />
growth during this span:<br />
1946 • 1953 . 2.1 percent<br />
1946 • 1971 2.7 percent<br />
1946-1985 2.1 percent<br />
1963-1971 3.3 percent<br />
1971-1981 Z5 percent<br />
1971 -1985 2.1 percent<br />
Between 1963 and 1981 growth rates were particularly<br />
high, exceeding Z5 percent per year, and higher<br />
than the growth rate of the total population. This rate<br />
of growth in the labor force is unlikely to decline below<br />
2.0 percent in the short and medium term because new<br />
entrants to the workforce over the next fifteen to twenty<br />
years have already been born. A decline could occur<br />
only through a substantial increase of external migration.<br />
Population of Working Age<br />
Analyses of the labor force usually consider age<br />
group 15-59 years as the population of working age,<br />
with those outside this range being young dependents<br />
or elderly. Recent census and labor force surveys can-<br />
vassed the employment status of persons above 10<br />
years. Some earlier surveys even canvassed the next<br />
lower age group of 5-9 years because of the prevalence<br />
of child labor. Child labor exists, but it has declined in<br />
magnitude and as a percentage of the total labor force.<br />
At the 1981 Census child workers in the age group 10-14<br />
years totalled 8,975 - including 5,840 males and 3,135<br />
females.<br />
With longer life expectancy the economically ac-<br />
tive population above 60 years has increased, and this<br />
trend will continue. The working-age population will<br />
increase from 8.677 million in 1981 to an estimated<br />
10.593 million by 1991. By 2001 it will increase by 23<br />
million to 12325 million — 47.8 percent higher than in<br />
1981. Between 2001 and 2011 its size will increase again<br />
by 13 million to 14.189 million, but thereafter working-<br />
age population will increase only marginally, reaching<br />
I<br />
I<br />
I<br />
I<br />
I<br />
I<br />
I<br />
I<br />
I<br />
I<br />
I<br />
I<br />
I<br />
I<br />
I<br />
I<br />
I<br />
I<br />
I<br />
I<br />
I
I<br />
I<br />
I<br />
I<br />
I<br />
I<br />
I<br />
I<br />
I<br />
I<br />
I<br />
I<br />
I I<br />
I<br />
I<br />
I<br />
I<br />
I<br />
I<br />
I<br />
a maximum of nearly 15 million in 2036. Net additions<br />
to the population of working age over the next 20 years<br />
will be about 0.9-1.0 million in each quinquennial period<br />
between 1986 and 2OO6.These are critical figures.<br />
They show the significant future additions to the labor<br />
force and the magnitude of the employment task ahead.<br />
The number of working-age people will increase<br />
until 2036, but after 2006 their relative share will decline<br />
from 65.01 percent to 59.44 percent, while the share of<br />
elderly will increase. Issues of old age dependency and<br />
health care are likely to become increasingly significant<br />
during this period. Higher life expectancy and consequent<br />
larger cohorts in older age groups will affect the<br />
internal composition of the productive population. The<br />
working population will become increasingly older.,<br />
the male share will decline in relation to the female<br />
share.<br />
Employment by Industry Sectors<br />
Data on the distribution of employment by industrial<br />
sector, ascertained through cross section surveys,<br />
show how the industrial composition of the workforce<br />
has changed over time (Figure 3.26). Structural<br />
changes in the economy have been slow, with the agriculture<br />
sector remaining large and absorbing as much<br />
as one-half of the employed population. The proportion<br />
dependent on agriculture, approximately 53 percent<br />
in 1953, declined only 4 percent to 49 percent by<br />
1985.<br />
Over this period agriculture absorbed approximately<br />
1 million persons, but its the slow growth rate<br />
of around 1.5 percent per year, compared to annual<br />
increases of over 2 percent per year in the labor force<br />
and the total population, resulted in a large pool of<br />
surplus labor. Agriculture could absorb only about<br />
one-third of the growing increment in labor supply,<br />
which averaged between 100,000 and 125,000 per year.<br />
Unfortunately, manufacturing sector employment<br />
could not take up the slack. It grew from 290,000 in<br />
1953 to 650,000 by 1985, increasing its share from 9<br />
percent to 123 percent. Slow growth of this sector did<br />
not keep pace with the increasing number of educated<br />
and skilled men and women in the workforce, nor were<br />
other sectors able to do so.<br />
POPULATION PR<strong>OF</strong>ILE 45<br />
Occupational Distribution<br />
Slow structural changes in the economy are reflected<br />
in the relatively small shifts from agriculture and<br />
related work to professional, technical, production and<br />
related service employment. Thus the number of agricultural<br />
workers declined by 4 percent between 1953<br />
and 1985, and the share of professional workers increased<br />
only marginally, by about 1.5 percent. Classification<br />
problems prevent extensive comparisons<br />
between the 1953 and subsequent surveys, but Figure<br />
3.27 shows that the share of production process workers<br />
increased from 23 percent to about 28 percent between<br />
1963 and 1985. During this time these occupations<br />
absorbed approximately 700,000 net additions. Only<br />
modest shifts occurred in occupational distribution.<br />
Future population trends, labor force growth, and<br />
the rising share of people with educational and other<br />
skills require shifts towards employment in manufacturing,<br />
agricultural processes and industries, and professional,<br />
technical, and service occupations. Creation<br />
of new jobs will not suffice; new employment opportunities<br />
must match a higher skills profile.<br />
The labor force estimated at 5.563 million in 1980<br />
and 6.395 million in 1986 grew at an average rate of<br />
138,600 per year. By 2001, the projected labor force of<br />
8.78 million will comprise 5.97 million males and 2.81<br />
million females, with an average annual increase of<br />
159,000 by increments of 105,000 males and 53,500<br />
females. By 2016 the labor force will increase by a<br />
further 22. million, an average of 148,000 per year from<br />
2002-2016, to nearly 11 million, comprising 7.11 million<br />
males and 3.89 million females. Most significant is the<br />
acceleration of female entry into the workforce. The<br />
female net additions to the workforce should increase<br />
from about 50,000 in the 1990s to nearly 70,000 in the<br />
first 15 years of the twenty-first century. New additions<br />
to the workforce will have higher educational attainments<br />
and better skills than those leaving it.<br />
Employment Growth Required to<br />
Match Labor Supply<br />
An intractable problem in the country during the<br />
past three decades has been youth unemployment and<br />
the need to increase productive employment for new<br />
members of the workforce. Although about 175,000-
46<br />
POPULATION PR<strong>OF</strong>ILE<br />
Province/District<br />
Sri Lanka<br />
Western Province.<br />
Colombo<br />
Gampaha<br />
Kalutara<br />
Central Province.<br />
Kandy<br />
Matale<br />
Nuwara Eliya<br />
Southern Province.<br />
Galle<br />
Matara<br />
Hambantota<br />
Northern Province.<br />
Jaffna<br />
Mannar<br />
Vavuniya<br />
Mullaitivu<br />
Eastern Province.<br />
Batticaloa<br />
Ampara<br />
Trincomalee<br />
North Western Province<br />
Kurunegala<br />
Puttalam<br />
North Central Province<br />
Anuradhapura<br />
Polonnaruwa<br />
Uva Province.<br />
Badulla<br />
Moneragala<br />
Sabaragamuwa Province<br />
Ratn apura<br />
Kegalle<br />
Pop.<br />
Number<br />
14,846,750<br />
3.919,807<br />
1,699,241<br />
1,390,862<br />
829,704<br />
2,009,248<br />
1,048,317<br />
357,354<br />
603,577<br />
1,882,661<br />
814,531<br />
643,786<br />
424,344<br />
1.109.404<br />
830,552<br />
106.235<br />
95.428<br />
77.189<br />
975,251<br />
330,333<br />
388.970<br />
255.948<br />
1.704.334<br />
1.211,801<br />
492,533<br />
849,492<br />
587,929<br />
261,563<br />
914,522<br />
640,952<br />
273,570<br />
1,482,030<br />
797,087<br />
684,944<br />
%<br />
100.0<br />
26.40<br />
11.45<br />
9.37<br />
5.59<br />
13.55<br />
7.06<br />
2.41<br />
4.07<br />
12.68<br />
5.49<br />
4.34<br />
2.86<br />
7.48<br />
5.59<br />
0.72<br />
0.64<br />
0.52<br />
6.57<br />
2.2<br />
2.62<br />
1.72<br />
11.48<br />
8.16<br />
3.32<br />
5.72<br />
3.96<br />
1.76<br />
6.16<br />
4.32<br />
1.84<br />
9.98<br />
5.36<br />
4.61<br />
Population Density<br />
Land<br />
Area<br />
(hectares)<br />
6,476.884<br />
365,927<br />
65.268<br />
139.946<br />
160,713<br />
559,236<br />
236,806<br />
199,611<br />
122,818<br />
551,579<br />
167,449<br />
124,696<br />
259,433<br />
868,923<br />
207,309<br />
200.287<br />
264,623<br />
196,704<br />
807,158<br />
246,564<br />
298,667<br />
261,927<br />
775,287<br />
477,474<br />
297,814<br />
1,062,685<br />
722.170<br />
340,515<br />
995,725<br />
281,927<br />
713,798<br />
490364<br />
324016<br />
166348<br />
Density<br />
Pop/ha<br />
1981<br />
2.30<br />
10.27<br />
26.03<br />
9.93<br />
5.16<br />
3.58<br />
4.42<br />
1.78<br />
4.92<br />
3.41<br />
4.87<br />
5.16<br />
1.63<br />
1.28<br />
4.00<br />
0.52<br />
0.37<br />
0.40<br />
1.21<br />
1.33<br />
1.31<br />
0.99<br />
2.20<br />
2.54<br />
1.65<br />
0.79<br />
0.82<br />
0.77<br />
0.91<br />
2.27<br />
0.40<br />
3.01<br />
2.47<br />
4.12<br />
Total Extent Of Agricultural Und (ha)<br />
1946<br />
172,691<br />
272,185<br />
168,715<br />
103,470<br />
300,091<br />
162.819<br />
68,088<br />
69,183<br />
235,285<br />
94,487<br />
87,503<br />
53,295<br />
90,125<br />
61,906<br />
15,283<br />
12,935<br />
80.008<br />
37,651<br />
29.860<br />
12,596<br />
313,866<br />
236.720<br />
77,146<br />
68,839<br />
53,658<br />
15,181<br />
107,657<br />
92,296<br />
15,360<br />
259637<br />
123812<br />
135825<br />
1973<br />
2.036,989<br />
269,583<br />
168,336<br />
101.248<br />
309,139<br />
174,521<br />
67,574<br />
67,043<br />
260.878<br />
98,426<br />
90.796<br />
7.165<br />
110,868<br />
57.616<br />
20.934<br />
32.317<br />
134,564<br />
46,294<br />
52,796<br />
35,475<br />
363,468<br />
274,185<br />
89.283<br />
153,378<br />
109,410<br />
43,968<br />
161,542<br />
101,972<br />
59.570<br />
273568<br />
146860<br />
126708<br />
Agricultural<br />
1982 Land /Cap. 82<br />
1,975,639<br />
234,811<br />
35,610<br />
• 95,744<br />
103,457<br />
278,457<br />
111,024<br />
69,555<br />
97,878<br />
247,830<br />
94,253<br />
80,346<br />
673,230<br />
114,677<br />
49,224<br />
18,491<br />
27,784<br />
19,177<br />
155,187<br />
50,907<br />
62,666<br />
41,614<br />
363,839<br />
274,346<br />
894,93<br />
167,053<br />
113,636<br />
53,417<br />
162,186<br />
98,218<br />
63,968<br />
250599<br />
135782<br />
114816<br />
0.13<br />
0.06<br />
0.02<br />
0.07<br />
0.13<br />
0.14<br />
0.11<br />
0.19<br />
0.16<br />
0.13<br />
0.12<br />
0.13<br />
0.17<br />
0.11<br />
0.06<br />
0.17<br />
0.29<br />
0.25<br />
0.16<br />
0.15<br />
0.16<br />
0.17<br />
0.21<br />
0.23<br />
0.18<br />
0.20<br />
0.19<br />
0.20<br />
0.18<br />
0.15<br />
0.23<br />
0.17<br />
0.17<br />
0.17<br />
Figure 3.24
I<br />
I<br />
I<br />
I<br />
I<br />
I<br />
I<br />
I<br />
I<br />
I<br />
I<br />
j •<br />
I<br />
I<br />
I<br />
I<br />
I<br />
I<br />
I<br />
1<br />
I<br />
I<br />
Title Of Survey<br />
1.<br />
2..<br />
3.<br />
4.<br />
5.<br />
6.<br />
7.<br />
8.<br />
9.<br />
10.<br />
11.<br />
Census Of<br />
Population -1946<br />
Census Of<br />
Population -1953<br />
Census Of<br />
Population -1963<br />
Labor Force<br />
Survey -1968<br />
Socio-econom ic<br />
Survey-1969/70<br />
Census Of<br />
Population -1971<br />
Survey Of Labour<br />
Force Participation<br />
Rates -1973<br />
Land And Labour<br />
Utilisation<br />
Survey-1975<br />
Consumer Finance<br />
& Socio-economic<br />
Survey -1978/79<br />
Socio-economic<br />
Survey -1980/8<br />
Census Of<br />
Population -1981<br />
Consumer Finances<br />
& Socio-economic<br />
Survey -1981/82<br />
Total<br />
2,611<br />
2,993<br />
3.464<br />
4,150<br />
4,169<br />
4,488<br />
4,560<br />
4,957<br />
5,521<br />
15,715<br />
5,105<br />
5,282<br />
POPULATION PR<strong>OF</strong>ILE 47<br />
Labour Force Estimates<br />
1946-•1986<br />
Labour Force<br />
Participation 000'<br />
Mala Female<br />
2,041<br />
2.268<br />
2.742<br />
3.156<br />
3.124<br />
3,312<br />
3,267<br />
3,490<br />
3.712<br />
4.109<br />
3,767<br />
3.843<br />
570<br />
724<br />
722<br />
984<br />
1,045<br />
1,176<br />
1,293<br />
1,467<br />
1,809<br />
1,606<br />
1,248<br />
1.439<br />
Source: Korale, R.B.M. SriLanka Economic Journal: Vol.1, No.l, 1986<br />
FIGURE 3.25<br />
Crude Participation Rat« ><br />
Total Male<br />
39.2<br />
37.0<br />
32.7<br />
34.6<br />
38.6<br />
35.4<br />
34.5<br />
36.5<br />
38.0<br />
37.3<br />
33.8<br />
34.3<br />
57.8<br />
53.1<br />
49.8<br />
50.7<br />
57.3<br />
50.7<br />
48.5<br />
50.2<br />
50.4<br />
53.1<br />
49.8<br />
49.7<br />
Female<br />
18.2<br />
18.9<br />
14.2<br />
17.2<br />
19.5<br />
19.1<br />
20.2<br />
22.1<br />
26.2<br />
21.2<br />
17.1<br />
19.4
48<br />
Sector<br />
1. Agriculture<br />
hunting, forestry<br />
& Fishing<br />
2. Mining &<br />
Quarrying<br />
3. Manufacturing<br />
4. Electricity,<br />
gas & water<br />
5. Construction<br />
6. Wholesale &<br />
retail trade<br />
7. Transport,<br />
storage &<br />
communication<br />
8. Finance,<br />
Insurance, real<br />
estates & business1<br />
services<br />
9. Community,<br />
social &<br />
personal services<br />
10. Activities not<br />
adequately<br />
described<br />
All economic<br />
activities<br />
POPUUTION PR<strong>OF</strong>ILE<br />
Distribution of Employed Population by Industry Sector<br />
Census<br />
1953<br />
1584.1<br />
(52.9)<br />
13.8<br />
(0.3)<br />
289.2<br />
(9-7)<br />
3.3<br />
(0.1)<br />
56.7<br />
(19)<br />
228.8<br />
(9.4)<br />
104.3<br />
(5.5)<br />
65.1<br />
(2.2)<br />
396.2<br />
(13.2)<br />
197.8<br />
(6.6)<br />
2993.3<br />
(100.0)<br />
(Figures in Thousands; Percentages in brackets)<br />
Census<br />
1963<br />
1681.9<br />
(52.6)<br />
9.4<br />
(0.3)<br />
292.3<br />
(9.2)<br />
7.8<br />
(0.2)<br />
85.1<br />
(2.7)<br />
349.1<br />
(10.9)<br />
137.6<br />
(4.3)<br />
15.6<br />
(0.5)<br />
440.9<br />
(13.8)<br />
175.4<br />
(5.5)<br />
3195.1<br />
(100.0)<br />
Census<br />
1971<br />
1828.9<br />
(50.1)<br />
13.1<br />
(0.4)<br />
339.4<br />
(9.3)<br />
9.6<br />
(0.3)<br />
103.6<br />
(2.8)<br />
343.8<br />
(9.4)<br />
178.9<br />
(4.9)<br />
24.9<br />
(0.7)<br />
492.8<br />
(13.5)<br />
313.9<br />
(8.6)<br />
3648.9<br />
(100.0)<br />
Figure 3.26<br />
LF&SES<br />
1980/81<br />
2293.3<br />
(47.3)<br />
63.4<br />
(13)<br />
572.0<br />
(-)<br />
19.2<br />
(0.4)<br />
216.1<br />
(-)<br />
485.8<br />
(100)<br />
202.4<br />
(4.2)<br />
52.6<br />
(1.1)<br />
644.6<br />
(13.3)<br />
301.9<br />
(6.2)<br />
4851.3<br />
(100.0)<br />
Census<br />
1981<br />
1863.8<br />
(45.2)<br />
38.6<br />
(0.9)<br />
416.8<br />
(10.1)<br />
15.2<br />
(0.4)<br />
124.8<br />
(3.9)<br />
433.3<br />
(10.5)<br />
189.8<br />
(4.8)<br />
45.5<br />
(1-1)<br />
596.7<br />
(14.5)<br />
385.8<br />
(9.4)<br />
4119.3<br />
(100.0)<br />
Consumer<br />
Finance<br />
1981/82<br />
2360.7<br />
(51.2)<br />
77.9<br />
(1.7)<br />
573.6<br />
(12.4)<br />
14.3<br />
(0.3)<br />
238.4<br />
(5.2)<br />
493.4<br />
(10.7)<br />
188.6<br />
(4.1)<br />
68.2<br />
(1.5)<br />
581.4<br />
(12.6)<br />
15.2<br />
(0.3)<br />
4610.7<br />
(100.0)<br />
LF&SES<br />
1985/86<br />
2530.9<br />
(49.3)<br />
66.7<br />
(13)<br />
648.5<br />
(12.7)<br />
21.5<br />
(0.4)<br />
226.9<br />
(4.4)<br />
513.9<br />
(10.0)<br />
220.0<br />
(4.3)<br />
65.1<br />
(1.3)<br />
631.4<br />
(12.3)<br />
206.8<br />
(0.4)<br />
5131.7<br />
(100.0)
I<br />
I<br />
I<br />
I<br />
I<br />
I<br />
I<br />
I<br />
I i ;<br />
I<br />
I i<br />
I i •<br />
I<br />
1<br />
I<br />
I<br />
I<br />
I<br />
I<br />
Major Occupation<br />
POPULATION PR<strong>OF</strong>ILE<br />
Occupational Distribution of the Employed Population 1953 -1986<br />
Professional, Technical<br />
& Related Workers<br />
Administrative &<br />
Managerial Workers<br />
Clerical & Related<br />
Workers<br />
Sales Workers<br />
Service Workers<br />
Agricultural, Animal<br />
Husbandry & Forestry<br />
Workers, Fishermen<br />
& Hunters<br />
Production & Related<br />
Workers, Transport<br />
Equipment Operators<br />
& Labourers<br />
Workers not<br />
Classified<br />
Total<br />
Census<br />
1953<br />
113.6<br />
(3.8)<br />
28.8<br />
(0.9)<br />
103.3<br />
(3.5)<br />
221.2<br />
(7.4)<br />
439.5<br />
(14.7)<br />
Census<br />
1963<br />
UZ7<br />
(4.5)<br />
32.9<br />
(1.0<br />
110.4<br />
(3.7)<br />
212.2<br />
(6.6)<br />
359.6<br />
(8.1)<br />
(In Thousands)<br />
Census<br />
1971<br />
178.5<br />
(4.9)<br />
14.0<br />
(0.4).<br />
186.1<br />
(5.1)<br />
272.4<br />
(7.5)<br />
198.0<br />
(5.4)<br />
LF&SES<br />
1980/81<br />
269.2<br />
(5.5)<br />
25.4<br />
(0.5)<br />
274.1<br />
(5-6)<br />
396.0<br />
(8.2)<br />
265.4<br />
(5.5)<br />
Consumer<br />
Finances<br />
1981/82<br />
304.1<br />
(6.5)<br />
51.4<br />
(1.1)<br />
262.0<br />
(5.6)<br />
392.9<br />
(8.4)<br />
257.3<br />
(5.5)<br />
LF & SES<br />
1985/86<br />
272.9<br />
(5.3)<br />
26.4<br />
(0.5)<br />
280.5<br />
(5.5)<br />
442.0<br />
(8.6)<br />
241.5<br />
(4.7)<br />
1536.1 1653.61782.1 2191.2 2180.0 2438.3<br />
(51.3) (51.7) (48.8) (45.2) (46.6) (47.5)<br />
488.3<br />
(16.3)<br />
62.5<br />
(2.1)<br />
2993.3<br />
(100.0)<br />
739.7<br />
(23.1)<br />
40.6<br />
(1-3)<br />
3199.7<br />
(100.0)<br />
926.4<br />
(25.4)<br />
91.5<br />
(2.5)<br />
3649.0<br />
(100.0)<br />
Figure 3.27<br />
1415.4<br />
(24.2)<br />
14.0<br />
(0.3)<br />
4851.4<br />
(100.0)<br />
996.4<br />
(21.3)<br />
235.9<br />
(5.0)<br />
4678.0<br />
(100.0)<br />
1420.9<br />
(27.7)<br />
9.2<br />
(0.2)<br />
5131.7<br />
(100.0)<br />
49
50<br />
200,000 new jobs were created from 1978-1982,<br />
economic growth has not absorbed the net additions<br />
to the workforce or reduced the backlog of unemployed.<br />
Slow economic growth during the past few<br />
years has raised unemployment from 850,000-900,000<br />
in 1982 to about 1.17 million by 1988. This backlog,<br />
added to increasing annual increments of labor supply,<br />
substantially increases the magnitude of short- or<br />
medium-term employment creation plans. Total<br />
growth of employed during the 35-year period from<br />
1946-1991 amounted to only 2.2 million. The net<br />
increase in the labor force between 1986 and 2001,<br />
plus the backlog, totals about 3.523 million. To<br />
achieve full employment by the beginning of the<br />
twenty-first century Sri Lanka will need to create an<br />
additional 225,000 job opportunities each year over<br />
the next 10-11 years.<br />
Net additions to the labor<br />
force during 1986-2001 2 363 million<br />
Backlog of unemployed 1986 M 40 million<br />
References<br />
Central Bank of Ceylon (1984). Report on consumer finances<br />
and socio-economic survey 1981/82: Sri Lanka. Colombo:<br />
the Bank. 333 pp.<br />
Ceylon, Dept. of Census and Statistics (1950). Census of Ceylon<br />
1946. Vol. 1, Part 1. General Report, Govt. Printer, Colombo.<br />
340 pp.<br />
ESCAP (1976). Population of Sri Lanka. New York: UN. 397 pp.<br />
ESCAP (1986). Dimensions of return migration in Sri Lanka, by<br />
Korale, R.M.B. et al. Returning migrant workers: exploratory<br />
studies. New York: Bangkok: UN. pp. 15-42.<br />
Korale, R.B.M. (1988). Demographic trends and projects. First<br />
Annual Sessions of the Organisation of Professional Associations<br />
- Sri Lanka in the Year 2015. 6-9 Oct. 1988. Colombo.<br />
37 pp.<br />
Korale, R.M.B. et al. (1989). A statistical overview of employment<br />
and unemployment trends. Inst. of Policy Studies, Colombo.<br />
60 pp.<br />
Korale, R.M.Betal. (1983). Manpower: data sources, utilization<br />
trends and prospects in Sri Lanka. Ministry of Plan Implementation,<br />
Colombo. 168 pp.<br />
Marga Institute (1986). Housing development in Sri Lanka 1971-<br />
1981. Marga, Colombo. 303 pp.<br />
POPULATION PR<strong>OF</strong>ILE<br />
Less unemployed residual<br />
of 5 percent in 2001<br />
. Average annual rate of<br />
employment creation 1986-2001<br />
3,523 million<br />
0.439 million<br />
3,084 million<br />
205,000<br />
In the future the average number of new jobs<br />
must be higher than the estimated 205,000 per year<br />
bec~*se it has not been possible to achieve this level<br />
of ne - employment during the past few years. With<br />
the —Jed backlog the average is closer to 225,000 per<br />
year.<br />
Based on past experience, meeting this target will<br />
be a formidable task. It will require careful planning<br />
and implementation of chosen employment generalion<br />
strategies that can make up shortfalls in any year<br />
when job creation lags. Strategies will need to include<br />
geographical dispersal of industries, and sites and<br />
processes that protect Sri Lanka's environment and<br />
natural resources.<br />
Sri Lanka, Dept. of Census and Statistics (1980). Census of<br />
Agriculture 1973, Sri Lanka: General Report. Colombo. 100<br />
PP-<br />
Sri Lanka, Dept. of Census and Statistics (1986). Census of<br />
Agriculture 1982: General Report. Colombo. 200 pp.<br />
Sri Lanka, Dept. of Census and Statistics (1986). Census of<br />
Population 1963: All Island Tables. Colombo. 240 pp.<br />
Sri Lanka, Dept. of Census and Statistics (1977). Census of<br />
Population 1971. General Report. Colombo. 200 pp.<br />
Sri Lanka, Dept. of Census and Statistics (1986). Census of<br />
Population and Housing 1981: Vol. 3. General Report.<br />
Ministry of Plan Implementation, Colombo 300 pp.<br />
Sri Lanka, Dept. of Census and Statistics (1986). Census of<br />
Population and Housing 1981: Vol. 2. Part III: Housing. All<br />
Island Tables. Ministry of Plan Implementation. Colombo.<br />
56 pp.<br />
Sri Lanka, Dept. of Census and Statistics (1987). Labour Force<br />
and Socio-Economic Survey 1985/86: Sri Lanka. Preliminary<br />
Report. Ministry of Plan Implementation. Colombo.<br />
300 pp<br />
UN Dept of Economic and Social Affairs (1973). Manuals on<br />
mewtods of estimating population. Manual VII: Methods of<br />
projecting households and families. UN, New York. 100 pp.<br />
I<br />
I<br />
I<br />
I<br />
I<br />
I<br />
I<br />
I<br />
I<br />
I<br />
I<br />
I<br />
I<br />
I<br />
I<br />
I<br />
I<br />
I<br />
I<br />
I<br />
I
I<br />
I<br />
I i<br />
! '<br />
1<br />
I i<br />
It<br />
I<br />
I<br />
I<br />
I<br />
I<br />
I<br />
I<br />
I<br />
POPULATION PR<strong>OF</strong>ILE 51<br />
' UN oept. of Economic and Social Affairs (1973). Manuals on UN Oept. of Economic and Social Affairs (1989). Handbook on<br />
g Methods of estimating population. Manual VIII: Methodsof ^ ^ "^«"o«- UN. New York. 154 pp.<br />
J projections of urban and rural population. UN, New York. Wof|d ^ (1988) Wof|d Development Report. Oxford Univ.<br />
I<br />
125 pp. Press. New York. 307 pp.
A typical small market serving Sri Lankan consumers.<br />
I<br />
I<br />
I<br />
I<br />
I<br />
I<br />
I<br />
I<br />
I<br />
I<br />
I<br />
I<br />
I<br />
I<br />
I<br />
I<br />
I<br />
I<br />
I<br />
I<br />
I
I<br />
I<br />
I<br />
I I<br />
I<br />
I<br />
I<br />
\<br />
I<br />
t<br />
I !<br />
I<br />
I<br />
I<br />
I<br />
4 Economic Conditions and Trends<br />
Sri Lanka is one of the poorest countries in the<br />
world, with a per capita income of US $375 (Rs.11,939)<br />
in 1988 (Central Bank of Sri Lanka 1988). Like many<br />
other developing nations it faces chronic economic<br />
difficulties, despite a still promising natural resource<br />
base. In 1960 Sri Lanka was more prosperous than<br />
South Korea, and in 1970 more prosperous than Taiwan<br />
(Buultjens, 1990), but 40 years after Independence it<br />
suffers from unemployment, inflation and poverty, inadequate<br />
managerial capacity.<br />
Deforestation, land degradation, soil erosion, pollution<br />
and other environmental stresses add new dimensions<br />
to these economic problems because<br />
productive, sustainable environmental systems can no<br />
longer be assumed. To achieve sustainable development,<br />
Sri Lanka must integrate economic thinking into<br />
its environmental policies, and vice versa.<br />
This brief economic profile of Sri Lanka since<br />
Independence describes the effects of global and national<br />
economic changes on Sri Lanka's society, economy,<br />
government policy, and natural resources. These<br />
effects can be measured by data on capital investment,<br />
income generation, employment creation and increases<br />
in output. Yet such economic information does not<br />
necessarily help us understand the environmental effects<br />
of economic changes and actions, and how these<br />
environn. ^ntal impacts affect prospects for sustainable<br />
economic development<br />
Economists and environmentalists increasingly<br />
recognize how misleading it can be when any economic<br />
investment is considered a contribution to economic<br />
growth, regardless of whether it enhances or degrades<br />
the environment. Traditional systems of national economic<br />
accounting have not become adequately developed<br />
to capture the total benefits and costs associated<br />
with investment decisions. Total benefits and costs<br />
include not only the tangible and market components<br />
of inputs and outputs but also the intangible and nonmarket<br />
components. Economists in many countries are<br />
working on ways to improve existing national accounting<br />
methods, but until we develop better systems and<br />
far better information to feed into them, we must make<br />
decisions based on the imperfect data and analyses<br />
available.<br />
HISTORICAL BACKGROUND<br />
The Sri Lankan economy of the 1950s and 1960s<br />
depended primarily on export-oriented commercial<br />
plantations of tea, rubber, and coconut. In the rural<br />
subsistence sector cultivation of paddy and other subsidiary<br />
food crops became increasingly important; no<br />
significant manufacturing existed prior to 1950. In the<br />
early 1950s, the outbreak of the Korean War stimulated<br />
the Rubber Boom, coupled with the Tea Boom a few<br />
years later. As a result Sri Lanka enjoyed balance of<br />
payments surpluses. Because no severe economic or<br />
social problems erupted, policy makers neglected the<br />
importance of economic diversification or shifts to industrialization.<br />
Favorable economic conditions did not continue.<br />
By the late 1950s Sri Lanka experienced a deteriorating<br />
balance of payments and new problems of unemployment<br />
and failure to earn sufficient foreign exchange to<br />
purchase food and other commodities. To overcome<br />
these problems the government established several agricultural<br />
projects and various industrial ventures<br />
under its direct patronage and supervision.<br />
Successive governments maintained the primary<br />
objective of self-sufficiency in food, especially in rice<br />
production. Wherever possible, most governments<br />
sought to increase the industry's role in the national<br />
economy, and they encouraged land settlement in the<br />
Dry Zone to reduce unemployment and population<br />
pressure in urban areas and to increase food production.<br />
Sri Lanka's five year plan introduced in 1971 may<br />
be considered the peak of these inward-oriented<br />
53
54 Economies<br />
growth policies in Sri Lanka. Import substitution and<br />
export expansion were the primary means to achieve<br />
economic growth. The government exercized vast control<br />
over economic activities. Most industries were<br />
government-operated monopolies. New public corporations<br />
took over production of steel, cement, sugar,<br />
fertilizer, refined petroleum, plywood, leather, mineral<br />
sands and paper. By the mid 1970s such parastatal<br />
corporations carried out most trade and distribution<br />
activities.<br />
Continuous deterioration of the balance of payments<br />
position and other macro-economic problems<br />
required decision makers to initiate an extensive import<br />
control program while introducing import licences for<br />
most non-essential commodities. They introduced<br />
price controls which, by the early 1970s, included more<br />
than 6,000 articles. Since 1968 the government has<br />
implemented a dual exchange rate system to provide<br />
incentives for export diversification and disincentives<br />
for imports of non-essential consumer goods. It also<br />
established a concessionary tariff policy favoring import<br />
of machinery, equipment, and raw materials.<br />
Although these policies restricted consumer freedom,<br />
they helped increase industrial production and<br />
changed Sri Lanka's economic structure. Low tariffs<br />
for imported capital equipment and raw materials<br />
made local production for local markets artificially<br />
cost-effective. Nevertheless, foreign reserves continued<br />
to decline, and the current account deficit in the<br />
balance of payments stood at 350 million rupees (59<br />
million U.S. dollars) in 1970. " The government also<br />
nationalized the privately-owned transport, oil, insurance<br />
and banking businesses in the 1960s, and tree crop<br />
plantations in the early 1970s. It also limited private<br />
ownership of land to 50 acres per person. Public sector<br />
economic intervention continued and gradually increased<br />
until November 1977.<br />
That year marked the transition to economic liberalization<br />
in Sri Lanka. The new government began<br />
establishing market-oriented policies and took keen<br />
interest in introducing supply side economic policies.<br />
Some of the major policies implemented in this direction:<br />
setting the exchange rate at more realistic levels;<br />
• reducing controls on foreign exchange transai<br />
dons;<br />
I<br />
I<br />
1<br />
I<br />
• liberalizing trade and encouraging foreign invest^<br />
ments;<br />
» privatizing industries and increasing economic efB<br />
fidency,<br />
•• reducing budgetary burdens of the government, fl<br />
Liberalization and macro-economic structural<br />
changes brought substantial improvements in the proM<br />
auction and financial sectors. The industries sectoj<br />
had operated far below capacity because foreign exchange<br />
shortages inhibited import of spare parts an^<br />
raw materials. Capacity use in the industries sector ;<br />
a whole increased from 54 percent in 1975 to 75 percent<br />
in 1984. New Free Trade Zones, the Greater Colomb*<br />
Economic Commission, and introduction of export in|<br />
centives helped attract direct foreign investment in<br />
export-oriented manufacturing industries. With h ithesB<br />
measures total industrial exports have increased IsigniV sig<br />
icantly.<br />
Benefits to the financial sector were more promfl<br />
nent; it became one of the fastest growing sectors of the<br />
economy. Interest rates were allowed to fluctuate M<br />
accordance with market conditions. In general, thesB<br />
rates were positive in real terms. New foreign banks<br />
were allowed to operate in the economy, increasing th<br />
number of foreign banks in Colombo to 20. Foreig<br />
Currency Banking Units, which operated as subsidiaries<br />
of commercial banks, were allowed transactions ifl<br />
foreign currency with non-resident enterprises, such ;<br />
those established in the Free Trade Zones, and they<br />
could accept foreign currency deposits from non-re<br />
dents, notably Sri Lankans working abroad. The gc<br />
ernment also opened the non-banking finance market<br />
to the private sector with or without foreign participé<br />
tion. m<br />
With these positive trends came several unfavoia<br />
able developments. First, the economy was unable wÊ<br />
increase its domestic rate of savings. The resource gap<br />
between savings and needs for investment had to \m<br />
filled through foreign borrowing, which increased ttfl<br />
debt service burden on the economy. The overall debt<br />
I<br />
I
I<br />
I<br />
I<br />
I<br />
I<br />
II :<br />
I<br />
I<br />
service ratio increased; in 1988 debt reached 28 percent<br />
f total export earnings and remittances from abroad.<br />
Budget and balance of payment deficits also rose at<br />
increasing rates. The budget deficit -- less than 10<br />
percent of GDP in the early 1970s - increased to almost<br />
20 percent of GDP in 1982. It dropped to 10 percent<br />
in 1984 but increased again to 20 percent of GDP in<br />
1988. The current account deficit of the balance of<br />
payments, which stood at 20 percent of GDP in 1970<br />
increased to almost 12 percent of GDP in 1982. In the<br />
late 1980s it reached a manageable level of 5-6 percent.<br />
The second problem was that government had to<br />
borrow to meet local and foreign expenditure obliga-<br />
tions. Total government debt, around 75 percent of<br />
GDP in 1970, surpassed the total GDP in 1988 and<br />
reached 108 percent of GDP in 1989. Foreign debt,<br />
only 20 percent of the total public debt in 1970, in-<br />
creased to approximately 57 percent in 1989 — almost<br />
a threefold increase within 20 years.<br />
The economy experienced its worst conditions in<br />
1987, when the growth of GDP was only 1.5 percent.<br />
Despite some improvements in 1988, the economy<br />
achieved only marginal improvements to attain growth<br />
of 2.7 percent. Ethnic problems after 1983 and civil<br />
disturbances after 1987 caused severe disruption of<br />
social and economic life. Work stoppages and disrup-<br />
tions to transport, communications, banking and finan-<br />
cial services became almost routine, and they reduced<br />
or crippled production and distribution activities. As a<br />
result government revenue decreased from 21.2 per-<br />
cent of GDP in 1987 to 18.9 percent in 1988. Increased<br />
defense and other consumption expenditures helped to<br />
raise the budget deficit in 1988 to 15 percent of GDP -<br />
the highest level since 1982. The government then had<br />
no alternative but to finance its deficit through com-<br />
mercial borrowing. The rate of inflation also was high<br />
at about 14 percent in 1988 - highest since 1983. If the<br />
government had not drawn down its foreign exchange<br />
reserves to support imports and increase the supply of<br />
food and other essential commodities, inflationary<br />
pressures would have been still higher.<br />
Economics 55<br />
RESOURCE AVAILABILITY AND<br />
PERFORMANCE IN<br />
THE ECONOMY<br />
Gross Domestic Product<br />
From 1965-1977, the Sri Lankan economy grew at<br />
an average annual rate of 4.0 percent. This was comparatively<br />
higher than the average annual rate of growth<br />
of 3.1 percent achieved by the "low income countries"<br />
(excluding China and India) during the same period.<br />
Growth from 1987-1989 was approximately 4.9 percent<br />
per annum, compared to growth of 2.9 percent<br />
achieved by low income countries (World Bank, 1988).<br />
Aided by the open economic policies' adopted in<br />
1977, the 4.2 percent growth in 1977 almost doubled to<br />
8.2 percent in 1978. It continued to improve up to 1987<br />
despite the ethnic problems in the country of 1983. In<br />
1987 the GDP growth rate reached the lowest level of<br />
1.5 percent, resulting in a negative growth of real per<br />
capita GDP due to severe civil unrest. (Figure 4.1).<br />
Ethnic conflicts in the north and the east, civil disturbances<br />
in the south, and bad weather conditions experienced<br />
throughout the country over three consecutive<br />
years were the primary reasons for the poor economic<br />
performance during the period of 1987-1989.<br />
Sectoral Contribution: Agriculture<br />
The share of the major economic sectors in the<br />
composition of GDP and their growth rates from 1978-<br />
1989 are displayed in Figure 4.2. Agriculture still accounts<br />
for more than 25 percent of the country's total<br />
GDP. Its annual rate of growth averaged about 2.9<br />
percent compared to average annual growth of 4.9<br />
percent in "low income countries" from 1980-1986 and<br />
2.0 percent excluding China and India.<br />
In general agricultural production is weather dependent,<br />
and almost every crop subsector has experienced<br />
sluggish growth from weather factors. Upward<br />
growth in one year has been followed by downward<br />
trends the next year. This is evident in the production<br />
trends of the major tree crops, tea and rubber. In the<br />
paddy subsector production increased for two or three<br />
consecutive years, followed by a downfall due to poor<br />
weather conditions. However paddy production has
56<br />
Economies<br />
Rate of Growth of GDP 1970 - 1989<br />
140 Billions Rate of Growth % 10<br />
-2<br />
70 71 72 73 74 75 76 77 78 79 80 81 82 83 84 85 86 87 88 89<br />
Year<br />
—'— GDP (Rupees) -*- Rate of Growth -*- Growth per Capita<br />
Source : Central Bank of Ceylon, Annual<br />
Report<br />
20<br />
Percentage<br />
Figure 4.1<br />
Sectoral Composition of GDP<br />
1978 - 1989<br />
1978 1979 1980 1981 1982 1983 1984 1985 1986 1987 1988 1989<br />
Agriculture sH Mining EEB Manufacture E5S3 Construction<br />
ES3 Transport EE3 Wholesale CD Government 223 Other<br />
Source: Central Bank of Ceylon,<br />
Annual Reports<br />
Figure 4.2
I<br />
I<br />
I Economics 57<br />
The Price Of Pollution<br />
A study by the Central Environmental Authority in 1985 found that due to the breakdown of the<br />
electrostatic precipitators installed in the Puttalam Cement Factory the plant emitted about 120-200 tons of<br />
cement dust daily. About 10,000 hectares of neighboring lands were affected by the dust fall, including about<br />
3,400 hectares of coconut The cost of cement dust let loose in the factory was estimated at 20,000 rupees per<br />
day, or 6 million rupees per year, not including damage to the quality of cement produced, or the calcium oxide<br />
lost with dust evaporation.<br />
To remedy the problem, the study recommended replacement or reconditioning of the electrostatic<br />
precipitators (at a cost of 30 million rupees) and construction of a water treatment plant and a water<br />
conditioning tower (at a cost of another 55 million rupees). Because the Cement Corporation had no funds<br />
to meet these costs a Government grant of 43 million rupees (inclusive of price escalation) was needed to replace<br />
the pollution controls.<br />
A similar example concerns the Hunupitiya Fertiliser Complex and its environmental impacts. This<br />
complex ground, mixed, and distributed basic chemical fertilizer ingredients throughout the country. From its<br />
inception, the complex stored fertiliser and empty sacks in the open yard because it lacked adequate warehousing<br />
facilities. During the rains, water washed the fertilizers into surface and ground water. A study undertaken<br />
by the Ceylon Institute of Scientific and Industrial Research in 1984 found that well water in the area within a<br />
kilometer radius had become undrinkable and caused irritation to the eyes and skin, formation of calculi, and<br />
other health problems. The water pollution also adversely affected home garden yields and poultry.<br />
The total value of resources exhausted, depleted or deteriorated due to adverse environmental impact at<br />
the fertilizer plant was estimated at 47.5 million rupees over 20 years. The study therefore recommended pipe<br />
borne water to supply the area by extending the Colombo North Water Supply Scheme (at a cost of 14 million<br />
rupees) and also construction of additional warehousing facilities (at a cost of 1.5 million rupees) to discontinue<br />
storage of fertilizer and empty bags in the open yard. The Government was compelled to provide funds to<br />
extend the water supply facility to the area because the Fertiliser Corporation lacked sufficient funds to meet<br />
the cost.<br />
increased by 26.7 percent or on average by 2.47 per year<br />
during the period of 1977 to 1989.<br />
Attempts to expand agricultural production in Sri<br />
Lanka began in the 1930s when the government<br />
launched programs to repair, restore and rehabilitate<br />
the ancient irrigation systems. After Independence,<br />
however, emphasis shifted to a series of multipurpose<br />
river valley development schemes — the Gal-Oya<br />
Scheme in 1948, the Uda Walawe Scheme in the late<br />
1950s, and the Mahaweli basin development in the late<br />
1960s. After Independence irrigable paddy acreage<br />
increased more than 300 percent,, and the-<br />
Mahawelialone now provides 60 percent of the electric<br />
power of the country.<br />
Irrigation programs for agriculture allowed suc-<br />
cessive governments to address the problems of unem-<br />
ployment and food production. Yet this approach was<br />
highly capital intensive and proved a costly way to<br />
provide what amounted to limited employment oppor-<br />
tunities. Despite planning to generate secondary activ-<br />
ities such as agro-based industries able to absorb the<br />
next generation of settlers, in fact the second generation<br />
had either to resort to traditional shifting cultivation in
58<br />
the reserved forest areas or find employment in the<br />
urban centers.<br />
Government policy towards the agricultural sector<br />
has also been unbalanced. It has put special emphasis<br />
on paddy production and has devoted large subsidies<br />
to that subsector. The export crop sector, however, has<br />
not been given the same priority or fiscal and other<br />
incentives. Investments in the export crops sector have<br />
been insufficient to maintain the production levels attained<br />
in the 1960s. Although tea exports have remained<br />
roughly constant for three decades, rubber<br />
exports have fallen by about half. Sri Lanka's share in<br />
the world tea market declined from over a third in the<br />
1960s to a fifth in the 1980s.<br />
Despite these changes, agriculture still plays a predominant<br />
role in the Sri Lankan economy. Forty years<br />
after Independence Sri Lanka primarily depends on<br />
tea, rubber and coconut for exports, and paddy, pulses<br />
and subsidiary food crop production for subsistence.<br />
Nevertheless, the country's agricultural economy is in<br />
transition.<br />
Agricultural structures are changing mainly due to<br />
the green revolution and other technological breakthroughs.<br />
Paddy production has achieved a remarkable<br />
growth since Independence due to increased yield<br />
and expansion of land under production and irrigation.<br />
Other crops and animal husbandry activities have not<br />
shown similar changes due to poor achievements in<br />
research and development activities.<br />
Industry<br />
The year 1978 marked a turning point for Sri<br />
Lanka's industrial sector. From 1970-77 industrial output<br />
grew at an annual rate of 19 percent at current<br />
prices. From 1978-89, however, average annual growth<br />
of the manufacturing sector rose approximately 22 percent<br />
— at constant 1982 prices this was approximately<br />
5.5 percent per year, compared with the 4.8 percent<br />
growth achieved by the low income countries, excluding<br />
China and India, from 1980-1986.<br />
A striking feature of the industrial sector has been<br />
the differential rates of growth experienced by the public<br />
and private sectors. While private sector industries<br />
have shown considerable dynamism since economic<br />
Economics<br />
I<br />
I<br />
I<br />
liberalization in 1978, the public sector has shown onfl<br />
declining trends.<br />
Yet very little structural change has occurred in thl<br />
mix of outputs in the industrial sector. Over the pasW<br />
decade three subsectors - food, beverages and tobacco;<br />
textiles, wearing apparel and leather; and cheral<br />
icals, petroleum, coal, and plastic products - have been*<br />
predominant in production and value added. Thev<br />
accounted for 86 percent of the total industrial outpul<br />
In contrast the share of engineering-based industrie<br />
often considered to be the core of a country's sound<br />
industrial base, remained at about 5 percent of tots<br />
output. Increasing dependence on the use of importeer<br />
raw materials has also characterized Sri Lanka's industrial<br />
sector. Of the total value of production from thl<br />
chemicals subsector, over 70 percent consisted of imported<br />
materials in the 1980s, compared to 47 percer^<br />
in the 1970s. The three major industrial subsectors alsl<br />
used almost 65 percent of the energy consumed by the<br />
entire sector.<br />
J<br />
Government involvement in industry began in thi<br />
1940s when a number of enterprises were established<br />
to produce commodities that could not be imported il<br />
wartime. Essentially these were import substitution<br />
industries, although the government did not define such<br />
an industrial policy until later. Following the balancl<br />
of payments difficulties incurred in the late 1950s, however,<br />
the government explicitly implemented an impori<br />
substitution strategy because it had to ban or restri<br />
the import of many industrial goods. Under the industrial<br />
policy statement issued in 1956, the government<br />
assumed control over basic heavy industries such al<br />
iron and steel, cement, chemicals and fertilizer, leaving<br />
manufacture of light consumer goods to the private<br />
sector. But in time even this allowance changed, anl<br />
the government began several state enterprises to produce<br />
such consumer goods, as leather products, vegea<br />
table oil, ceramics, textiles, paper, plywood, tires ami<br />
tubes, and hardware.<br />
Import substitution and state-sponsored industril<br />
alization continued through the 1960s and 1970s, until<br />
trade liberalization began after 1977. The old strate;<br />
had caused several negative economic effects. One<br />
that economic efficiency of industrialization suffered<br />
from a disregard of the relatively high costs of produ<br />
1<br />
I
I<br />
I I<br />
I<br />
I<br />
100<br />
80<br />
60<br />
40<br />
20<br />
1972 1975<br />
Consumer Qoods<br />
Investment Goods<br />
Source : Central Bank of Ceylon.<br />
Annual Reports.<br />
800<br />
600 i<br />
400-<br />
200-<br />
Percentage<br />
Economics<br />
Composition of Imports in Selected Years<br />
1978 1982 1986<br />
Figure 4.3<br />
I I Intermediate Qoods<br />
• I Unclassified<br />
Volume and Value of Imports<br />
Rice, Wheat and Sugar<br />
Quantity (m.t.) Rs. (millions)<br />
1978 1982<br />
•ft Rice<br />
-o- Rice<br />
Source: Customs Returns<br />
1984 1986<br />
Year<br />
CZH Wheat<br />
-*- Wheat<br />
Figure 4.4<br />
1988 1989<br />
Sugar<br />
Sugar<br />
1989<br />
5000<br />
59
60<br />
tion in the local market. Industries could not expand to<br />
sell in the export market, and economies of scale for<br />
local industry were also impossible.<br />
In addition state-sponsored enterprises had always<br />
sought and usually obtained protection against foreign<br />
competition. Tariffs were increased to high levels<br />
along with, in most cases, quantity restrictions. Such<br />
excessive protection eventually destroyed the competitive<br />
edge of many domestic industries that were once<br />
considered strong import substitution and export-oriented<br />
industries.<br />
Finally the direct employment generated by the<br />
protected industries came at a very high capital cost.<br />
Policies of fixed exchange rates and concessionary<br />
tariffs that allowed importation of capital goods and<br />
raw materials favored the acquisition of technologies<br />
that were capital, not labor, intensive. The average cost<br />
of employing a unit of labor in most of the public sector<br />
manufacturing industries was around 60,000 US dollars<br />
at 1987 prices! The generation of indirect employment<br />
was also limited due to poor linkages between the<br />
industrial policy and the rest of the economy.<br />
Services and Construction<br />
With the economic liberalization policies after<br />
1977 the services and construction sectors showed high<br />
rates of growth until the civil disturbances in 1983.<br />
Between 1978 and 1983 the construction sector experienced<br />
annual growth of 8.8 percent, compared with 2.6<br />
percent growth from 1971-1977. The services sector<br />
grew at average annual rates of 3.7 percent from 1970-<br />
1977, and 7.2 percent from 1978-1983. With the civil<br />
disturbance in 1983, construction growth declined to an<br />
annual average of 1.0 percent per year, and services<br />
growth declined to 3.2 percent.<br />
Civil unrest hit the tourist industry hardest. Total<br />
tourist arrivals which peaked 407,230 persons in 1982,<br />
declined to 182,620 in 1987. In 1989 tourism increased<br />
to 184,732 persons — an increase of 1.1 percent over<br />
1987. Gross earnings of the industry also declined from<br />
146.6 million US dollars in 1983 to 76.3 million US<br />
dollars in 1989 — 50 percent of 1982 earnings.<br />
The high growth rates achieved by the construction<br />
industry from 1978-1982 resulted largely from im-<br />
Economies<br />
plementation of the three major government projects:<br />
the Accelerated Mahaweli Development Programme,<br />
the Katunayake Free Trade Zone Development, and<br />
the Housing Development and Urban Renewal Programme.<br />
Imports<br />
Imports, which constitute approximately one-third<br />
of the total GDP, are a major resource available for<br />
consumption and investment in the economy. The<br />
composition of imports has changed considerably over<br />
time - from the high proportion of consumer goods<br />
(for example, food and drink) in the early 1970s to the<br />
high proportion of investment and intermediate goods<br />
in the 1980s. The percentage composition of Sri<br />
Lanka's imports in the 1970s and 1980s is given in<br />
Figure 43.<br />
Within the import category of food and drink the<br />
major items included were rice, wheat, and sugar. Relationships<br />
between imports and local production are<br />
strong in this category. Since rice and wheat are close<br />
substitutes, declines in local production of rice were<br />
met by additional imports of either wheat or rice, depending<br />
on the price at the time of import.<br />
The total volumes and values of imports of rice,<br />
wheat, and sugar in some selected years is shown by<br />
Figure 4.4. It reveals the vulnerability of the economy<br />
and the balance of payments to price changes of food<br />
imports. If adverse weather reduces local production<br />
or if international food prices increase, then conditions<br />
of adverse balance of payments can result.<br />
RESOURCE UTILIZATION<br />
Trends in Consumption and Investment<br />
Consumption and investment patterns from 1970-<br />
1989 are shown in Figure 4.5. Important to the investment<br />
structure was its source of financing.<br />
Approximately 80 percent of GDE from 1970-1977 was<br />
financed from national savings, and the balance of 20<br />
percent came from foreign assistance. However, from<br />
1979-1989 investment financing was drastically<br />
changed; approximately 54 percent came from national<br />
savings and 46 percent from foreign assistance. The<br />
financing of the gross domestic investment from 1970-<br />
1977 and 1978-1989 is shown in Figure 4.6, and the<br />
I<br />
I<br />
I<br />
I<br />
I
120<br />
100<br />
80-<br />
60<br />
40-<br />
20<br />
Percentage<br />
Economics 61<br />
Gross Domestic Expenditure<br />
1970 - 89<br />
70 71 72 73 74 75 76 77 78 79 80 81 82 83 84 85 86 87 88 89<br />
Year<br />
Private Consumption<br />
E3 Gross Investment<br />
Sour»* Central Bank o» Ceylon. Annual<br />
Reporta. • Valuee in Re. Million<br />
•• Percentage«<br />
Rs. Millions<br />
Figure 4.5<br />
I I Public Consumption<br />
•B Stocks<br />
Financing of Gross Domestic investment<br />
(GDI)<br />
77 78 79 80 81 82 83 84 85 86 87 88 89<br />
Year<br />
Source : National Planning Department,<br />
Publie Inveetment Programm«. Different<br />
lasuee.<br />
National Savings I Foreign Assistance<br />
Figure 4.6
62<br />
600<br />
Economies<br />
Net Disbursement of Official Development<br />
Assistance 1980 - 88<br />
$ Million $ Per Capita<br />
80 81 82 83 84 85<br />
Year<br />
-*- $ Million -*- P«r Capita $<br />
Source: Department of External Resources<br />
Economic Indicators, Different Issues<br />
disbursement of official foreign assistance from all<br />
sources from 1980-1989 is shown in Figure 4.7.<br />
The increase in per capita receipt of external foreign<br />
assistance is consistent with the increased flow of<br />
foreign savings that were devoted to financing investment<br />
expenditure during the same period.<br />
We lack adequate information in Sri Lanka to<br />
analyze the sectoral composition of gross domestic investment.<br />
Private sector investment is computed inclusive<br />
of investments made by the public corporations.<br />
During the 1970s the public sector, which includes the<br />
government ministries, departments and enterprises<br />
other than public corporations, devoted approximately<br />
30 percent of their investment to machinery and equipment<br />
and the balance (70 percent) to land development<br />
and construction-related activities. From 1982-1984<br />
these proportions changed to 48 percent and 52 percent<br />
respectively. However, by the end of the 1980s the<br />
proportions again reversed, to 30 percent on machinery<br />
and equipment and 70 percent on land development<br />
and construction. The increase in investment in machinery<br />
and equipment during the early 1980s was due<br />
entirely to heavy mvestments in power generation<br />
equipment for the Accelerated Mahaweli Development<br />
Programme.<br />
Figure 4.7<br />
Exports<br />
86 87 88<br />
Over the twenty years between 1960 and 1980 Sri<br />
Lanka experienced no substantial increase in total volume<br />
of exports. The export volume index of 102 in 1962<br />
(1978 = 100) remained about the same in 1980, with a<br />
peak of 111 in 1965. During 1964,1968,1970, and 1975<br />
the export volume index reached 107, but in all other<br />
years it was well below that.<br />
Since 1980 export volumes have steadily improved<br />
to reach a 50 point increase in the volume index 1980-<br />
1989. Remarkable increases resulted from exports of<br />
precious and semiprecious stones and industrial products;<br />
the export volume index (1981 = 100) for precious<br />
and semiprecious stones increased from 144 to 4314<br />
and for industrial products it increased from 74 to 189<br />
between 1980 and 1989. Similar trends can be observed<br />
in terms of export values, where the value index of all<br />
exports increased from 87 in 1980 (1981 = 100) to 267<br />
in 1989. Trends in export volume and value are given<br />
in Figure 4.8.<br />
Statistics on export performance during the past<br />
ten years clearly show the growing export diversification<br />
of the economy. Sri Lanka no longer depends on<br />
three agricultural tree crops. Industrial goods have<br />
89
300<br />
250<br />
200-<br />
150<br />
100<br />
so<br />
0 111<br />
280<br />
200<br />
ISO<br />
100<br />
140<br />
120-<br />
100<br />
80<br />
so<br />
40<br />
20-<br />
o<br />
Economies 63<br />
Export Trade Indices (1981 = 100)<br />
Tea Rubber<br />
1 •1 1<br />
pi 1 El<br />
| i<br />
80 81 82 S3 84 85 88 87 88 89<br />
Year<br />
I Export Volum« IEIDOM vak»<br />
Coconut Products<br />
80 81 82 83 84 85 88 87 88 88<br />
Year<br />
IIMII<br />
140-<br />
120-<br />
100-<br />
80"<br />
ao-<br />
«o-<br />
3- l<br />
800<br />
|<br />
80 81 82 83 84 88<br />
Year<br />
3 Export Volum* I Export Vahra<br />
Industrial Products<br />
87 88 80<br />
80 81 82 83 84 88 88 87 88 89<br />
1 Export Voluir» I Export Valu« » Export Volum« I Export Valume<br />
Petroleum Products Precious & Semi-Precious Stones<br />
c ' ^ "~~^B Export Vatu*<br />
Source : Central Bank of Ceylon, Annual Report<br />
3-<br />
2-<br />
Figure 4.8<br />
Thousands<br />
80 81 82 83 84 85 88 87 88 89<br />
Year<br />
i Export Volum» I Export Valu*
64<br />
200<br />
150-<br />
100<br />
so-<br />
Export Trad« Indices (1981 • 100)<br />
Minor Agricultural Products<br />
Figure 4.8<br />
Export Valu»<br />
ar ss M<br />
surpassed 50 percent and agricultural exports now account<br />
for no more than 40 percent of total exports.<br />
Nevertheless, as depicted in Figure 4.9, industrial exports<br />
depend heavily on imported raw materials, and<br />
the value added in industry is comparatively low. Almost<br />
62 percent of industrial exports, or 31 percent Of<br />
the total value of exports, are textiles and garments in<br />
which import content can reach 60 percent.<br />
Since the economic policy changes begun after<br />
1977 the government has sought to implement a National<br />
Export Development Plan (NEDP), with the first<br />
NEDP covering the period 1983-1987. The Plan's priority<br />
policy measures were to ensure free trade in inputs<br />
required for export processing so Sri Lankan exporters<br />
could compete in world markets. To ensure this free<br />
access the government implemented schemes for duty<br />
rebate, manufacture-in-bond, and duty exemption (to<br />
eliminate duties on machinery, equipment, and accessories<br />
used in export processing industries).<br />
A basic constraint on industrial export promotion<br />
is the lack of automatic financing facilities able to provide<br />
working capital at competitive interest rates.<br />
Commercial banks require securities and collateral beyond<br />
the ability of small exporters who, from a bank's<br />
point of view, are not credit-worthy. Although the Sri<br />
Lanka Export Credit Insurance Corporation was established<br />
precisely to overcome this problem, this measure<br />
has been nullified by bank requirements for securities<br />
Economies<br />
and collateral over and above the Corporation's guarantee<br />
limits.<br />
MACRO-ECONOMIC<br />
LIMITATIONS<br />
AND PRESSURES<br />
Sri Lanka's economy is still passing through a transitional<br />
period from a relatively inward-looking, agriculture-based<br />
economy to one that is outward looking<br />
and industrial. This transformation would have been<br />
much quicker and less painful if severe resource imbalances<br />
had not been experienced during the last decade.<br />
These are important to note and examine briefly.<br />
Unemployment<br />
The total workforce has been growing at an average<br />
of 138,500 per year. This is an annual increase much<br />
higher than the average annual population growth. In<br />
contrast, net employment creation has grown during<br />
the past several years at an annual average of 90,000<br />
units, adding approximately 35,000 persons to the existing<br />
unemployed backlog. Hence, the open unemployed<br />
rate increased from 12.0 percent in 1981 to<br />
almost 20 percent in 1988.<br />
Underemployment is also serious, amounting to<br />
over 20 percent of the workforce and mainly concentrated<br />
in rural areas. If we assume that the underemployed<br />
work only two-thirds of the time this rate adds<br />
another 8 percent in equivalent open unemployment to<br />
the current figure of 20 percent.<br />
The opening of the economy after 1977 produced<br />
a spurt to generate jobs that might have been sustainable<br />
in the long run. Yet the civil disturbances in 1983<br />
created such economic dislocation that today Sri Lanka<br />
faces a large gap between present labor force growth<br />
and domestic job creation, making it exceedingly difficult<br />
to bring unemployment down to its 1981 level.<br />
Job opportunities abroad have helped considerably<br />
in relieving unemployment, but these opportunities<br />
appear more limited in the near future. Nor will<br />
massive investment programs, such as the Accelerated<br />
Mahaweli Development, be available to increase agricultural<br />
employment through expanding irrigation<br />
acreage. The economy must now depend on industrial
I<br />
I<br />
I<br />
I<br />
I<br />
I<br />
I<br />
I<br />
I<br />
I<br />
I r ;<br />
I<br />
I<br />
I<br />
i<br />
I<br />
I<br />
I£ :<br />
V<br />
I<br />
[<br />
I<br />
f<br />
1.<br />
2.<br />
3.<br />
4.<br />
Category<br />
Agriculture Exports<br />
1.1 Tea<br />
1.2 Rubber<br />
1.3 Coconut<br />
1.4 Minor Agricultural Crops<br />
Industrial Exports<br />
2.1 Textiles & Garments<br />
2.2 Petroleum Products<br />
2.3 Other<br />
Mineral Exports<br />
3.1 Gems<br />
3.2 Other<br />
Unclassified Qncl. re-exports)<br />
100<br />
80<br />
60-<br />
40-<br />
20-<br />
Percentage<br />
Economies<br />
Composition of Exports 1980 -1989<br />
(Percentages)<br />
1980<br />
61.8<br />
35.1<br />
14.7<br />
7.0<br />
5.1<br />
33.0<br />
10.4<br />
17.7<br />
4.9<br />
4.6<br />
3.8<br />
0.8<br />
0.6<br />
1981<br />
57.3<br />
30.6<br />
13.7<br />
6.8<br />
6.6<br />
34.7<br />
14.4<br />
16.0<br />
4.3<br />
3.8<br />
3.0<br />
0.8<br />
3.7<br />
1982<br />
54.3<br />
29.6<br />
10.8<br />
7.0<br />
6.9<br />
38.6<br />
16.3<br />
15.3<br />
6.9<br />
4.0<br />
3.2<br />
0.8<br />
3.1<br />
1983<br />
58.0<br />
33.1<br />
11.4<br />
7.6<br />
5.9<br />
35.1<br />
18.9<br />
10.6<br />
5.6<br />
4.5<br />
3.7<br />
0.8<br />
2.4<br />
1984<br />
60.3<br />
4Z2<br />
8.8<br />
5.7<br />
3.6<br />
33.7<br />
20.2<br />
8.8<br />
4.7<br />
2.2<br />
1.6<br />
.0.6<br />
3.7<br />
1985<br />
52.5<br />
33.1<br />
7.1<br />
8.5<br />
3.8<br />
39.5<br />
22.0<br />
10.7<br />
6.8<br />
2.4<br />
1.6<br />
0.6<br />
5.6<br />
1096<br />
46.3<br />
27.2<br />
7.7<br />
7.0<br />
4.4<br />
46.6<br />
28.3<br />
6.9<br />
11.4<br />
3.5<br />
2.2<br />
1.3<br />
3.7<br />
1987<br />
42.4<br />
25.9<br />
7.1<br />
5.2<br />
4.2<br />
48.6<br />
31.3<br />
6.3<br />
11.0<br />
4.4<br />
3.5<br />
0.9<br />
4.6<br />
1988<br />
1980 1981 1982 1983 1984 1985 1986 1987 1988 1989<br />
Year<br />
EB Agriculture Export<br />
I I Mineral Export<br />
Source : Central Bank of Ceylon, Annual Reports<br />
Figure 4.9<br />
Industrial Export<br />
Unclassified<br />
42.8<br />
26.2<br />
7.9<br />
3.3<br />
5.4<br />
48.3<br />
30.4<br />
4.8<br />
13.1<br />
5.6<br />
4.4<br />
1.2<br />
3.3<br />
1989<br />
39.2<br />
24.3<br />
5.5<br />
5.1<br />
4.3<br />
50.7<br />
31.4<br />
4.0<br />
15.3<br />
4.8<br />
3.9<br />
0.9<br />
5.3<br />
65
66<br />
Percentage<br />
8 O '|l<br />
4 0 - ^<br />
20-<br />
Economies<br />
Percentage Distribution<br />
Income 1953 -<br />
mmdHt<br />
tmnnmit<br />
mm<br />
Or i<br />
1953 1963<br />
C3 Highest ES! 8th<br />
E53 4th • 5th E3 2nd<br />
and other non-traditional pursuits to create employment<br />
opportunities.<br />
In the past Sri Lanka achieved an annual labor<br />
productivity rate of approximately 3.0 percent. At this<br />
rate, to absorb the annually increasing workforce alone,<br />
the economy will need to achieve an average annual rate<br />
of growth of 5.1 percent. If, however, the backlog of<br />
unemployed is also to be absorbed into the employment<br />
stream over a period of perhaps ten years, the annual<br />
rate of GDP growth must be increased to 7.0 percent,<br />
assuming a constant rate of productivity and an increase<br />
in the workforce.<br />
Income Distribution and Poverty<br />
Trends in the pattern of income distribution and<br />
the related problem of poverty can be gleaned from the<br />
Consumer Finances and Socio-Economic Surveys of<br />
the Central Bank, and the Socio-Economic and Labour<br />
Force Participation Surveys of the Department of Census<br />
and Statistics. They provide detailed information<br />
on the income distribution pattern in Sri Lanka during<br />
the years 1953, 1963, 1973, 1981 and 1985. Although<br />
these two data sources are not strictly comparable, due<br />
to definitional problems, Figure 4.10 shows the percentage<br />
distribution of household income during the<br />
period 1953-85.<br />
1973<br />
Year<br />
* 9th<br />
• 3rd<br />
Figure 4.10<br />
of Household<br />
1985<br />
1981 1985<br />
E£B eth • 7th<br />
IB Lowast<br />
The data suggest that the income benefits of economic<br />
growth experienced after 1978 have, so far, favored<br />
upper income groups more than the lower<br />
groups. The share of the bottom 40 percent, who received<br />
a total income of 19.29 percent in 1973, increased<br />
to 21.4 percent in 1981, but it declined to 16<br />
percent in 1985. During this period the share of the<br />
highest 20 percent increased from 42.95 percent in 1973<br />
to 523 percent in 1985. World Bank analysts, using<br />
1985-86 poverty survey data, concluded that despite<br />
improvements in mortality, crude death rates, and population<br />
growth rates, about 20 percent of Sri Lanka's<br />
population was living in poverty (World Bank 1990).<br />
Malnutrition<br />
The nutritional surveys of 1976,1981/2, and 1985/6<br />
reveal high levels of malnutrition among infants and<br />
preschool children. Chronic malnutrition of children<br />
in this age group was 34 percent in 1976 and 36 percent<br />
in 1981/2. In 1985/6 however, it fell to 275 percent for<br />
the 3 months to 3 year old age group. A 1987 health<br />
survey has indicated that about 25 percent of pr e-school<br />
children were under height for their age because of<br />
malnutrition (World Bank 1990).<br />
Micro-nutrient deficiencies of iron, iodine and vitamin<br />
A have been major malnutrition problems in Sri<br />
I<br />
I<br />
I<br />
I<br />
I<br />
I<br />
I<br />
I<br />
I<br />
I<br />
I<br />
I<br />
I<br />
I<br />
I<br />
I<br />
I<br />
I<br />
I<br />
I<br />
I
I<br />
I<br />
I<br />
I<br />
I<br />
I<br />
II<br />
I<br />
I<br />
Ii 1<br />
I ii<br />
I<br />
I<br />
I<br />
I<br />
I<br />
I<br />
I<br />
Lanka. Iron deficiency of a mild nature seems to be<br />
around 50-60 percent in children and pregnant and<br />
lactating women. Goiter incidence ranges from 6-35<br />
percent in the goiter endemic regions.<br />
Government policy has traditionally emphasized<br />
increased agricultural productivity to overcome the nutritional<br />
problems. Because the removal of subsidies<br />
on wheat-flour, rice, fertilizer, and bus fares threatened<br />
to reduce consumption levels of the poorest 20 percent<br />
of the population, the government stretched out the<br />
elimination of rice and wheat-flour subsidies into 1990.<br />
In addition, several special programs such as the<br />
Triposha distribution program, school biscuit feeding<br />
program, and primary health care intervention program,<br />
have also been implemented, along with the<br />
Janasaviya Program, and the School Mid-day Meal<br />
Programs.<br />
POLICY IMPACT<br />
Macro-economic and development policies have<br />
direct and indirect effects on the productive sectors of<br />
the economy. Comprehensive study of the economic<br />
conditions and trends requires analyses of the direct<br />
impacts of fiscal, monetary and pricing policies over the<br />
past ten to twenty years.<br />
Before 1977 predominant state intervention in economic<br />
activities emphasized regulatory measures<br />
through price controls and fixed exchange rates. Government<br />
subsidies were commonly directed to producers<br />
as well as consumers. After 1977, however, the state<br />
concentrated on ways to create necessary infrastructure<br />
for economic development and to reduce or eliminate<br />
direct involvement in economic activities. These<br />
policies were reflected in import liberalization, a floating<br />
exchange rate, and removal of price controls and<br />
quantity restrictions. Market forces strongly affected<br />
economic decisions.<br />
Before 1977 policies encouraged the establishment<br />
of high capital intensive industrial ventures under<br />
government patronage. Pricing policy adopted by<br />
these enterprises basically sought to maintain a lower<br />
cost of living, giving secondary consideration to profitability<br />
or economic efficiency. Often no margin existed<br />
to cover maintenance or replacement costs of machinery<br />
and equipment. As a result, small breakdowns<br />
Economics 67<br />
in the production process required government funds<br />
for a remedy, and sometimes the establishment was<br />
closed for months for want of repair funds. (See box -<br />
The Price of Pollution.)<br />
Environmental Degradation and Economic<br />
Development<br />
Production or consumption inevitably creates<br />
wastes and environmental emissions as by-products.<br />
The effects of these by-products cause three kinds of<br />
impacts that economists consider externalities:<br />
• direct externalities affecting the producer that he<br />
has reason to internalize and so reduce or prevent,<br />
such as pollution of his own water supply,<br />
• spatial externalities generated in one place but<br />
affecting another place which the producer has no<br />
incentives to correct, such as air pollution emitted<br />
through a tall stack;<br />
• intergenerational externalities likely to affect future<br />
generations, such as improperly managed<br />
toxic waste.<br />
These impacts occur regardless of ownership, public<br />
or private. Various regulatory and economic tools<br />
are available to address these problems.<br />
After 1977, to correct the investment failures that<br />
caused these kinds of problems, the government removed<br />
price controls and adjusted exchange rates. Results<br />
were encouraging. Some inefficient industrial<br />
enterprises halted production. Other industries found<br />
that they were better able to generate sufficient funds<br />
to meet repair and maintenance costs. Depending on<br />
their profitability, public sector agencies were also able<br />
to borrow funds from the financial markets for these<br />
and other purposes.<br />
Economic policies after 1977 stimulated new investments<br />
in industry, tourism, export agriculture, and<br />
aquaculture where high profit margins have been most<br />
assured. These investment opportunities are likely to<br />
encourage more intense commercial use of and competition<br />
for water, land, and other natural resources. So<br />
it becomes increasingly important to include the costs<br />
of environmental degradation in the industry's cost of<br />
doing business. This can be done by developing
68<br />
resource management systems that give resource users<br />
incentives to choose for themselves how best to avoid<br />
the adverse environmental consequences of their<br />
resource use.<br />
To achieve this goal, and to develop programs for<br />
sustainable resource use, Sri Lanka's production and<br />
pollution control systems must recognize the costs of<br />
resource depletion and degradation. Later chapters<br />
References<br />
Asian Development Bank (ADB) (1989). 'Sri Lanka'. Asian Development<br />
Outlook 1989, Manila, pp. 135-140.<br />
Asian Development Bank (ADB) (1990). 'Sri Lanka'. Asian Development<br />
Outlook, 1990, Manila, pp. 163-169.<br />
Central Bank of Sri Lanka (CBAR). Annual Report 1979/1980.<br />
Economic Research Department, Colombo.<br />
Central Bank of Sri Lanka (CBAR) (1983). Report on consumer<br />
finances and social economic survey 1978/1979, Sri Lanka,<br />
parts I and II. Statistics Department. Colombo.<br />
Centra Bank of Sri Lanka (CBAR) (1984). Report on consumer<br />
finances and socio-economic survey 1981/1982, Sri Lanka,<br />
parts I and IL Statistics Department, Colomba<br />
Economics<br />
highlight the urgent need for much better data and<br />
application of data on natural resource losses, environ-<br />
mental impacts on human health, and other significant<br />
environmental changes. By translating these impacts<br />
into economic terms, policy makers will have a new and<br />
powerful ability to build sound environmental ap-<br />
proaches into economic development programs in ways<br />
that, until now, have been largely neglected.<br />
Central Bank of Sri Lanka (CBAR) (1990). Reports on consumer<br />
finances and social economic survey 1986/1987, Sri Lanka,<br />
part IL Statistics Department, Colombo.<br />
Central Environmental Authority (CEA) (1988). Sri Lanka: National<br />
conservation strategy. Department of Government<br />
Printing, Colombo.<br />
Government of Sri Lanka (1988). The National Atlas of Sri<br />
Lanka. Survey Department, Colombo.<br />
Levin, J. (1990). The economy and the environment: revising the<br />
national accounts. IMF survey, Vol. 19, No. 11. pp. 161 and<br />
168-169.<br />
Wanigasundara, M. (1987). Malnutrition among children: Sri<br />
Lanka's problem. Daily News. Colombo. Friday December<br />
11,1987.<br />
World Bank (1988). World development report 1988. Oxford<br />
University Press for IBRD/ World Bank, Washington.<br />
I<br />
I<br />
I<br />
I<br />
I<br />
I<br />
I<br />
I<br />
I<br />
I<br />
I<br />
I<br />
I<br />
I<br />
I<br />
I<br />
I<br />
I<br />
I<br />
I<br />
I
1<br />
i<br />
i<br />
i<br />
i<br />
1<br />
Economies 5g
70<br />
Victoria Dam on the Mahaweii Ganga is Sri Lanka's major producer of hydroelectricKy.<br />
I<br />
I<br />
I<br />
I<br />
I<br />
I<br />
I<br />
I<br />
I<br />
I<br />
I<br />
I<br />
I<br />
I<br />
I<br />
I<br />
I<br />
I<br />
I<br />
I
I<br />
I<br />
I<br />
I<br />
I<br />
I<br />
I<br />
I<br />
I<br />
I<br />
I<br />
I<br />
I<br />
I<br />
I<br />
1<br />
• I<br />
I<br />
I<br />
r<br />
5 Energy Resources<br />
The major forms of primary energy used in Sri<br />
Lanka are biomass (70 percent), hydroelectricity (10<br />
percent), and oil (20 percent). Not included in this<br />
energy budget is solar energy, used to dry agricultural<br />
produce and fish and extract salt from sea water, and<br />
draught power commonly used to transport goods in<br />
rural areas, plough paddy fields, and harvest timber.<br />
Hydro energy and biomass are indigenous resources,<br />
but all oil must be imported. No fossil fuels have<br />
been discovered in Sri Lanka or its offshore territorial<br />
jurisdiction. Until 1973, woodfuel use was gradually<br />
shifting to oil for household cooking and in some small<br />
industries, but that trend stopped with the oil price<br />
hikes of the 1970s. Rising oil prices caused severe and<br />
continuing strains on Sri Lanka's economy; in 1982 net<br />
oil imports rose to 47 percent of export earnings. Escalation<br />
in oil prices in the 1970s helped accelerate Sri<br />
Lanka's Mahaweli development project — earlier conceived<br />
mainly as an irrigation project to boost domestic<br />
agriculture. The large hydroelectric generating<br />
capacity of its storage reservoirs assumed new importance.<br />
As oil became expensive, household and small<br />
industry sectors began turning back to woodfuel.<br />
Consumption of commercial energy (electricity<br />
and petroleum) by sector divides into transport (54<br />
percent), industry and commerce (26 percent), domestic<br />
(17 percent) and others (3 percent). Transport<br />
consumes only petroleum products. Domestic consumption<br />
of commercial energy (electricity and<br />
kerosene) is mainly for lighting, although the last ten<br />
years has seen a significant increase in use of electrical<br />
appliances such as fans, cookers, and refrigerators,<br />
particularly in urban households.<br />
In the near future, at least, biomass fuel will retain<br />
its dominant energy position. Most biomass fuel is used<br />
in domestic cooking. Because of highly inefficient traditional<br />
cooking methods the energy wasted from<br />
biomass conversion is particularly high; in terms of<br />
useful energy, the contribution of biomass fuel to the<br />
national energy budget reduces to about 40 percent.<br />
(See Figure 5.1)<br />
ELECTRICITY DEMAND<br />
Electricity consumption has grown rapidly during<br />
the past two decades. From 1970-1977, despite slow<br />
economic growth and declines in petroleum consumption,<br />
electricity demand grew at an annual rate of 7<br />
percent. This high growth may be attributed in part to<br />
the absence of tariff increases (when the petroleum<br />
prices rose 50 percent), and a growing industrial and<br />
commercial market for electricity.<br />
Supply and distribution of electricity is the responsibility<br />
of the Ceylon Electricity Board (CEB), a<br />
government agency. In 1988, the total electric sales<br />
were 2370 GWh. The consumption by different<br />
categories of users is shown in Figure 5.2.<br />
From 1977 to 1983 average annual consumption<br />
rose to 9.5 percent, spurred by the opening of the<br />
economy, new industries in the Export Promotion<br />
Zone, the booming tourist industry, and general expansion<br />
of the services sector. The large number of new<br />
tourist hotels created a new and significant demand for<br />
lighting, air conditioning, cooking, water heating and<br />
refrigeration. In the domestic sector, too, increased<br />
use of newly available domestic appliances significantly<br />
increased electric demands. So did greatly accelerated<br />
rural electrification after 1977. Demand grew despite<br />
several substantial increases in electric rates.<br />
With civil disturbances in 1983 came a decline in<br />
the rate of economic growth and, concomitantly, in the<br />
rate of growth of electricity consumption. From 1983<br />
to 1988 annual growth in consumption dropped to 5.5<br />
percent. Overall, since the introduction of economic<br />
reforms, from 1977 to 1988, average annual growth of<br />
electricity consumption (sales) was 7.8 percent in con-<br />
71
72<br />
Energy Resource<br />
Proportions of Primary Energy consumed in Sri Lanka in terms of<br />
1. Total Energy and 2. Useful Energy<br />
KSr.tJ BIOMASS FUEL<br />
f=I?J HYDRO<br />
Figure 5.1<br />
Energy Use in GWh.<br />
mGeneral Services 358<br />
industrial 905 I t<br />
•••âHi|Mr ' Street Lighting 17<br />
\ à<br />
Hotels 85<br />
E- :::::: fh> Religious 12<br />
mm/<br />
Domestic 392<br />
•••) >O
I<br />
I I ;<br />
! ;<br />
I<br />
I<br />
I<br />
I<br />
I<br />
I<br />
I<br />
If :<br />
I<br />
I<br />
I<br />
I<br />
I<br />
I<br />
I<br />
I<br />
I<br />
I<br />
I<br />
Energy Resources 73<br />
Electricity Demand Forecasts and Hydropotential<br />
(from GTZ Master Plan)<br />
Figure 5.3<br />
Print OMM2
74<br />
trast to an average GDP growth rate of 4.9 percent On<br />
the basis of the total sales of electricity to all sectors,<br />
annual per capita consumption of electricity rose from<br />
75 to 143 KWh during these years.<br />
In the months that followed a restoration of civil<br />
order from December 1989 to March 1990, electricity<br />
consumption surged upward to the equivalent of an<br />
annual growth of 20 percent.<br />
The present government has sought to extend the<br />
electricity grid to rural areas as fast as possible.<br />
Whereas by 1977 only 943 rural electricity schemes had<br />
been completed, by 1988 the number had increased to<br />
8,080. By 1990 a third of Sri Lanka's villages received<br />
electricity. The total of households using electricity for<br />
lighting was 14.9 percent in 1981, and 24 percent in<br />
1988.<br />
To help forecast electricity demand and to plan<br />
power development projects, the German Agency for<br />
Technical Cooperation (GTZ) recently helped the<br />
CEB to prepare a Master Plan for electricity supply.<br />
The GTZ demand forecasting model for the Plan links<br />
future consumption to predicted population gains,<br />
specific consumption per household, and the expected<br />
increases in consumers. Separate forecasts for urban<br />
and rural areas, take into account targets for rural<br />
electrification, future development of commercial and<br />
industrial consumer categories, overalleconomic<br />
growth, and GDP/consumption elasticities for several<br />
subsectors.<br />
The GTZ model presented three demand growth<br />
scenarios (Figure S3). The base demand forecast (an<br />
intermediate scenario between the high and low<br />
forecasts), assumes that SO percent of Sri Lanka's<br />
households will be connected to the grid by the year<br />
2000, and that long-term average GDP growth will be 5<br />
percent per year. The base demand curve assumes that<br />
a reduction in distribution losses from 17 to 12 percent<br />
could be achieved within this decade.<br />
If this base demand forecast is accurate, Sri<br />
Lanka's system peak demand will grow from 600 MW<br />
in 1988, to 1,600 MW in 2,000 and 3,000 MW in 2010.<br />
The required generation will rise from 2,800 GWh in<br />
1988 to 7,200 GWh in 2000 and 13,700 GWh in 2010.<br />
The generation demand would, on average, increase by<br />
Energy Resource<br />
82 percent per year up to the year 2000 and by 6.7<br />
percent per year from 2001 to 2010. The natural<br />
resource implications of meeting this demand are discussed<br />
below.<br />
ROLE <strong>OF</strong> HYDROPOWER<br />
A high rainfall and mountainous terrain in the<br />
southwest part of the island have provided the country<br />
with excellent hydropower resources. Prior to the<br />
1950s mini hydro plants were used in tea and rubber<br />
factories for providing motive power and in-house<br />
lighting, but steam and diesel generators provided<br />
power to Colombo and the other major towns. The first<br />
hydropower plant that supplied electricity for distribution<br />
was commissioned in 1950, with capacity of 25 MW.<br />
Since then, hydropower has played an increasingly important<br />
role, and by 1977 installed hydropower capacity<br />
was 332 MW with an annual output of 1,215 GWh. In<br />
contrast, installed capacity of thermal generation was<br />
70 MW in 1977 and the output was only 2 GWh.<br />
After 1977, with rapid economic expansion and<br />
growth in electricity demand, the installation of<br />
hydropower plants could not keep pace with demand,<br />
requiring more thermal plants. Thermal generation<br />
was necessarily high in 1983 when prolonged dry<br />
weather reduced hydropower generation; of a total<br />
output of 2,144 GWh, thermal contributed 42 percent<br />
(897 GWh). Since then, hydropower development accelerated<br />
and in 1988 hydro (which by then had an<br />
aggregate installed capacity of 938 MW) produced<br />
2^597 GWh, while the thermal plants mostly played a<br />
standby role and produced only seven percent of the<br />
total (202 GWh). Total electricity generation each year<br />
from 1977 to 1989, and the hydroelectric share are given<br />
in Figure 5.4.<br />
At present, the total installed capacity of<br />
hydropower plant is 1017 MW, and the output is 3375<br />
GWh in a year of average rainfall. One more power<br />
station is under construction: Samanalawewa<br />
(capacity, 120 MW; annual output, 420 GWh). When<br />
this project is completed, most of Sri Lanka's large<br />
hydropower resources will have been harnessed. However,<br />
the GTZ-sponsored Master Plan study investigated<br />
the possibilities of capacity extension at the<br />
I<br />
I<br />
I<br />
I<br />
I<br />
I<br />
I<br />
I<br />
I<br />
I<br />
I<br />
I<br />
I<br />
I<br />
I<br />
I<br />
I<br />
I<br />
I<br />
I<br />
I
I<br />
I<br />
I<br />
I<br />
I<br />
I<br />
I<br />
I<br />
I !; •<br />
i<br />
I<br />
I<br />
I<br />
I<br />
r<br />
existing power stations and concluded that 300 MW<br />
could be added at a cost of 600 US dollars per KW.<br />
The GTZ studied the possible medium-scale<br />
hydropower resources and identified 75 sites. It found<br />
that 41 of these could possibly be economic in comparison<br />
to thermal power generation. Detailed<br />
prefeasibility level studies were carried out at each site.<br />
Project reports addressed such ancillary aspects as the<br />
possible use of these hydropower projects for supplying<br />
irrigation water and for flood control, and possible<br />
economic costs through loss of agricultural and forest<br />
land. Their total economic hydro potential, up to an oil<br />
price of 40 US dollars per barrel (the world rate as of<br />
October 1, 1990), was estimated at 3,400 GWh per<br />
annum, equivalent to an aggregate capacity of 775 MW<br />
at an average 50 percent operating capacity.<br />
Mini hydro sites scattered around the tea and rubber<br />
plantations offer another untapped source of<br />
hydropower. The total potential is estimated at about<br />
100 MW, with a generation capability of 400 GWh per<br />
annum. Several government agencies are involved in<br />
mini-hydro development activities, notably the Janatha<br />
Estates Development Board (JEDB) and the State<br />
Plantations Corporation (SLSPC). Several foreign<br />
agencies have financed feasibility studies and in some<br />
cases actually provided funds for implementing energy<br />
projects.<br />
Hydropower generation requires adequate and<br />
regular rainfall; generation capability drops appreciably<br />
in dry years. Hence every new hydropower plant<br />
requires a thermal plant backup. In addition, thermal<br />
units have a distinct role in the periods between the<br />
commissioning of hydropower stations, when demand<br />
continues to rise without corresponding increase in the<br />
hydro-generation.<br />
After completion of the Samanalawewa project in<br />
1992, total installed hydroelectric capacity will be 1,137<br />
MW. Thermal back-up equal to a third of this capacity<br />
is considered necessary to avoid shortages from<br />
drought. Present thermal capacity is 200 MW. The<br />
Kelanitissa plant is being rehabilitated and will add 50<br />
MW, but more thermal capacity will also be required.<br />
Given the capacity and cost limitations of further<br />
hydropower generation thermal generation for backup<br />
Energy Resources 75<br />
and primary supply will inevitably play an increasingly<br />
important role.<br />
Thermal Generation Options<br />
Is nuclear power a reasonable option? A few years<br />
ago the Atomic Energy Authority studied all aspects of<br />
nuclear power generation in Sri Lanka. A committee<br />
of experts appointed by the National Science Council<br />
advised against it for technical, economic and environmental<br />
reasons, but it recommended another review<br />
after the year 2000.<br />
In the mid-1980s feasibility studies sponsored by<br />
the CEB evaluated proposal for a coal-fired power<br />
generating station in Trincomalee on the east coast of<br />
Sri Lanka. Slated to commence operations in the mid-<br />
1990s, its generating capacity was to have been increased<br />
futher, until, in the late 1990s, it would have a<br />
generating capacity of 900 MW, with two units of 150<br />
MW and two of 300 MW. Coal was to be imported from<br />
Australia or South Africa and off-loaded at the deep<br />
water harbor at Trincomalee.<br />
The proposal quickly aroused controversy. The<br />
National Aquatic Resources Agency (NARA) opposed<br />
plant location at Trincomalee, and when the<br />
proposal became public numerous individuals and nongovernment<br />
organizations protested as well. Among<br />
the issues they raised : shortcomings in the required<br />
environmental impact assessment, the unknown effect<br />
of acid rain on tea and rubber plantations, thermal<br />
pollution of the sea around Trincomalee, and adverse<br />
impacts on a picturesque sea coast resort and potential<br />
tourist region. The NGOs claimed that there was untapped<br />
and available hydro potential, that a significant<br />
saving in electricity could be effected by reducing transmission<br />
losses, and that thermal capacity could be<br />
provided by smaller power stations in more environmentally<br />
appropriate sites. The CEB sought a construction<br />
permit from the Director of the Department<br />
of Coast Conservation, who studied the environmental<br />
impact assessment (EIA) and public submissions, including<br />
criticisms of the NGOs. As a result, he decided<br />
that the EIA had not adequately addressed the issues<br />
involved and withheld permission. The matter was not<br />
pursued by the CEB, since oil prices had by then
76<br />
LP Gas 0.9»<br />
Energy Resource<br />
1988 Commercial Energy<br />
Oil 58.9%<br />
dropped sharply, making a coal-fired plant uneconomic.<br />
Subsequently, a smaller coal-fired thermal plant<br />
was analyzed for location on the coast south of Galle.<br />
In light of the environmental concerns expressed, in<br />
October 1990 the President directed the Ministry of<br />
Power and Energy to suspend work on the proposal<br />
until all alternatives had been given careful consideration.<br />
Economic and Social Costs of Hydropower<br />
Hydropower generation is capital intensive and<br />
requires substantial foreign exchange, yet its low<br />
operating costs and overall profitability have made it an<br />
attractive energy choice. Moreover, there has been no<br />
serious problem in securing the funds for hydro<br />
development from low-interest loans or as outright<br />
grants from foreign governments or funding agencies.<br />
Hydropower generation from large dams carries a<br />
high social cost, often inundating fertile land (e.g. in the<br />
Dumbara and Kotmale valleys) and displacing many<br />
families and even whole villages. In the Dumbara valley<br />
construction of the Victoria reservoir required evacuation<br />
of nearly 6,000 families. State assistance was<br />
necessarily provided to resettle displaced families and<br />
mitigate their financial burden and cultural shock.<br />
Figure 5.5<br />
Electricity 40%<br />
Coal 0.3%<br />
A health hazard has arisen from the impounding of<br />
water and restriction of river flow. Mosquitoes breed<br />
in the stagnant pools of downstream river beds, which<br />
may be a factor responsible for the spread of malaria.<br />
Another adverse impact of impounding water upstream<br />
is the drying up of wetlands in the riverine flood<br />
plains, reducing habitat for animals, fish and birds.'<br />
Despite the social costs, with adequate mitigation<br />
measures hydropower development has substantial advantages<br />
over other forms of conventional electricity<br />
generation in Sri Lanka. Its reservoirs also provide<br />
irrigation water for thousands of hectares of land. This<br />
in turn brings more benefits as well as potential environmental<br />
and social costs including land salinization and<br />
pollution by agrochemicals.<br />
The relatively low cost of hydropower has helped<br />
meet social objectives for rural populations. The CEB<br />
is expected to function as a commercially viable<br />
enterprise, but as a government institution it must be<br />
sensitive to social needs. Hence rural electrification,<br />
although not offering attractive financial returns, is<br />
actively pursued to help improve the quality of life of<br />
the large rural population by opening avenues for rural<br />
industrial development and agricultural production.<br />
The CEB tariff structure seeks to provide a basic<br />
minimum supply of electricity to domestic consumers<br />
I<br />
I<br />
I<br />
I<br />
I<br />
I<br />
I<br />
I<br />
I<br />
I<br />
I<br />
I<br />
I<br />
I<br />
I<br />
I<br />
I<br />
I<br />
I<br />
I<br />
I
I<br />
I<br />
I<br />
I<br />
I<br />
I<br />
I<br />
I<br />
I i ;<br />
ï I<br />
I<br />
I<br />
I<br />
l<br />
I<br />
I<br />
I<br />
r<br />
at rates low-income families can afford. The latest<br />
domestic tariff for monthly bills, introduced in April<br />
1990, is 0.55 rupees per unit for the first 10 units, 1.05<br />
rupees per unit for the next 40 units, 2.00 rupees per<br />
unit for the next 50 units, 3 rupees per unit for the next<br />
350 units, and 4 rupees per unit for consumption over<br />
450 units. A fixed charge of 10 rupees is levied from<br />
households whose monthly consumption is 10 units or<br />
more, while the charge is reduced to 5 rupees where the<br />
consumption is less than 10 units. Taking into account<br />
the social needs and statutory obligations to function<br />
as an economically viable enterprise, the CEB tries to<br />
maintain a modest 8 percent return on the revalued<br />
capital assets.<br />
PETROLEUM SUPPLY<br />
AND DEMAND<br />
Supply and Processing<br />
In 1988 oil supplied 59 percent of Sri Lanka's<br />
commercial energy as shown in Figure 55. Although<br />
there has been limited exploration for oil on-shore and<br />
off-shore, no indigenous sources have been found.<br />
Hence, the country has had to rely on imported crude<br />
oil and refined products to meet demand.<br />
The Ceylon Petroleum Corporation (CPC) is the<br />
sole importer and processor of petroleum products.<br />
Because the government establishes domestic prices no<br />
direct relationship exists between international crude<br />
oil prices and the domestic price of refined products.<br />
Prices were increased gradually during the 1970s as<br />
international oil prices rose. Between 1981 and 1989 the<br />
government raised the local price of refined products<br />
twice, a 40 percent increase for most products in 1983,<br />
and a 20-25 percent increase in 1989. In response to<br />
Iraq's invasion of Kuwait in August 1990, the government<br />
raised the local price of petrol from 20 rupees to<br />
25 rupees per liter, and in November 1990 to 35 rupees<br />
per liter.<br />
Sri Lankan refinery capacity. Since 1969 crude oil<br />
has been processed at a refinery in Sapugaskanda with<br />
a capacity of 50,000 bbl/day. Originally designed to<br />
process Iranian light crude, after foreign exchange constraints<br />
and supply uncertainties it was redesigned to<br />
process other crude oils as well. Countries and crude<br />
Energy Resources 77<br />
oils supplying Sri Lanka are Abu Dhabi (Upper Sakus),<br />
Egypt (Suez Blend), Iran (Iranian Light), Malaysia<br />
(Mirri/Tapis), Oman (Oman), Saudi Arabia (Arabian<br />
Light), Qatar (Qatar Marine), and, until the recent<br />
embargo, Iraq (Basrah Light).<br />
The refinery meets most domestic demands for<br />
petroleum products, with the shortfall, primarily in auto<br />
diesel, met by spot purchase. As demand for Liquid<br />
Petroleum Gas (LPG) increased, the supply shortfall<br />
was met by imports. Proposed plant modifications will<br />
enable the refinery to meet demands for auto diesel and<br />
double the production of LPG by 1992. Excess production,<br />
largely fuel oil, is exported directly.<br />
Sources of Demand<br />
Transportation dominates the consumption of<br />
petroleum products (Figure 5.6). Approximately 60<br />
percent of finished oil products supplies motor<br />
vehicles. In industry, the largest demand for petroleum<br />
comes from cement, tea, paper, steel, tire, and glass<br />
manufacturing (GEB, 1990). Foreign demand is comprised<br />
of aviation fuel and bunker oil.<br />
Local sales of super petrol, auto diesel and super<br />
diesel have generally risen since 1983; the decrease in<br />
1989 reflected an increase in local price (Figure 5.7).<br />
Transportation largely consumes diesel fuel (Figure<br />
5.8); the public transportation service relies on it and<br />
the policy of pricing it below gasoline has stimulated<br />
imports of a high proportion of diesel vehicles.<br />
Bus service — public (SLTB) and private — accounts<br />
for over 80 percent of the passenger traffic in Sri<br />
Lanka. Operations have been greatly affected by civil<br />
instability, the 1988 SLTB fleet size decreased by 13<br />
percent from its 1984 peak -- from 8,005 down to 6,996,<br />
which is now lower than the 7,254 existing in 1979.<br />
Consumption of diesel fuel for the SLTB declined to<br />
21.2 million gallons per annum for 1988 but may rise to<br />
23.5 million gallons in 1990.<br />
Petroleum usage in industry has significantly<br />
declined since 1984, except for supplies required for<br />
thermal electricity generation to meet hydroelectric<br />
shortfall from drought in 1986 (Figure 5.9). Several<br />
factors contributed to the decline. Civil instability<br />
slowed economic growth, industries switched to
78<br />
600<br />
500-<br />
400-<br />
300-<br />
200-<br />
100-<br />
(000 M.T.)<br />
Energy Resource<br />
Use of Petroleum Products<br />
Transportation<br />
62.91%<br />
Figure 5.6<br />
Other<br />
37.09%<br />
Petroleum Sales<br />
I I I I I<br />
n n<br />
8 =I<br />
1982 1983 1984- 1985 1986 1987 1988 1989<br />
Hi Super Petrol<br />
IX ~i Super Diesel<br />
(ZD Auto Diesel<br />
Kerosene-<br />
Figure 5.7<br />
HUH Heavy Diesel<br />
Furnace Oil<br />
I<br />
I<br />
I<br />
I<br />
I<br />
I<br />
I<br />
I<br />
I<br />
I<br />
I<br />
I<br />
I<br />
I<br />
I<br />
I<br />
I<br />
I<br />
I<br />
I<br />
I.
I<br />
I<br />
I<br />
I<br />
I<br />
I<br />
I<br />
I<br />
I I<br />
n I<br />
I<br />
I<br />
I<br />
I<br />
I<br />
I<br />
I<br />
I I<br />
C000 M.T.)<br />
Energy Resources<br />
Transportation<br />
Avtur<br />
4.7%<br />
I<br />
. \ ^ ^ ^ ^<br />
Fuels<br />
Figure 5.8<br />
^ \ Super Petrol<br />
X 25.5%<br />
^^^^J—— Other<br />
^ 0.2%<br />
Industrial Petroleum Demand<br />
Including CEB Demand<br />
1980 1981 1982 1983 1984 1985 1986 1987 1988 1989<br />
Furnace- Oil I Heavy Diesel<br />
Figure 5.9<br />
79
80<br />
250<br />
200<br />
150<br />
100<br />
50<br />
('000 M.T.O)<br />
Energy Resource<br />
Domestic Petroleum Demand<br />
1978 1979 1980 1981 1982 1983 1984 1985 1986 1987 1988<br />
(000 M.T.)<br />
700<br />
600<br />
500<br />
400<br />
300<br />
200<br />
100<br />
0<br />
1989 1990 1991<br />
I I Qasolin»<br />
ES3 Kerosene<br />
I I Kerosene Hi LP Gas<br />
Figure 5.10<br />
Petroleum Forecast<br />
Excluding CEB Demand<br />
1992<br />
Auto Diesel<br />
Heavy Diesel<br />
Figure 5.11<br />
1993 1994<br />
LP Gas<br />
EEEB Fuel Oil<br />
1995<br />
I<br />
I<br />
I<br />
I<br />
I<br />
I<br />
I<br />
I<br />
I<br />
I<br />
I<br />
I<br />
I<br />
I<br />
I<br />
I<br />
I<br />
I<br />
I<br />
I
I<br />
I<br />
I<br />
I<br />
I<br />
I<br />
I<br />
I<br />
I<br />
I<br />
1<br />
I<br />
I<br />
I<br />
I<br />
r Energy<br />
electric energy following completion of the Mahaweli<br />
dams, and some industries switched to biomass as a<br />
cheaper source of fuel. The share of industrial energy<br />
from biomass increased from 69.4 percent in 1978 to<br />
75.9 percent in 1987. Major efforts were made in the<br />
early 1980s to promote fuel efficiency and reduce industrial<br />
and commercial waste of energy.<br />
Oil products for domestic consumption are<br />
kerosene and LPG gas (Figure 5.10). Use of kerosene<br />
for lighting has decreased from approximately 82 percent<br />
of households in 1981 to 763 percent in 1988. The<br />
decline can be attributed to the expansion of the rural<br />
electrification during this period. Demands for LPG<br />
gas have increased significantly over the past few years<br />
as a relatively inexpensive cooking fuel compared to<br />
electricity.<br />
The forecast for petroleum products ( Figure 5.11),<br />
excluding demand from the Ceylon Electricity Board<br />
(CEB) for thermal generation, indicates that the fastest<br />
growth in demand is expected for gasoline and LPG.<br />
Demand for aviation fuel will depend largely on tourist<br />
business. Bunker oil demand depends on the bunker<br />
prices at Singapore and Middle East ports, and demand<br />
for fuel oil will depend on the proposed diesel generation<br />
plants to be established in the future and the<br />
industrial practices of fuel substitution.<br />
Consumption<br />
BIOMASS FUEL<br />
Biomass provides cooking fuel for 94 percent of Sri<br />
Lankan households and, in addition, the source of heat<br />
for many small industries. Biomass fuel accounts for 70<br />
percent of the primary energy consumed in Sri Lanka.<br />
In 1983, a statistically designed study of household<br />
fuel consumption provided a wealth of new, badly<br />
needed data. It found that total biomass fuel consumption<br />
by households in 1983 was 7.5 million tons (air dry,<br />
ready-to-use condition), which is 35 percent higher<br />
than previous assumptions. Per capita consumption of<br />
biomass fuel for household cooking was 4% kilograms<br />
per year for the island as a whole and 526 kg per year<br />
for the rural sector, which used biomass fuel exclusively.<br />
Two years later, in 1985, the Forestry Resources<br />
Development Project estimated biomass consumption<br />
Resources 81<br />
at 7.8 million tons. Assuming a 1.5 percent annual<br />
growth since then, the 1990 consumption would be 8.21<br />
million tons.<br />
Many industries (tea, rubber, desiccated coconut,<br />
bricks, tiles) use woodfuel as the source of heat. The<br />
total consumption in 1988 was estimated at 1.15 million<br />
tons, or about a seventh of the biomass fuel consumed<br />
by households. (See Figure 5.12).<br />
Future Demand Trends<br />
Growth rates in biomass fuel consumption coincide<br />
with population growth of 1.5 percent. The<br />
population growth rate is forecast to decrease until<br />
within three to four decades population stabilizes.<br />
Substitution of oil, electricity, or liquified petroleum<br />
gas (LPG) for biomass fuel in household cooking will<br />
probably not appreciably reduce per capita consumption<br />
of biomass fuel in the 1990s.<br />
Programs of the Ministry of Power and Energy,<br />
among others, promote fuel-efficient woodfuel stoves<br />
in place of the traditional three-stone open Tire and the<br />
semi-enclosed mud stove. If, as expected, these<br />
programs continue successfully, they could significantly<br />
reduce per capita consumption of fuelwood. Taking<br />
into account decreasing population growth rates and<br />
the expected decrease in per 'capita consumption of<br />
biomass fuel, growth in biomass fuel consumption by<br />
households may steadily decline from its present 1.5<br />
percent. Figure 5.13 depicts three alternative consumption<br />
scenarios given in the Forestry Master Plan.<br />
Over a million households may well replace their traditional<br />
mud stoves or three-stone open fires with fuelefficient<br />
cook stoves by the year 2000. If so, the<br />
projected biomass fuel demand by the household sector<br />
should follow path 2, or possibly path 3. By the year<br />
2000, the difference in biomass requirements per year<br />
between scenario 3 and 2 is equivalent to a 10-year-old<br />
forest plantation of 2,500 hectares.<br />
Annual demand for fuelwood by industries, now<br />
standing at 1.15 million tons, will also grow, but probably<br />
at a slower rate than the growth in the industries<br />
themselves owing to expected introduction of energysaving<br />
technologies. The Forestry Master Plan<br />
forecasts industrial demand to peak around the year<br />
2000, at 1.28 million tons and to drop slowly there after.
82<br />
Energy Resource<br />
Distribution of Biomass Fuel Consumption<br />
Rubbers«/. Other 4 V.<br />
Small hotels,<br />
Brick, bating houses<br />
Total biomass fuel consumption Biomass fuel in industry<br />
10-0<br />
as<br />
1<br />
r<br />
8.5<br />
ao<br />
•<br />
; ^<br />
I984-«S<br />
Figure 5.12<br />
Alternative Biomass Fuel Demand Projections<br />
Y*ar<br />
+—<br />
Rgure5.i3<br />
1 -<br />
2000<br />
I
I<br />
I<br />
I<br />
I<br />
I<br />
I<br />
I<br />
I<br />
I<br />
I<br />
I I<br />
I<br />
I |I<br />
1<br />
I<br />
I<br />
I<br />
I I<br />
Sources of Biomass Fuel<br />
The 1983 household biomass fuel survey revealed<br />
that rubber wood accounted for 18 percent of the consumption,<br />
crop wastes 28.8 percent, and other wood<br />
fuel 53.2 percent. Crop wastes consisted mainly of<br />
coconut tree wood, fallen fronds, husks and shells.<br />
Other crop wastes included uprooted tea bushes,<br />
manioc and cinnamon sticks, arecanut wood, and<br />
paddy husks. All biomass fuel not within categories of<br />
rubber wood and crop wastes were placed in a third<br />
category of "other fuelwood."<br />
Rubber and coconut plantations are found in four<br />
distinct agro-ecological regions, and their contribution<br />
to fuel supply is of special importance. The proportions<br />
of the different types of biomass fuel consumed by<br />
households in each of the zones are shown in Figure<br />
5.14. In the most densely populated southwest sector<br />
plantation coconut and rubber play a crucial role in<br />
meeting the energy demands.<br />
In rural areas the vast majority of households (80<br />
percent) gather all their own biomass fuel. Most urban<br />
households purchase at least a part of their requirements.<br />
Only a small proportion of household collection<br />
exceeded one mile (1.6 km). Because in most places no<br />
high forest is close to villages, many collections are<br />
apparently made from crop plantations or waste- and<br />
scrub-land. However, in many hill country areas fuelwood<br />
does come from natural forests, causing severe<br />
forest degradation.<br />
Of the three categories of biomass fuel referred to<br />
in the biomass study, "other fuelwood" accounts for 53.2<br />
percent of consumption. This category includes fuelwood<br />
from the forest and all biomass fuel gathered<br />
from waste, scrub-land and private lands (excluding<br />
rubber wood and crop wastes). The proportion coming<br />
from the forest cannot be large given the presence of<br />
biomass fuel from other closer sources. A reasonable<br />
assumption is that, taking the total consumption of<br />
biomass fuel by households, the proportion coming<br />
from high forest amounts to 20 to 25 percent, including<br />
the official supplies of the State Timber Corporation.<br />
Only recently has Sri Lanka used charcoal as a<br />
household fuel. Availability of large quantities of low<br />
quality wood in forests cleared under the Mahaweli<br />
Energy Resources 83<br />
scheme prompted the State Timber Corporation to<br />
produce charcoal for domestic use and export. Because<br />
charcoal had not been used previously as a<br />
household fuel, the project included plans to develop<br />
and produce an inexpensive charcoal cooker and to<br />
make charcoal popular for cooking. The target group<br />
was urban households.<br />
In contrast to households where an appreciable<br />
proportion of biomass fuel consists of sticks, twigs,<br />
coconut fronds, and similar material, industries use<br />
biomass in woodfuel billets. Industries obtain 49 percent<br />
of their biomass fuel from rubber wood, and 38<br />
percent from natural forests. The balance comes mostly<br />
from forest plantations, home gardens and estate<br />
cuttings, while a small part consists of crop wastes such<br />
as paddy husks and bagasse.<br />
Future Trends in Supplies<br />
At present, Sri Lanka has no overall shortage of<br />
biomass fuel, but regional deficits occur in Colombo<br />
and in the hill country. Fortunately in the rural areas,<br />
where cooking relies entirely on biomass fuel, it is<br />
generally available. Over the past decades, several<br />
hundred thousand hectares of natural forest have been<br />
converted to scrub-land, and these areas, provide useful<br />
woodfuel pickings for villagers. However, jf, as<br />
recent trends indicate, large areas of waste land are put<br />
to other economic use, this will reduce areas available<br />
for woodfuel. Moreover, as economic conditions improve,<br />
the people may neither have time nor inclination<br />
to gather fuelwood, so they may purchase the material.<br />
Such trends are already observable in new settlement<br />
areas. In the future, therefore, biomass fuel supplies<br />
from traditional sources will probably decline and<br />
demand for woodfuel through commercial channels<br />
will grow. Steps will then be needed by the Forest<br />
Department in particular to raise fuelwood plantations<br />
in strategic locations.<br />
In Colombo and other urban and suburban areas<br />
in the southwest, rubber plantations taken up for<br />
replanting provide a substantial proportion of the fuelwood<br />
needs. Yet this wood also, when chemically<br />
treated, has served as furniture wood for local and<br />
export markets. If promising trends continue, fuelwood<br />
supplies will require new fuelwood plantations.
84 Energy Resource<br />
ENERGY EFFICIENCY - <strong>SRI</strong> <strong>LANKA</strong>'S CHEAPEST ENERGY<br />
RESOURCE<br />
How can Sri Lanka meet its needs for new, environmentally benign energy supplies to fuel social and<br />
economic development? Significant new supplies can come from greater energy efficiency.<br />
Sri Lanka's energy consumption in 1989 was roughly 6 million tons of oil equivalent - per person less<br />
than one-fifteénth that of some industrialized countries. Approximately 87 percent of the country's energy<br />
demand is met by fuelwood and imported oil, the remainder by hydroelectric power. Given widespread<br />
public concern-over the environmental impacts of new large-scale hydro projects and coal-fired power<br />
plants, the government is committed to developing new and renewable energy resources.<br />
Energy efficiency may be one of Sri Lanka's promising sources of energy. Energy planners often<br />
ignore the fact that society values energy not for its own sake but for the services that energy provides.<br />
Kilowatt-hours of electricity, barrels of oil, and bundles of fuelwood are important only for the light, heat,<br />
and. motive power they generate. By improving the efficiency of energy use — increasing the services<br />
derived from energy already consumed -- we gain an eminently feasible complement to other new energy<br />
supplies. Many countries have found that tapping energy efficiency resources is typically less expensive<br />
than importing oil and building new power plants - and environmentally preferable as welL<br />
Studies suggest that Sri Lanka's energy efficiency resources are at this point plentiful and potentially<br />
cheaper than other energy supplies. A 1985 analysis by the Senior Energy Advisor to the President, Dr.<br />
Mohan Munasinghe, found that modest energy savings — ranging from 5-15 percent among industries,<br />
buildings, hotels, residences and street lighting—would reduce expected peak electricity demand by 15-23<br />
percent in the coming years (Munasinghe, 1988). Initial detailed energy audits of 16 industrial plants, one<br />
hotel and one hospital were carried out under a joint World Bank/UNDP study (ESMAP, 1986). Many<br />
of the energy-saving measures identified had a lower cost per unit of energy saved than the cost of an equal<br />
unit of imported oil or new power generation capacity. Actual savings could be considerably higher by<br />
applying currently available, state-of-the-art technologies. Two environmental NGOs, the Environmental<br />
Foundation Ltd. (Sri Lanka) and the Natural Resources Defense Council (U.S.A.), are currently undertaking<br />
a joint study of Sri Lanka's energy efficiency potential, based on modern technologies. Participating<br />
institutions include the Ministry of Energy Conservation, the National Engineering Research and<br />
Development Centre, the Sri Lanka Energy Managers Association, and the Development Finance<br />
Corporation of Ceylon.<br />
Sri Lanka has a national energy conservation program which includes educational campaigns, energy<br />
audits, and a subsidized loan fund, but unfortunately it has been less successful than expected. One<br />
reason: along with advice and technical assistance, energy consumers need more incentives to invest in<br />
energy-saving technologies. When choosing a motor, a cookstove, a light bulb, an air-conditioner, or a<br />
refrigerator, many consumers cannot afford the more efficient, but higher-priced, model. Higher-income<br />
consumers are often indifferent to potential long-run cost savings. Several steps would help Sri Lanka<br />
improve development of its energy efficiency resources:
I<br />
I I<br />
I<br />
I<br />
I<br />
I<br />
I<br />
I<br />
i<br />
É<br />
I<br />
1<br />
I<br />
Energy Resources 85<br />
• Integrated "Least-Cost" Planning. Energy planners can examine the potential for saving<br />
electricity, fuelwood, and oil throughout Sri Lanka's economy by adopting state-of-the-art energysaving<br />
technologies. The cost of the energy-saving measures should be calculated per unit of energy<br />
saved so that the cost of energy efficiency resources can be compared to the cost of other energy<br />
supplies.<br />
• Enhanced Efficiency Programs. Energy sector institutions, particularly the CEB, can provide<br />
grants or low-interest loans to customers for the added first cost of efficient equipment Repayment<br />
could be included in the customer's monthly bills.<br />
• Efficiency Standards and Labels. The government could set minimum efficiency standards for all<br />
domestic and imported appliances, industrial equipment, automobiles, and new buildings. Standardized<br />
testing facilities would be required. All tested equipment would bear efficiency rating<br />
labels to help customers choose among competing models.<br />
Efficiency improvements alone are unlikely to satisfy all of Sri Lanka's future energy needs. Further<br />
development of new power supplies may be necessary. Nevertheless, an efficiency-based energy strategy<br />
would decrease needs for new power generating capacity and reduce environmental degradation.<br />
Moreover, improved energy efficiency would invariably lead to improved economic productivity as well.<br />
Box prepared by Kristin Wulfsberg, Energy Consultant to the Environmental Foundation Ltd., and<br />
Glen T. Prickett, Research Associate with the Natural Resources Defense Council (USA).<br />
The Forestry Master Plan recommends that fuelwood<br />
for domestic use should be increased through<br />
farmers' woodlots. In addition, the Department may<br />
need its own program of fuelwood plantations where<br />
shortages of biomass fuel for domestic needs are likely<br />
to occur.<br />
To meet industrial demands individual plants will<br />
increasingly require large quantities of fuelwood from<br />
their own plantations. The Forestry Master Plan<br />
recommends block fuelwood plantations raised by industries<br />
that use woodfuel. The Janatha Estates<br />
Development Board has demonstrated that such<br />
schemes can be successful; in recent years it has raised<br />
several thousand hectares of fuelwood plantations.<br />
Economic and Social Costs of Fuelwood<br />
Eighty to ninety percent of the biomass fuel consumed<br />
by households is obtained by gathering without<br />
monetary transaction. In rural areas it is generally<br />
available at no great distance from the home, and often<br />
the home garden itself provides a good part of the<br />
biomass fuel requirements.<br />
In some urban and suburban households too the<br />
home garden provides a part of the biomass fuel, but<br />
most fuelwood must be purchased. In Colombo the<br />
price of fuelwood in January 1990 was about 50 rupees<br />
per load of 51 kilograms. At current prices, fuelwood<br />
is cheaper than alternative fuels. The in situ price of<br />
fuelwood is very low, and its price to the urban consumer<br />
is determined mainly by the cost of transport.<br />
Hence, as the cost of lorry hire increases fuel wood<br />
costs also increase.<br />
Other Biofuel Resources<br />
Besides the traditional resources, other biofuels<br />
offer potential. One is coir dust from the coconut husk.<br />
When fibre is extracted, the husk yields as a by-product<br />
a large quantity of soft tissue ("pith") mixed with short<br />
fibres. This may make up as much as 60 percent of the<br />
weight of the air-dry husk. The coir dust now collects<br />
as large heaps of unwanted material around fiber mills,<br />
causing environmental pollution. It could be converted<br />
to briquettes for use as fuel, but at present the cost<br />
exceeds the price of fuelwood. Some of this material<br />
can provide fuel for future small-scale thermal power
86 Energy Resource I<br />
Biomass Fuel Survey - Agro-Ecological Zones and Percentage Compositior<br />
Of Biomass Fuel Types used in Each Zone<br />
MLuti<br />
Zm ttmiwr<br />
CI9R Mod«<br />
«««ram<br />
»M4IMMII<br />
Figure 5.14<br />
Energy Efficient Cook Stoves<br />
Sorvodoyo Mod«4<br />
Rgure 5.15<br />
lOa Mod*<br />
NEROC*ntre Model
I<br />
I<br />
I<br />
I<br />
I<br />
I<br />
1<br />
I<br />
p<br />
1<br />
I<br />
I<br />
Paddy husk is another little-used biofuel. About<br />
500,000 tons are produced annually, some of which is<br />
used for household cooking by families living near rice<br />
mills, and as a source of heat for parboiling paddy. The<br />
vast bulk is burnt off unused. It is a potential resource<br />
that can be used when traditional fuels become scarce<br />
or expensive.<br />
MAIN ISSUES AND<br />
INSTITUTIONAL RESPONSES<br />
In 1982 an Energy Adviser to the Minister of<br />
power and Energy (a position then held by the President)<br />
was appointed to establish an organizational<br />
framework for integrated energy planning, create and<br />
develop analytical procedures, and train the manpower<br />
necessary for planning. The tasks were largely achieved<br />
during the ensuing three years.<br />
In 1985, a non-governmental Sri Lanka Energy<br />
Manager's Association, was formed to upgrade energy<br />
management skills in the private sector, carry out energy<br />
audits, and take effective measures for saying energy<br />
in industry. That same year the Ministry of Power and<br />
Energy created an Energy Conservationor Energy<br />
Conservation fund to provide financial assistance for<br />
improving energy utilization and promote the use of<br />
alternative energy resources. A Project Ministry for<br />
Energy Conservation was created in March 1990 to<br />
promote identified energy conservation programs.<br />
Electricity<br />
By 1992, Sri Lanka will have Japped all its major<br />
hydropower resources, and further development must<br />
then focus on medium, small and mini hydro resources,<br />
thermal generation, and other options. The government<br />
is considering several options. Many smallscalehydropower<br />
sites could be developed, and costs<br />
may be and costs may be attractive if oil prices for<br />
thermal generation continue to rise. The GTZ has<br />
pointed out that hydro development will create several<br />
thousand more jobs and avoid more pollution than<br />
comparably sized oil-powered units. However, supplementary<br />
thermal generation will still require gas,<br />
diesel or coal-fired plants. In addition, 10 to 15 MW<br />
Energy Resources 87<br />
electricity generating units may be distributed in the<br />
coconut growing areas using coir dust for fuel.<br />
It is the general view of energy planners that over<br />
the next ten years large thermal power stations will need<br />
to be introduced into the generation system to meet<br />
projected demands and backup requirements. However,<br />
it is not clear how this can be achieved, because<br />
the most recent attempt to install a coal-fired power<br />
station on the southwest coast has been stopped because<br />
of environmental considerations. Among the<br />
range of available alternatives is the hitherto overlooked<br />
possibility of increasing generation capacity of<br />
existing hydropower systems, which now generate an<br />
average of only 3,375 GWh per year, with installed<br />
capacity of 1017 MW. Increased capacity could be<br />
achieved by regulating the inflow into the reservoirs ~<br />
a well-known function of forests. Increasing the percentage<br />
of forest cover in the catchment area is therefore<br />
vitally necessary.<br />
Conservation<br />
While recognizing needs for increased generation<br />
capacity, it is important for the national economy that<br />
electricity conservation measures be adopted in all sectors.<br />
In the manufacturing industry, for example, outdated<br />
and faulty equipment results in a considerable<br />
waste of energy. Energy audits should be carried out<br />
routinely in factories to indicate where waste occurs<br />
and the corrective action needed. Significant energy<br />
savings could often be effected with simple housekeeping<br />
improvements where the pay-back period is only a<br />
matter of weeks.<br />
Hotels can also save energy. They have stimulated<br />
rapid growth in electricity demand. A large luxuryclass<br />
hotel consumes as much electricity as a provincial<br />
town. Although hotels must be maintained to attract<br />
international tourists, it is still possible to reduce<br />
electricity consumption. For example, large quantities<br />
of water could be heated to 60°C using direct solar<br />
energy. Locally produced solar heaters are available<br />
but not widely used. By adjusting the tariff structure,<br />
hotel owners can be encouraged to reduce excessive<br />
electricity use.
88<br />
100 Thousand«<br />
Energy Resource<br />
Registration of New Vehicles<br />
by Fuel Type from 1970 - 1989<br />
70 71 72 73 '74 '76 76 77 78 79 80 '81 82 '83'84 '85 '86 87 '88 '89 '90<br />
YEAR<br />
* Estimated registration<br />
••Petrol<br />
douroti Doportmont of Motor Trafflo<br />
Although the Rural Electrification Programme<br />
receives high government priority, rural households are<br />
generally too poor to pay for service connections and<br />
internal wiring. Electric supply has also failed to stimulate<br />
rural industries as much as expected. To help<br />
resolve these problems the government has introduced<br />
a package of incentives to help domestic consumers and<br />
entrepreneurs in rural areas, including low-interest<br />
loans, easy repayment terms, low-cost service connections,<br />
and internal wiring provided by the CEB.<br />
Phase II of the Rural Electrification Programme,<br />
now in progress, will provide electricity to 600 more<br />
villages and augment supplies to 600 others. Plans are<br />
also being prepared for Phase III, so that by the year<br />
2000 all villages in the country will be either connected<br />
to the electricity grid or provided with another assured<br />
source of energy.<br />
Biomass fuel<br />
The general availability of biomass fuel in the<br />
country today should not discouragethe development<br />
of resources and conservation measures.<br />
Because traditional cooking stoves and three-stone<br />
open fires used by the large majority of households<br />
Figure 5.16<br />
Diesel CD OTHER 199o > 100,000<br />
TotalVehicles 1990= 687,676<br />
waste biomass fuel, many institutions, both government<br />
and non-government, have encouraged use of improved,<br />
fuel-efficient stoves (see Figure 5.15.)<br />
Whereas traditional cooking methods obtain 8 to 14<br />
percent useful heat, some improved cookers obtain 35<br />
percent. Several programs now propagate use of these<br />
cookers. Under one program the Ministry of Power<br />
and Energy has replaced traditional cookers with a<br />
two-burner cooker in over 200,000 rural households in<br />
over 13 administrative districts. Continuation of this<br />
program, together with the sale of other models pf<br />
improved cookers through private outlets, could result<br />
in over a million households changing to fuel-efficient<br />
cookers before the year 2000.<br />
Technologies adapted for use in Sri Lanka by the<br />
National Engineering Research and Development<br />
Centre, are biomass gasifiers for tea leaf drying and<br />
smelting brass, windmills to charge batteries for domestic<br />
lighting, and bread baking ovens which save biomass<br />
fuel. The Water Resources Board developed a windmill<br />
for pumping water for irrigation. The dramatic fall in<br />
the price of oil in the mid-1980s slackened efforts to<br />
stimulate renewable energy. The rapid oil price rise<br />
following the Persian Gulf crisis illustrates how<br />
short-sighted this neglect has been.<br />
I<br />
I<br />
I<br />
I<br />
I<br />
I<br />
I<br />
I<br />
I<br />
I<br />
I<br />
I<br />
I<br />
I<br />
I<br />
I<br />
I<br />
I<br />
I<br />
I<br />
I,
I<br />
I<br />
I<br />
I<br />
I<br />
I<br />
I<br />
I<br />
I<br />
I<br />
j<br />
1<br />
i<br />
I<br />
1<br />
I<br />
I<br />
I<br />
I<br />
I<br />
I<br />
I<br />
I<br />
r<br />
Energy Resources 89<br />
Air Pollution<br />
Air pollution is one of the chief by-products of energy production and consumption, but in Sri Lanka<br />
it also results from chena fires and burning of refuse. Unfortunately, we lack reliable information on the<br />
amounts of air pollution produced in Sri Lanka and how it affects human health and the environment. Yet<br />
the problem has become increasingly serious in urban areas, and public concern for cleaner air is growing.<br />
The Colombo district, where two-thirds of the population is urban, accounts for over 60 percent of<br />
the manufacturing industries, 60 per cent of registered vehicles and both diesel power plants. Hence, the<br />
most significant air pollution is generated primarily in this region.<br />
SOURCES <strong>OF</strong> POLLUTION<br />
The major air pollution sources are summarized below:<br />
Stationary Sources<br />
The domestic sector, at nearly 69 percent of the total, is the primary energy consumer. Its contributions<br />
to air pollution result from domestic cooking and lighting fueled by wood, electricity, kerosene, and gas.<br />
Overall pollution is insignificant, but domestic health impacts of fuelwood and kerosene burning have not<br />
been measured.<br />
Industrial processes, consuming about 17 percent of total energy, also contribute particulates and gases<br />
to the atmosphere. A 1989 survey found that over 4,000 manufacturing facilities had potential for air Or<br />
water pollution. About 40 percent are chemical, food and textile plants using fuelwood or furnace oiL and<br />
nearly 25 percent are quarrying and mining activities. A well-known example of industrial air pollution is<br />
the Puttalam cement works, which belched tons of paniculate matter into the environment, degraded<br />
surrounding agricultural fields and may have caused health problems (see Chapter 4 - The Price of<br />
Pollution). Despite such cases, the industrial survey indicated that industry has low emission levels and<br />
is localized in areas of dense population; water pollution is still a more significant industrial problem than<br />
air pollution.<br />
Power génération. Sri Lanka's electricity generation, largely hydro, includes two diesel generating<br />
units with a total capacity 260 MW in the Colombo metropolis. Additional units are being planned to<br />
augment hydro supplies. There are 21 generating facilities, with capacities ranging from 1 MW to 25 MW,<br />
located in four power stations, which use gas, heavy oil and diesel as fuel. As yet, however, no large thermal<br />
power plants have been built in Sri Lanka, so air pollution from power generation remains low.<br />
Refiisebuming. Open burning of domestic and industrial refuse is widespread Particularly in urban<br />
areas the resulting pollution is a well-recognized public nuisance.<br />
Mobile Sources<br />
The transport sector, accounting for 12 percent of Sri Lanka's energy consumption in 1989, and 60<br />
percent of all petroleum consumption, causes the most serious air pollution due to its concentration in<br />
populated areas. In 1990,60 percent of the country's more than half a million registered motor vehicles<br />
were concentrated in the Colombo district
90<br />
Energy Resource<br />
The number of vehicles registered annually in Sri Lanka between 1970 and 1990 increased 14-fold<br />
(see Figure 5.16); Fuel is primarily petrol or diesel, refined locally from imported crude oil by the Ceylon<br />
Petroleum Corporation. Sulphur content in refined fuel is maintained below 0.1 and 1.1 percent by weight<br />
respectively for petrol and diesel. Lead in the form of tetraethyl is added to refined oil at the r-ate of 034<br />
to 0.55 grams per liter. Consumption rates recorded by the Ceylon Petroleum Corporation between 1970<br />
and 1986 (Figure 5.17) show that petrol consumption has declined marginally, but consumption of diesel<br />
has doubled due to the increased number of private buses.<br />
Vehicles account for nearly all the pollution resulting from petroleum consumption in Sri Lanka,<br />
based on estimates of 1989 consumption and WHO and US Environmental Protection Agency emission<br />
factors. Of all petroleum combustion emissions, vehicles produce 98 percent of the carbon monoxide, 92<br />
percent of the hydrocarbons, 79 percent of the oxides of nitrogen, 75 percent of particulates, and 46 percent<br />
of the sulphur dioxide. Buses and trucks are the major offenders, responsible for two-thirds or more of<br />
all vehicle emissions other than carbon monoxide.<br />
Recognizing the growing vehicle pollution problem, the government appointed a committee of experts<br />
in 1987 to draw up plans to combat vehicular emissions. As yet none of the 20 committee recommendations<br />
have been implemented.<br />
AIR QUALITY MONITORING<br />
The first major effort to monitor air quality began in early 1989 when the National Building Research<br />
Organization initiated its three-year Colombo Air Quality Monitoring Program (CAMP): Phase I<br />
requires a preliminary assessment of Colombo City air quality through determinations of sulphation rates,<br />
measured by concentration of sulphur compounds like sulphur dioxide, sulphur trioxide, and hydrogen<br />
sulphide, and dustfall, measured by the total settleable dust in the atmosphere. Locations showing adverse<br />
air quality will be monitored in Phase II to measure suspended paniculate matter; SO2 and NOx. The<br />
joint CEA/NBRO program is a necessary first step toward several objectives: to establish a database for<br />
Colombo City, to formulate National Air Quality Standards; and to establish a permanent monitoring<br />
station.<br />
In. the first phase, nearing completion, 52 locations were selected for continuous monitoring, and<br />
year-long data are now available for 39 of these. To facilitate simultaneous monitoring of sulphation rates<br />
and dustfall, the NBRO delineated individual sampling units, with monitoring stations about 0.8 kilometers<br />
apart. Results showed that sulphation rates- ranged between 0.04 and 0.45 milligrams per 100 square<br />
centimeters. The highest level was obtained from a sampling station located in the Kollupitiya commercial<br />
area. Dustfall measurements showed the highest value of 1,4715 milligrams per square meter per day at<br />
a station near the Colombo NorthIndustrial Zone in Grandpass» while a station in Narahenpitarecorded<br />
the lowest value of 139.70 milligrams per square meter per day,. .<br />
The following criteria were adopted to classify air quality in identifying Phase II locations:<br />
Excellent: Dustfall less than 200 milligrams per square meter per day and sulphation rate less than<br />
0.1 milligrams per 100 square centimeters per day. • . !:: . . . ;<br />
Moderate? Dustfall 200-300 milligrams per square meter per day and sulphatibff rate less, thaa 0.1-<br />
0.2 milligrams per 100 square centimeters.. ; . , J? T : :";^ï:;J--:~ 'J-^~: '";"'' V^ ''^iS"'--.-•.-
I<br />
I<br />
I<br />
I<br />
I<br />
I<br />
I<br />
I<br />
I<br />
I<br />
I<br />
I<br />
p II<br />
I !<br />
I<br />
r<br />
Energy Resources 91<br />
Unsatisfactory: Dustfall more than 300 milligrams per square meter per day and sulphation rate more<br />
than 0.2 milligrams per 100 square centimeters.<br />
Monitoring results rated 18 locations as excellent, 12 as moderate and 9 as unsatisfactory. All<br />
unsatisfactory locations were situated in commercial/industrial areas or at major traffic intersections.<br />
Preliminary monitoring of SPM, SO2, NOX and CO has commenced at these 9 locations.<br />
INSTITUTIONAL AND LEGAL FRAMEWORK<br />
Legal instruments. The National Environmental Act of 1980 as amended in 1988 prohibited pollution<br />
discharge into the environment. Sections 23J and K prohibit emission of pollutants into the atmosphere.<br />
The CEA is charged with establishing and enforcing the pollution law through regulatory requirements,<br />
and the National Environmental (Protection and Quality) Regulations of 1990 now prohibit the discharge<br />
of wastes into the environment Discharge standards have been prescribed only for liquid wastes, however,<br />
so stationary sources of significant air pollution remain difficult to regulate. Moreover, the regulations<br />
do not address vehicle pollution.<br />
Institutions. Although the CEA is charged with preserving air quality, its expertise in air quality<br />
management needs to be expanded and improved. CEA has designated the NBRO as lead agency for air<br />
quality monitoring. Other agencies will also be involved, including the Ceylon Institute of Scientific and<br />
Industrial Research (CISIR), which is capable of monitoring ambient air quality and source emission, and<br />
the Division of Occupational Health, which monitors the workplace environment.<br />
Sri Lanka's limited air pollution controls contrast with the increasingly tight regulations in developed<br />
countries, including stringent emission controls over the growing numbers of vehicles. The United States<br />
requires lead-free petrol and (since 1975) emission control devices on all new cars. Japan, Canada, and<br />
several European countries also have rigorous vehicle emission controls. These measures require new<br />
technology and efficient inspection and enforcement systems. In the Third World, however, similar<br />
investment in vehicle pollution control has appeared too costly, even though vehicles cause increasingly<br />
severe air pollution in cities like Bangkok, Cairo, Jakarta and Mexico City.<br />
FUTURE ACTIONS<br />
Development of a comprehensive air pollution control program in Sri Lanka will be a long-term effort.<br />
It requires careful planning for industrial siting and transportation. It also requires immediate efforts to<br />
obtain data on the health and economic impacts of air pollution and to build cost-effective monitoring and<br />
enforcement programs. Control of vehicle emissions demands high priority, given the steady increase in<br />
vehicles and the lack of any pollution control program.<br />
Health impacts<br />
Data on health impacts of air pollution need to be established, based on analyses of lead content of<br />
urban dust, incidence of respiratory illnesses, and other health data. In recent years scientists have warned<br />
that even low concentrations of lead cause serious poisoning, affecting urban children in particular.<br />
Worldwide, about 90 percent of the lead in urban air comes from motor vehicles. Concern is also growing<br />
about the impacts of the small particulates emitted from diesel engines. Uncontrolled diesels emit about<br />
30 to 70 times more particulates than petrol engines. Studies indicate that these particulates have caused<br />
increased tumors in animals and may be carcinogenic to exposed workers.
Sources and Effects of Air Pollution<br />
Common pollutants generated by human activities are sulfur dioxide, oxides of nitrogen, |ead, carbon monoxide, photochemical oxidants and suspended<br />
p matter. Concentrations of each pollutant in Sri Lanka are unknown because emissions have not been monitored. Nor do we have information OQ<br />
correlations between ajr pollution an.f) respiratory illnesses or incidence of lead poisoning. The chart below lists the characteristics, sources, and effects qf each<br />
major, air pollutan|.<br />
r<br />
POLLUTANT<br />
Carbon fnonpxide<br />
(CO)<br />
:<br />
•'•< ' ' ''•'• '' ' " '<br />
/ '<br />
'". '•*' ' '-' -v' ' ><br />
Photochemical<br />
• " *'• ' '•' • j. ', *'' i' •'<br />
'%'y-•'ß•'•]
Total suspended<br />
particular<br />
(TSP)<br />
Nitrogen<br />
dioxide (NO?)<br />
Md<br />
Source: Thailand Natural Resources Profile<br />
Any solid or liquid particles<br />
(diameter ranging<br />
from 0.3 to 100 microns)<br />
dispersed in the atmosphere,<br />
such as dust,<br />
pollen, ash, soot, metals,<br />
various metals<br />
'•<br />
At high concentrations,<br />
a brownish-red gas with a<br />
pungent odor, often formed<br />
oxidation of nitric oxide<br />
A non-ferrous heavy<br />
metal occuring in air as<br />
vapor, aerosol or dust<br />
Stationary combustiqn,<br />
especially of solid<br />
fuels; construction<br />
activities; industrial<br />
processes; atmospheric<br />
chemical reactions;<br />
smoking tobacco;<br />
forest fires, wind<br />
erosion, volcanic<br />
eruptions<br />
Motor vehicle exhaust,<br />
high-temperature<br />
stationary combustion,<br />
atmospheric reactions<br />
Available in nature;<br />
lead mining, smelting,<br />
processing; motor<br />
vehicle emissions;<br />
manufacture of lead<br />
products (e.g. batteries)<br />
contacts, paper, textiles, leather,<br />
finishes and coatings,<br />
building stone; formation<br />
of acid rain; leaf damage,<br />
reduced growth in plants;<br />
impairment of visibility.<br />
Health; Directly toxic effects<br />
or aggravation of the effects<br />
of gaseous pollutants; aggravation<br />
of asthma or other respiratory<br />
or cardiorespiratory<br />
symptoms; coughing, chest dis-comfort;<br />
increased mortality.<br />
Others: soiling deterioration<br />
of building materials, other<br />
. surfaces; impairment of<br />
visibility; cloud formation;<br />
interference with plant photo-synthesis.<br />
Health: Aggravation of respiratory<br />
illnesses.<br />
Other: fading of paints, dyes;<br />
impairment of visibility<br />
reduced growth, premature leaf<br />
drop in plants; formation of acid rain.<br />
Health: Accumulation in body organs;<br />
anemia; kidney damage;<br />
central nervous system damage.
94<br />
Identifying economic costs<br />
Energy Resource<br />
Although vehicle fuel and emission requirements as stringent as in developed countries would require<br />
costly investments in Sri Lanka, some immediate cost-effective measures may be possible. Modest vehicle<br />
maintenance can easily reduce operating costs and air pollution emissions. An energy conservation<br />
program of USAID in Pakistan found that simple tune-ups (adjustment of air/fuel mixture and ignition<br />
timing in petrol vehicles; cleaning or replacement of air filters in diesels) could lower fuel costs by 5<br />
percent, while significantly reducing pollution.<br />
Data are needed to determine costs of such tune-ups, including the down-time, for fleets of trucks<br />
and buses and the fuel savings and pollution reductions that would result. Vehicle pollution control<br />
measures can then be developed that build on these potential economic incentives.<br />
Expanding the data base<br />
Several critical steps are necessary.<br />
• Expand NBRO's monitoring programs to cover other densely populated urban areas in order to<br />
produce the air quality data base and ambient air quality standards needed for the country as a<br />
whole.<br />
• Make a thorough inventory of all emission sources, including public and private vehicle fleets and<br />
stationary sources, and establish a system of monitoring, testing and surveillance of vehicles for<br />
emissions.<br />
• Develop cost-effective monitoring and enforcement mechanisms to support any future legal control<br />
regime - for example monitoring to focus on the one in ten vehicles causing the most significant<br />
problems.<br />
Unlike many other countries, Sri Lanka's air pollution problem is still manageable. Although growing,<br />
it need not become more significant. Efforts to avoid future problems and save lives and resources can<br />
begin through immediate data gathering and analysis, public education, and long-term planning for<br />
transportation and industrial siting.<br />
References<br />
Abeywardene, A. and Siyambalapitiya, T. (1989). The consumption<br />
patterns of Commercial Energy in Sri Lanka (mimco). read at<br />
theseminaron Energy, Science and Society, December 1988.Sri<br />
Lanka Association for the advancement of Science. Colombo.<br />
Central Bank of Sri Lanka, Annual Reports<br />
Ceylon Electricity Board (1985). Trincomalee Thermal project: site<br />
evaluation and selection study. The Ceylon Electricity Board.<br />
Colombo.<br />
Ceylon Electricity Board (1987). Trincomalee thermal power<br />
project. Book 2 : Social and environmental assessment. The<br />
Ceylon Electricity Board, Colombo.<br />
Ceylon Electricity Board (1989). Statistical Digest<br />
Ceylon Electricity Board, Colombo.<br />
1988. The<br />
CEB, GTZ, LIDE and CECB (1990). Master plan for the electricity<br />
supply of Sri Lanka - Project Information.- Sarvodaya Vishva<br />
Lekha.<br />
Chandrasekera, D. (1988) Petroleum Source and Supply. Paper read<br />
at the seminar on Energy, Science and Society, December 1988.<br />
Sri Lanka Association for the Advancement of Science<br />
De Silva. A.L.M. and Fernando, Rajen (1987). Public comments on<br />
the proposed coal-fired thermal power plant. Environmental<br />
Foundation ltd, Colombo.Fernando, G.B.A. (1987). Review of<br />
energy plans and strategies in the developing member<br />
countries. Sri Lanka country report to the Asian Development<br />
Bank (mimeo). Ministry of Power and Energy, Colombo.<br />
Fernando, S. and Mel, Renuka. Energy demand in the domestic and<br />
industrial sectors: an analysis of the period 1978 -1988, paper<br />
from seminar on Energy. Science and Society, December 1988.<br />
Sri Lanka Association for the Advancement of Science<br />
I<br />
I<br />
I<br />
I<br />
I<br />
I<br />
I<br />
I<br />
I<br />
I<br />
I<br />
I<br />
I<br />
I<br />
I<br />
I<br />
I<br />
I<br />
I<br />
I<br />
I
I<br />
I<br />
I<br />
I<br />
I<br />
I<br />
I<br />
I<br />
i<br />
I<br />
I<br />
I<br />
I<br />
I<br />
I<br />
I<br />
Karunasena, A.G. (1989). Analysis of impact of oil price changes<br />
• through a macro-econometric model: the Sri Lankan case.<br />
Energy Pricing Options in Sri Lanka, ed. E.N. Wijemanne. Regional<br />
Development Program of the International Labour Organisation.<br />
Knijff, A.V.D. Energy consumption in the tea industry of Sri Lanka.<br />
SLEMA Journal, March 1990.<br />
Mel, Renuka. (1988). Sri Lanka energy balance and energy data<br />
1988. Energy Unit, Ceylon Electricity Board.<br />
Munasinghe, Mohan (1980). Energy in Sri Lanka. Seminar<br />
proceedings, Sri Lanka Association for the Advancement of<br />
Science, Colombo.<br />
Munasinghe, Mohan (1990). Monographs on the Sri Lanka<br />
Economy -1. The Sri Lanka energy sector, trends and future<br />
policy options (mimeo). International Centre for Ethnic<br />
Studies, Colomba<br />
National Science Council (1980). A preliminary study on the<br />
feasibility of Ocean Thermal Energy Conservation (OTEC)<br />
Power for Sri Lanka. National Science Council, Colombo.<br />
Energy Resources 95<br />
National Science Council ( 1982). Report of the committee of inquiry<br />
on the proposal to use atomic energy for the generation of<br />
electric power in Sri Lanka. National Science Council, Colombo.<br />
Pony, Jaako (1986). Forestry Master Plan for Sri Lanka. Jaako<br />
Pony International Oy., Helsinki.<br />
Sahabandu, M. Fuel demand in road passenger transportation - bus<br />
sector, paper from seminar on Energy, Science and Society,<br />
December 1988. Sri Lanka Association for the Advancement<br />
of Science, Colombo.<br />
Wijesinghe, L.GA. de S. (1984). A sample study of biomass fuel<br />
consumption in Sri Lanka households. Biomass, Vol. 5, pp.<br />
261-282.<br />
Wijesinghe, L.CA. de S. (1988). Biomass fuel and its utilization in<br />
Sri Lanka. RERIC International Energy Journal. Vol. 10, No.<br />
1, pp. 67-8.
96<br />
Paddy cuKivation on 760,000 hectares makes rice Sri Lanka's dominant crop in terms of land use and dietary<br />
importance.<br />
I<br />
I<br />
I<br />
I<br />
I<br />
I<br />
I<br />
I<br />
I<br />
I<br />
I<br />
I<br />
I<br />
I<br />
I<br />
I<br />
I<br />
I<br />
I
I<br />
I<br />
I<br />
I<br />
I<br />
I<br />
I<br />
I j<br />
I i !<br />
I<br />
I<br />
s I<br />
1 •'<br />
I'A<br />
i<br />
I<br />
r 97<br />
6 Land Resources<br />
Sri Lanka covers about 6.56 million hectares (16.21<br />
million acres), of which 1.8 percent includes inland<br />
waters. But Sri Lanka's land resources are not<br />
measured by surface area alone; they include various<br />
soils - critical for productivity — underlying geology,<br />
topography, hydrology, and plant and animal populations,<br />
and how these resources have been significantly<br />
affected by past and present human activities.<br />
A rough indicator of demands on land resources<br />
can be seen from the land-man ratio. In 1871, when Sri<br />
Lanka contained only 2.4 million people, about 2.7<br />
hectares were available per person. Today, at about 17<br />
million, land has decreased to 038 hectares (about one<br />
acre per person). As Figure 6.1 shows, the land-man<br />
ratio will decrease further as Sri Lanka continues to<br />
grow to its forecast population, levelling off at about 25<br />
million after 2036. Competition for land among various<br />
users and appropriate management of land according<br />
to its capabilities will, inevitably, become a more<br />
20-<br />
15-<br />
10-<br />
5-<br />
pressing problem. Adding to this challenge are the<br />
economic, social, and environmental impacts of continued<br />
degradation of Sri Lanka's land resources from<br />
misuse and over exploitation.<br />
Part I of this chapter discusses trends in land use<br />
over five decades, present land use conditions, focusing<br />
particularly on lands under tea and. paddy, and the<br />
importance of soil resources. It concludes with a discussion<br />
of current land resource use and allocation<br />
policies and institutional responses.<br />
Part II focuses on land degradation problems, particularly<br />
soil erosion, landslides, coastal erosion,<br />
salinity and waterlogging. It concludes with a brief<br />
discussion of institutional responses.<br />
Given the breadth of this topic, this chapter cannot<br />
be comprehensive; the chapters on mineral resources,<br />
coastal resources, and forestry address additional<br />
aspects of land.<br />
Population (Millions) Land-Man Ratio<br />
n -<br />
1871<br />
i •<br />
Land Extent & Land-Man<br />
Ratios in Sri Lanka<br />
1901 1953 1988<br />
Year<br />
-*- POPULATION -»- LAND-MAN RATIO<br />
Figure 6.1<br />
_ •<br />
F 2 - 5<br />
-2<br />
- 1.5<br />
- 1<br />
0.5<br />
— - -.<br />
2000
98<br />
A- SETTLEMENTS<br />
B-PADDY<br />
C-TEA<br />
D- RUBBER<br />
E- COCONUT<br />
F-OTHER CROPS<br />
G- UNMEASURED<br />
H- FOREST<br />
I - GRASS,CHENA,SCRUB<br />
J-WETLAND<br />
Land<br />
Land Use Changes (1956-1984)<br />
(in thousands of hectares)<br />
Total Measured Land Use = 6,525,000 ha<br />
F 218<br />
G 204<br />
H 2168<br />
H 2943<br />
C 222<br />
D 236<br />
1956<br />
1984<br />
Figure 6.2<br />
F 91<br />
E 251<br />
D 227<br />
C 258<br />
B 758<br />
B 515<br />
I 1570<br />
I U27<br />
990<br />
J 35<br />
I<br />
I
I<br />
I<br />
I<br />
I<br />
I<br />
I<br />
I<br />
I<br />
I<br />
I<br />
I<br />
I<br />
I<br />
I<br />
I<br />
pi'<br />
Und 99<br />
PARTI<br />
LAND <strong>RESOURCES</strong> AND USE<br />
1956 TO PRESENT<br />
Population increases have significantly changed<br />
land uses since Independence, when high growth rates<br />
intensified competition for land. At present,<br />
developed agriculture includes nearly a third of the<br />
land area, land under forest and wildlife conservation<br />
occupies another third, and transportation, human settlements,<br />
home gardens, and a variety of other uses,<br />
including undeveloped land, account for the rest. Information<br />
on these present land uses, although imperfect,<br />
comes from land use mapping by the Survey<br />
Department, the Irrigation Department, the Land Use<br />
Policy Planning Division, the Agriculture Department,<br />
and annual data gathered by the Department of Census<br />
and Statistics and other Departments and local officers.<br />
By comparing present information with results of the<br />
first comprehensive land use mapping effort for Sri<br />
Lanka compiled from aerial photography in 1956 we<br />
can determine significant changes in land use and land<br />
conditions over the past 45 years. Land use changes for<br />
eight broad categories from 1956 to 1984, and hectares<br />
No.Thousanda<br />
20<br />
15 -<br />
10<br />
5<br />
0<br />
1 1<br />
ri 1<br />
WP CP<br />
•INO.<strong>OF</strong><br />
Encroachments on State Lands<br />
1979 - 1985<br />
1<br />
11<br />
•_, I<br />
fi 1<br />
1 Mi 11<br />
SP NP<br />
EP P ICE<br />
ROVIN<br />
per person are shown in Figure 63. Highlights of the<br />
changes:<br />
Smaller natural forests. Forests have taken the<br />
brunt of the change. Since 1956 natural forests shrunk<br />
from 2,900,000 hectares to 2,150,000 hectares in 1984.<br />
Assessed against population increases, forests declined<br />
from 035 to 0.13 hectares of forest per head.<br />
Dry Zone settlement New irrigated lands brought<br />
over 300,000 families into the Dry Zone including settlement<br />
of 51,000 hectares of the Mahaweli region,"<br />
where 10,000 people moved from the newly constructed<br />
Mahaweli reservoirs. Population also shifted significantly<br />
into Mullaitivu, Mannar and particularly<br />
Vavuniya, following loss of employment from nationalized<br />
tea plantations in the early 1970s. Even so, the<br />
Land Commission (1990) estimates that about 2.5 million<br />
hectares ~ nearly 40 percent of the country, mostly<br />
in the Dry Zone — remains "developable" in some way.<br />
JL JL<br />
NCP<br />
_ 1<br />
1 1<br />
1<br />
JL<br />
NWP<br />
Extent HA/00<br />
25<br />
- 20<br />
-<br />
I 1"<br />
MM-. 1 10<br />
SAB UVA<br />
ENCROACHMENTS O EXTENT ENCROACHMENT<br />
Figure 6.3<br />
16<br />
10<br />
5
100<br />
4-<br />
Millions<br />
Land<br />
Livestock Population<br />
1960-1986<br />
60 66 70 75<br />
YEAR<br />
80 86<br />
— CATTLE -*- BUFFALOES -*- QOAT3.PIQ3.3HEEP -*" CHICKEN<br />
Encroachments on state land. The government's<br />
first official report on this problem found that by 1979<br />
an estimated 500,000 people had encroached on 6 percent<br />
of the country since well before Independence.<br />
Between 1979 and 1985 another 104,000 encroach*<br />
ments totalled over 70,000 hectares - a 19 percent<br />
increase - mostly for residences and usually on land<br />
reserved by the state along roads, streams, and canals.<br />
The highest rate of increase occurred in the Central<br />
Province. Figure 6.3 shows encroachments per<br />
province since 1978.<br />
Urban expansion. Urban areas have steadily<br />
sprawled into areas still not officially defined as<br />
"urban," frequently causing settlement and filling of<br />
floodprone lowlands. Urban expansion reduced rubber<br />
and coconut plantations around Colombo and<br />
Gampaha by 25 percent. In Colombo, where the<br />
government owns 25 percent of the land, an estimated<br />
9,000 encroachments occurred since 1979, primarily for<br />
housing along canals and road and railway embankments.<br />
Agricultural shifts. Paddy increased from 514,000<br />
hectares to 760,000 heaares in 1988, mainly in the newly<br />
irrigated areas of the Mahaweli. Sugarcane, which<br />
barely existed in 1956, increased to about 20,000 hectares<br />
with the opening of plantations in the Southern<br />
and Eastern dry zone. Other agricultural changes: in-<br />
Figire 6.4<br />
creased livestock population, and twice as many chickens,<br />
mostly in commercial farms (see Figure 6.4), and<br />
moderate growth in non-traditional export crops such<br />
as coffee, pepper, cocoa, and in fruits and cut flowers.<br />
Plantations. Tea plantations declined in size by<br />
about 10 percent, but the overall acreage of developed<br />
agricultural land — about 30 percent in 1982 - barely<br />
changed. The Land Commission estimates a 10 percent<br />
coconut decline between 1962 and 1982.<br />
Increased shifting cultivation. Lands under shifting<br />
cultivation (chena) increased from about 1 to 1.2<br />
million hectares. But whereas in the mid-1950s about<br />
90 percent lay in the Dry and Intermediate Zones, now<br />
they are found in every region, from Galle to Jaffna,<br />
despite government prohibitions. (See box - Whither<br />
chena?)<br />
PRESENT USE<br />
Plantation Agriculture - Focus on Tea<br />
Of the 839,000 hectares under plantation agriculture,<br />
tea has been the dominant crop and immensely<br />
important environmentally as well. The discussion<br />
below focuses on the environmental and economic conditions<br />
and trends of tea production.<br />
I<br />
I<br />
I<br />
I<br />
I<br />
I<br />
I<br />
I<br />
I<br />
I<br />
I<br />
I<br />
I<br />
I<br />
I<br />
I<br />
I<br />
I
I<br />
I<br />
I<br />
I<br />
i :<br />
I<br />
I<br />
I<br />
I<br />
I<br />
I<br />
I<br />
I<br />
I<br />
I<br />
I<br />
I<br />
1<br />
r Land<br />
101<br />
WHITHER CHENA?<br />
Chena (anglicised from hena) cultivation, probably Sri Lanka's oldest agriculture, still continues,<br />
primarily in the island's sparsely populated; relatively dry regions. It involves forest clearing and cultivation<br />
for a season ortwo;abandonment to fallow which allows the forest to regenerate, and subsequent<br />
repetition o f the cultivation cycfe. . .. • '.-, •..•,-.:• '•;•'•'•. . : -v-.V^ V. : ••"''•••'• : K.•;:.-•?:•.' : --'- ' : ^ :. : M'. • '•'••^:-<br />
Forest clearing occurs during thedry season before the /m^ rainfalL Burning follows before the::<br />
onset of rains, after which seed beds are prepared for an assortment of crops;including sweet corn, finger<br />
millet, mustard and country vegetables grown under: rainfed conditions* Watch-huts on taUèr trees an<br />
log fences provide protection from wild animals and birds. Harvesting begins toward the end of the rainy<br />
season and continues during; the dry spells thereafter. A sec
102 Land<br />
Debateson chena continue, but observations of the First Land Commission retain their validity even<br />
after sixty years. Areas under c/ieno fanning are still considerable. In 1952 the committee on the use of<br />
Crown Lands estimated about .7 million hectares of chena lands in the Dry Zone; fifteen years later the<br />
Land Use Committee (1967) reported cAeno at about one million hectares, and in 1984 the Land Use<br />
Division of the Irrigation Departmentestimated chena land at about OinOfion hectares.<br />
For SriLanka's forests the chena, and recent trendsmdicatingltsra<br />
Now chena cultivation concentiates on the reinaihin^ thé'<br />
tensity<br />
First Land Conimissiön reféried tösomec^<br />
thesame plot after 20 yearsvandm<br />
occurs every 2-3 years orless. Many fanneradänotfällcw<br />
reœntsvurcy of c/iena cultivation ùv som<br />
Chena lands produce about eighty percent:óf Sri Lanka'sirainfe^grains,pulsesandvegetables<br />
any given year about 250,000 farm families dependoajchena.fóttheitüveühoodw<br />
But environmental conditions and trends indicate<br />
neither: economically nor<br />
environmentally sustainable.<br />
about? one hectare. Population; increases mean: that this, ratiacamöfe<br />
hectares of arable land in the country, a hectare.<br />
Even present cAenff cultivation practices are not sustainable: CftowicultrvaÖpnwas^ditionally a<br />
system of low intensity land use with a aütivaüon btensity range of bnr/5 to 10 percent:H<br />
cultivation of lands wit&greäüy.r^u<br />
is less than 50 percent: of the potential yield, with possible exceptions for soya beans and gingelly.<br />
By the mid-nineteenth century British colonial<br />
policies caused clearing of many of Sri Lanka's<br />
tropical montane forests in order to plant coffee<br />
and cinchona. Plantation coffee covered 20,500<br />
hectares in 1847, increased to about 32,400 hectares<br />
by 1857, and to 110,500 hectares by 1873.<br />
Approximately 20,200 hectares were converted<br />
from chena lands (K.M. De Silva, 1981). By then<br />
the coffee blight was taking hold, and after 1880<br />
coffee gave way to tea plantations. Tea cultivation<br />
was extremely efficient, and tea soon became Sri<br />
Lanka's single largest foreign exchange earner. In<br />
conventional business terms the transformation of<br />
natural forests to plantation agriculture was highly<br />
successful.<br />
During the past decade, however, tea's relative<br />
economic importance has changed significantly.<br />
Government revenue from tree crops (tea, rubber<br />
and coconut) fell from 23 percent in 1981 to .04<br />
percent in 1988 as the government reduced export<br />
duties and taxes. Further, the proportion of thenexport<br />
earnings declined from 49 percent in 1975<br />
to 25 percent in 1988. After 1980 the value of<br />
industrial exports exceeded that of tea exports.<br />
However, tea remains Sri Lanka's highest net<br />
foreign exchange earner, bringing in twice the net<br />
foreign exchange earned by textiles and garments,<br />
although their gross foreign exchange earnings<br />
exceeded that of tea by 16 percent.<br />
In<br />
I<br />
I<br />
I<br />
I<br />
I<br />
I<br />
I<br />
I<br />
I<br />
I<br />
I<br />
I
I i<br />
I M<br />
f.<br />
P Il<br />
j IM<br />
I<br />
( ••<br />
r Land.<br />
103<br />
Tea Production and Fertilizer Consumption<br />
Tea - Production, Area<br />
Production Mlllo« Kgs) ATM-OOOMAI<br />
260 300<br />
200!<br />
ISO<br />
too<br />
50<br />
72 73 74 7S 76 77 78 70 60 81 62 S3 04 85 S« 67 66 69<br />
National FwillbM- 3*oratahat<br />
YEAR<br />
-*- PRODUCTION -*- AREA<br />
kg/ha<br />
3ouro*iMlnlalry of Plantation Induatrla«<br />
260<br />
200<br />
160<br />
100<br />
80<br />
Figure 6.5<br />
Consumption (Kg NPK/ha)<br />
2S0<br />
200<br />
160<br />
100<br />
60<br />
Fertilizer Consumption<br />
72 73 74 76 7« 77 78 78 80 81 62 S3 84 86 86 87<br />
Soure*C*ntral Bank Annual Raporta<br />
Halloa^ Fa>Hlla> Sawatarlal<br />
Yield of Tea<br />
State & Private<br />
•HJEDB EUSLSPC<br />
Rgure6.6<br />
YEAR<br />
- FERTILIZER
104<br />
Production. Tea production peaked at 228 million<br />
kilograms in 1965 due lo increased acreage and yields<br />
per acre. Since then production has declined. Between<br />
1968 and 1982 production fluctuated but declined at an<br />
estimated rate of 1.87 million kg/ha/yr (Figure 6.5). In<br />
1983 a severe and prolonged drought cut production to<br />
179 million kilograms — the lowest level since 1965.<br />
Although production rose to 208 million kilograms the<br />
following year and in 1988 production reached 227<br />
million kilograms. In the absence of civil disruption in<br />
the Southern and Uva regions production might have<br />
exceeded that of 1965.<br />
Various factors have contributed to production<br />
declines or stagnation: reduced acreage; adverse<br />
weather; inadequate replanting and infilling; poor<br />
management; nationalization following the Land<br />
Reform Laws of the 1970s; high taxation and depressed<br />
prices; increasing age and senility of tea plantations;<br />
and declining soil fertility.<br />
Unfortunately there is no accurate information on<br />
the extent of tea. Area under tea, as registered by the<br />
Tea Commissioner's Division, remained virtually unchanged<br />
for at least the ten years up to 1982 (Figure<br />
6.5), but data from the Agricultural Censuses show a<br />
9.5 percent decrease in area between 1973 and 1982.<br />
Area under tea decreased by 20,031 hectares between<br />
1983 and 1989, according to records of the Plantation<br />
Industries Ministry. Of this amount 63 percent occurred<br />
in the mid-country, in part because of land<br />
released for village expansion, diversification, and settlement<br />
Registered tea acreage in 1984 was 227,875 hectares<br />
but the Remote Sensing Survey, using aerial<br />
photographs during 1981-1984, estimated tea area at<br />
201,630 hectares. Apparently because of this uncertainty<br />
official figures of national yield have ceased to be<br />
reported after 1980, even though tea is Sri Lanka's<br />
principal agricultural product and data on yield per<br />
hectare is a useful index of agricultural efficiency.<br />
Yield data is nevertheless available for the two<br />
major state organisations, the JEDB and SLSPC, which<br />
together account for over 50 percent of the tea area and<br />
almost two-thirds of the country's production (Figure<br />
6.6). Private sector yields have been estimated for<br />
Land<br />
comparative purposes, although four-fifths of the<br />
privately owned and managed tea estates are small<br />
holders (under 10 hectares). State sector yields have<br />
remained more or less stagnant, but smallholder yields<br />
have grown markedly, doubling within a period of eight<br />
years. While this is a remarkable achievement, private<br />
yield levels are still only 70 percent of the state sector.<br />
I<br />
I<br />
I<br />
I<br />
I<br />
I<br />
In the private smallholder sector, the three lowest a<br />
yielding districts are the midcountry — Matale, Kegalle I<br />
and Kandy. The three highest yielding districts are all<br />
in the low country (Matara, Kalutara and Galle) where<br />
average yields are higher than those of the state plantations<br />
(Figure 6.7). Tea growers in the low country have<br />
had the benefit of fertilizer on credit from TSHDA,<br />
private factories, higher prices, and higher proportions<br />
of clonal tea. Poor prices of mid-grown tea on the other<br />
hand, have led to a spiralling effect of neglect of lands,<br />
degradation, and poor yields.<br />
Soil erosion. The most significant environmental _<br />
cost of agricultural production is soil erosion, clearly I<br />
evident for Sri Lanka's tea plantations. Tea is grown on<br />
red yellow podzolic soils (RYP), reddish brown _<br />
Iatosolic soils (RBL), and immature brown loams (IBL) •<br />
in the Wet Zone, of which most is the low-erodible soil<br />
RYP. However, because of the greater inherent«<br />
erodibility and instability of IBL soils, which occur in •<br />
the midcountry, tea lands on these soils are vulnerable<br />
to degradation. Even on low erodible soils, and despite M<br />
low intensity rainfalls, tea in the mid-country and at high I<br />
elevations grows on steep slopes. In the low country,<br />
where slopes are less steep, rainfall intensity is high,<br />
Thus all plantations are highly prone to erosion.<br />
Soil erosion problems were recognised more than<br />
60 years ago. The Administration Report of the I<br />
Department of Agriculture for 1927 has a modern ring:<br />
The importance of soil conservation in the hill<br />
country is recognised by all and much has been<br />
accomplished in recent years. Much however,<br />
remains to be done and until every planter in the<br />
upcountry realises that this is his main agricultural<br />
problem the situation cannot be considered to be<br />
satisfactory. If soil erosion can be checked and<br />
general soil condition and tilth maintained, crop<br />
yields will be sustained without the aid of increasing<br />
quantities of artificial fertilizer and the incidence<br />
of pests and diseases will also be reduced.<br />
i<br />
I<br />
I<br />
I
Land<br />
Districts*<br />
3 lowest yielding districts<br />
(Matale, Kegalle, Kandy<br />
3 middle yielding districts<br />
105<br />
Small Holding Sector Average Yields (1984)<br />
(Nuwara Biya, Badulla.Ratnapura)<br />
3 highest yielding districts<br />
(Matara, Kalutara, Galle)<br />
* Districts with over 500 ha<br />
Average Yield (kg/ha)<br />
359<br />
661<br />
1,533<br />
Source : Calculated data from Report of the Census of Tea Small Holdings in Sri Lanka 1984.<br />
Little happened, however. Due to the importance<br />
of maintaining weed-free fields and the failure to adopt<br />
sound agronomic soil conservation measures, soil<br />
erosion continued.<br />
Best available estimates suggest that as much as 30<br />
centimeters of topsoil has been lost from upland areas<br />
over the last century since tea was introduced,<br />
equivalent to an average loss of 40 t/ha/yr. However,<br />
soil losses in well-managed tea estates have been<br />
reduced to as little as 3 t/ha/yr. Land under tea is most<br />
prone to erosion during planting and pruning when soil<br />
is exposed. With proper drains and the use of mulches<br />
and cover crops, soil erosion could be minimized (Figure<br />
6.12). Weed management techniques are also very<br />
important, especially in land with low bush densities,<br />
and so is full coverage of the land by the crops. Annual<br />
infilling of vacancies in fields, one routine on estates,<br />
was neglected during the late 1960s and 1970s. The<br />
government introduced a scheme in 1978 to pay the cost<br />
Of infilling^<br />
Soil erosion and land degradation affect large<br />
areas of tea lands that are marginally productive and<br />
Figure 6.7<br />
Area (ha)<br />
24,205<br />
23,406<br />
27,824<br />
uneconomic, predominantly in the midcountry. These<br />
lands could be made economically productive again for<br />
mixed farming, including spice crops, if, as noted by the<br />
Land Commission, concerned agencies work together<br />
toward that end.<br />
Fertilizer use. Artificial fertilizer is the single most<br />
important input in terms of at least short term productivity<br />
because tea responds especially well to nitrogen<br />
fertilizer. Tea receives the highest input of fertilizer of<br />
any crop in Sri Lanka with possible exceptions for<br />
upcountry vegetable cultivation and some other crops<br />
in the Mahaweli irrigation areas. Over the past two<br />
decades fertilizer consumption in terms of NPK<br />
nutrients increased from 118 kg/ha, in 1972 to 215 kg/ha<br />
in 1988, which is 79 percent higher than for paddy<br />
(Figure 6-5). Compliance with recommended use increased<br />
from 73 percent to 97 percent - highest compliance<br />
rate for the three major plantation crops and<br />
paddy — although cases of overfertilization still occur.<br />
Yield in relation to other countries. The average<br />
yield of tea in Sri Lanka is low compared to other<br />
tea-producing countries. FAO statistics record in-<br />
-
106 Land<br />
YIELD<br />
4UOO<br />
3000<br />
2000'<br />
1000<br />
-<br />
—^<br />
1<br />
o 75 76<br />
Average<br />
KQ/HA)<br />
77 78 79<br />
SourceiOepartmen t of Census & Statistics»<br />
Yield of Paddy<br />
i i i i<br />
80 81 82 83<br />
YEAR<br />
—— MAHA —•—<br />
Figure 6.8<br />
(1975 -<br />
i i<br />
84 85<br />
YALA<br />
Use of Fertilizer in Paddy<br />
in NPK Nutrients<br />
1987)<br />
-~—-"^.<br />
i ^T——<br />
f_ -1 1 ^.<br />
i i i 1<br />
86 87 88 89<br />
120 TOTAL'000 MT KG/HA 140<br />
o<br />
70 71 72 73 74 75 76 77 78 79 80 81 82 83 84 85 88 87<br />
88<br />
Year<br />
Source: NFS Data<br />
TOTAL USF000 MT<br />
Figure 6.9<br />
KQ/HA<br />
I<br />
I
I<br />
I<br />
I<br />
I<br />
I<br />
I<br />
I<br />
I<br />
I<br />
I<br />
I<br />
I<br />
I<br />
I<br />
Ii<br />
I<br />
I<br />
I<br />
I<br />
I<br />
I<br />
I<br />
r Und<br />
creasing yields for Sri Lanka from 1985 to 1988, but the<br />
yield in 1988 was only 52 to 64 percent of the yields of<br />
Indonesia, India, Malawi and Kenya. Of the countries<br />
reported, Sri Lanka only exceeded the yield of<br />
Bangladesh and Tanzania. The reasons for Sri Lanka's<br />
relatively poor performance:<br />
• Many tea plantations are over 80 years old and<br />
beyond peak cropping potential;<br />
• Low bush densities caused by neglected infilling;<br />
• Slow rates of replanting with high yielding clonal<br />
material, well below the targets of 5,000 hectares<br />
per year,<br />
• Low productivity of soils due to degradation.<br />
These factors suggest a critical question: What<br />
level of investment can and should be put into<br />
rehabilitation of tea plantations to increase productivity<br />
over the long term?<br />
Cultivation — Focus on Paddy<br />
In Sri Lanka, paddy is the dominant crop both in<br />
terms of land use and dietary importance. Efforts to<br />
achieve national self-sufficiency in rice have received<br />
high priority. In 1988 Sri Lanka's rice imports were only<br />
10 percent of national requirements.<br />
Production. Paddy output has grown remarkably<br />
in area and yield over the years. Large lands have been<br />
opened up for peasant colonization and settlements in<br />
the Dry Zone. From 1971 to 1982, increases in paddy<br />
area and yield per unit area contributed about equally<br />
to the increase in total production. During this period,<br />
particularly after 1976, paddy yields steadily increased,<br />
reaching a maximum in 1983. Between 1982 and 1986<br />
changes in total paddy production largely resulted from<br />
increased yield, but after 1986 production increased<br />
mainly because more area was sown. Yields have also<br />
increased over the long term, but there appears to have<br />
been a levelling off since 1985 (see Figure 6.8).<br />
A major factor contributing to increased yields is<br />
the breeding of improved varieties. The new improved<br />
varieties (HYVs) have a yield potential of 7 t/ha, compared<br />
to 4 t/ha for the old improved varieties. With the<br />
107<br />
introduction of NIVs in the early 1970s they are now<br />
tending to replace older varieties.<br />
Inputs. Use of fertilizers and adoption of better<br />
management practices such as weed control, pest and<br />
disease control have also increased yields. From 1965<br />
to 1984 the area under weed control increased from 14<br />
percent to 78 percent, and pest and disease control<br />
from 13 percent to 68 percent. Fertilizer use in paddy<br />
has increased threefold from 42 kg NPK nutrients per<br />
hectare in 1970 to 120 kg/ha in 1988, reaching a peak<br />
consumption of 130 kg/ha in 1987 (see Figure 6.9).<br />
Agricultural development over the last 40 years has<br />
brought most available land and water resources into<br />
productive use. Given the limitations on increasing<br />
paddy lands, the only option for attaining and maintaining<br />
self-sufficiency is increased productivity, or the<br />
yield per hectare.<br />
Cost and environmental factors constrain this option,<br />
also. Modernization of traditional practices of the<br />
farmer have invariably required costly inputs of tractors,<br />
fertilizers and pesticides. Since 1970 tractors have<br />
increasingly replaced buffaloes in paddy fields; an estimated<br />
45 percent of Dry Zone paddy is cultivated by<br />
tractor. From 1977 to 1986 the cost of fertilizer and<br />
pesticides increased by 72 percent and 150 percent<br />
respectively. Imported inputs, according to data from<br />
the Hambantota district, amounted to approximately<br />
50 percent of the total input cost in 1985.<br />
Despite data problems, scientists have become<br />
concerned about long term productivity constraints<br />
associated with soils that have been farmed for many<br />
years with ever-increasing applications of chemical fertilizers.<br />
On one hand Sri Lanka clearly cannot return<br />
to the level of productivity of the ancient sustainable<br />
systems, estimated at only 1.5 t/ha (30 bushels/acre) at<br />
Independence. On the other hand input costs must be<br />
contained, and environmental externalities minimized.<br />
Increasing costs of tractor fuel, for example, may make<br />
it possible and désirable for more farmers to return to<br />
traditional reliance on buffaloes, assuming that<br />
availability of feed supplies make this economical.<br />
With improved data and analyses of long-term fertilizer<br />
and pesticide impacts on soils and sustainable produc-
108<br />
tivity, changes in these inputs may be seen as economically<br />
necessary as welL<br />
A potentially attractive move towards sustainability<br />
would be greater use of bio fertilizers (farmyard<br />
manure, green manures, compost) to substitute<br />
for chemical fertilizer. Research has shown that the use<br />
of rice straw at 3 t/ha could meet all requirements for<br />
potassium fertilizer and part of nitrogen requirements.<br />
The Department of Agriculture now recommends application<br />
of rice straw in all agroclimatic zones except<br />
the low country wet zone. Chemical fertilizer inputs<br />
can also be appreciably reduced when applied in combination<br />
with green manures such as Gliricidia,<br />
Tithonia, and Leucaena. The doubling of paddy fertilizer<br />
prices when fertilizer subsidies ceased in January<br />
1990 is a strong incentive for greater use of biofc rt ilizers<br />
by farmers.<br />
Grass lands<br />
Much of Sri Lanka's more than 500,000 hectares of<br />
grass and scrubland is used for livestock grazing. Only<br />
about 20,000 hectares of these lands, mainly in government<br />
farms, are under improved grasses with at least<br />
double the fodder yield of indigenous grasses. Yet only<br />
half the local requirement of milk is produced in Sri<br />
Lanka, the rest is imported. Cost of imported milk and<br />
milk products rose about eightfold from 1977 to 1986<br />
(Gunasena, 1990 draft). Efforts to increase milk<br />
production from smaller areas can release grassland to<br />
other uses. Improved pasture can also be raised under<br />
coconut.<br />
Forest Gardens<br />
Forest gardens occupy almost a million hectares in<br />
rural areas and produce a variety of agricultural crops,<br />
timber, fruit, and fuelwood trees in multi-storey arrangements.<br />
The mix of crops varies according to climate,<br />
with the widest variety of crops in the Wet and Intermediate<br />
Zones. A fully developed home garden affords<br />
excellent conservation possibilities similar to that<br />
of a natural forest. However in most home gardens<br />
haphazard placement of trees and other crops denies<br />
these benefits; more careful, and more scientific arrangement<br />
of trees and management of canopies can increase<br />
production. (See box on forest gardens.)<br />
Land<br />
ALLOCATION FOR SUITABILITY<br />
AND SUSTAINABILITY<br />
Soils of Sri Lanka<br />
Soil productivity remains a basic factor in determining<br />
good land condition and appropriate land use.<br />
It is essential to maintain the balance between forests<br />
(about one-quarter of Sri Lanka) and crop and livestock<br />
land (about one-third). Sri Lanka's soils are<br />
vulnerable to soil erosion, primarily from high intensity<br />
rainfall. Soil conservation is therefore a critical component<br />
of long term land management.<br />
Soil is renewable in geologic, not generational<br />
terms. Although local data are not available, tropical<br />
research (Young, 1969) indicates a rate of soil formation<br />
of 46 milimeters in 1,000 years from consolidated<br />
metamorphic rocks, and in Sri Lanka erosion can<br />
remove up to 5 to 10 millimeters in one year. Thus soil<br />
lost in one year cannot be renewed or replaced within<br />
one human lifetime. Land and its soil may be reused,<br />
but not, for practical purposes, renewed. The<br />
economic costs of soils lost or degraded are therefore<br />
exceedingly difficult to measure.<br />
General soil maps reveal the major soil groupings<br />
of the wide soil varieties present in Sri Lanka. Soil<br />
characteristics and capabilities vary as well, depending<br />
on climate and parent material. Some soils—Immature<br />
Brown Loams, Non Calcic Brown and Reddish Brown<br />
Earths — are highly erodible and need special soil<br />
conservation measures. But most stable soils like Red<br />
Yellow Podsolic and Reddish Brown Latosolic soils<br />
occur on steep slopes, so they too are prone to high<br />
erosion. The crops best suited to the various soils, and<br />
the management requirements, are presented in Figure<br />
6.10. The 14 major soil groups are distributed among 4<br />
topographic classes: (i) flat to undulating (0-8 percent<br />
slope); (ii) rolling to hilly (8-30 percent slope); (iii) hilly<br />
and mountainous (30-60 percent slope); and (iv) extremely<br />
steep (over 60 percent slope).<br />
Suitability analysis<br />
Wide variations and combinations of soils, climate<br />
.and topography and susceptibility of lands to erosion,<br />
landslides, or loss of fertility, make evaluation of land<br />
capabilities for various uses exceedingly complex. The<br />
I<br />
I<br />
I<br />
I<br />
I<br />
I<br />
I<br />
I<br />
I<br />
I<br />
I<br />
I<br />
I<br />
I<br />
I<br />
I<br />
I<br />
I<br />
I
.,_~<br />
Soil Group<br />
Reddish Brown Earths<br />
Low Humic Gley<br />
Non Calcic Brown<br />
Red Yellow Latosols<br />
Suited<br />
Immature Brown Loams<br />
Solodised Solonetz<br />
Grumusols<br />
Crops And Specific Management Requirements Of The Major Soil Groups.<br />
Suited Crops<br />
cereals,pulses,cassava,sugarcane,<br />
castor.onions chillies,cotton,<br />
tobacco,vegetables,fruit crops,<br />
pasture grasses,timber trees.<br />
puddled rice, adapted<br />
pasture grasses<br />
cereals pulses,cassava,sugarcane,<br />
castor.onions chillies,colton,<br />
tobacco, vegetables, fruit crops,<br />
pasture grasses, timber trees.<br />
cereals, pulses, cassava, sugarcane,<br />
castor, onions, chillies, cotton,<br />
tobacco, vegetables, fruit crops,<br />
pasture grasses, timber trees, asparagus<br />
conservation forestry for steep slopes;<br />
cereals, pulses, cassava, sugarcane,<br />
castor, onions, chillies, cotton,<br />
tobacco, vegetables, fruitcrops,<br />
pasture grasses, timber trees<br />
for gentler slopes<br />
puddled rice after reclamation<br />
puddled rice<br />
Specific Management Requirement<br />
supplemental irrigation at 1-2 week intervals(furrow, drip,<br />
sprinkler); good drainage facilities (main drains 2 meter<br />
deep); timing of tillage to moist conditions; soil conservation<br />
measures; nutrient supplementation by organics or inorganics<br />
supplemental irrigation at weekly intervals (flooded basins);<br />
good drainage;nutrient supplementation<br />
supplemental irrigation at weekly intervals (furrow, drip,<br />
sprinkler); good drainage facilities (main drains 2 meter<br />
deep);timing of tillage to moist conditions; soil conservation measures;<br />
nutrient supplementation by organics or inorganics<br />
supplemental irrigation at weekly intervals<br />
(furrow,drip,sprinkler); soil conservation measures;<br />
nutrient supplementation by organics or inorganics<br />
(small doses at frequent intervals).<br />
soil conservation most important;<br />
steep slopes to be undisturbed because of landslide hazard;<br />
nutrient supplementation; irrigation if available and possible<br />
reclamation by gypsum addition and flushing or repeated<br />
(lushing by calcium rich irrigation water; supplemental irrigation at weekly<br />
interval (flooded basins); good drainage ; nutrient Supplementation,<br />
supplemental irrigation at weekly intervals (flooded basins);<br />
good drainage.<br />
nutrient supplementation; soil conservation measures<br />
o
Red Yellow Podsolic &<br />
Reddish Brown<br />
Latosolic Soils<br />
Alluvial soils<br />
a) Levee Soils<br />
b)Back slope &<br />
c)Back swamp soils<br />
Regosols<br />
Bog Soils<br />
Lithosols<br />
Old Alluvial Soils<br />
tea, rubber, coconut, coffee, cocoa,<br />
cinnammon, pepper, mulberry,<br />
cloves, nutmeg, tobacco, vegetables,<br />
fruit crops, pasture grasses, forestry<br />
vegetables, cereals, pulses, tobacco,<br />
sugar cane, onions<br />
puddled rice, adapted pasture<br />
coconut,palmyrah,cashew<br />
medicinal products.mangrove<br />
• reeds for basket weaving, nipa palm<br />
for sugar & honey, sonneratia for fruit,<br />
cork & fuelwood, bacopa for vegetation<br />
for multiple use, rice if specifically<br />
adapted.<br />
conservation forestry<br />
sugar cane, groundnuts, pasture,<br />
grasses, puddled rice<br />
Figure 6.12<br />
supplemental irrigation at 1-2 week intervals<br />
(furrow.drip, sprinkler)good drainage facilities;<br />
nutrient supplementation by organics or inorganics<br />
supplemental irrigation at weekly intervals<br />
(flooded basins); good drainage; nutrient supplementation;<br />
flood control.<br />
supplemental irrigation at weekly intervals<br />
(drip,sprinkler); soil conservation measures;<br />
nutrient supplementationby organics or inorganics<br />
(small doses at frequent intervals).<br />
controlled drainage; flood controls; salinity control; flushing put<br />
of acidity; liming to correct acidity; nutrient supplementation<br />
including zinc and copper; prevention of subsidence and<br />
oxidation, conservation<br />
supplemental irrigation at weekly intervals<br />
(drip, sprinkler); soil conservation measures;<br />
nutrient supplementation by organics or<br />
inorganics (small doses at frequent intervals).
I<br />
suitability of the lands for major land uses in Sri Lanka<br />
has been assessed using a generalized geographic information<br />
system. Data on soils, climate and topography<br />
have been analyzed to arrive at overall land suitability<br />
estimates for the entire country, regardless of present<br />
use. These data can be used only to obtain an overall<br />
notions of land suitability for national scale planning.<br />
They indicate, however, that thousands of hectares of<br />
agricultural lands are located on marginally suitable or<br />
unsuitable lands.<br />
Land use allocation problems and needs<br />
In Sri Lanka, as elsewhere, population and<br />
development pressures demand careful use of land<br />
management information and resolution of policy questions<br />
regarding land tenure.<br />
Undeveloped lands. The Land Commission estimated<br />
that nearly two million hectares (4.9 M acres)<br />
of rainfed lands were available for agriculture, settlement,<br />
or other development in the Dry Zone. Most of<br />
this land is now under state forest or wildlife protection.<br />
Because of water constraints about one million hectares<br />
has been ranked low in agricultural potential. The<br />
Land Commission's report highlighted the important<br />
need to determine how this land should be allocated, to<br />
whom and under what conditions.<br />
Wildlife habitat. With approximately 11-5 percent<br />
of the country allocated to National Parks or similar<br />
reserves, Sri Lanka devotes a higher proportion of its<br />
land to wildlife than any Asian country except Bhutan<br />
(World Resources Institute, 1986) - three times the<br />
world average. Yetwildlife management faces significant<br />
problems of encroachment and still unprotected<br />
biological resources. Although the two<br />
largest wildlife parks, Yala and Wilpattu, are located<br />
within dry areas unsuited to agriculture, management<br />
problems arise from the presence of - 2,000 families in<br />
Wasgomuwa and Uda Walawe. Meanwhile, development<br />
and demographic pressures in the biologically<br />
rich Wet Zone suggest serious needs for better wildlife<br />
protection there. (See biological diversity chapter.)<br />
Forest lands. Allocation of forest lands presents<br />
similar questions. Forests constitute about 24 percent<br />
of the country, slightly above the Asian average (21<br />
percent in 1965-1982), but these areas include "ecologi-<br />
Und 111<br />
cally marginal" lands in the Dry and Intermediate<br />
Zones. Some of these forests are potentially suited to<br />
agriculture, whereas in the Wet Zone catchment areas<br />
natural forests may be desirable for long term protection<br />
of reservoirs, food and fiber for neighboring villages,<br />
and other forest uses, including protection of<br />
biological diversity.<br />
Urban lands. Encroachment on state lands in<br />
urban areas usually occurs on lands least suitable for<br />
residential use, such as stream and canal banks and<br />
railroad embankments, but demands for affordable<br />
low-income housing are high. Efforts to protect water<br />
quality of urban lakes and streams, provide drainage,<br />
sewer connections, and the provision of clean drinking<br />
water from wells or piped supplies, require land<br />
management that accounts for encroachment problems<br />
and the housing and other needs that caused them.<br />
Areas considered open to development that might<br />
relieve encroachment problems are often low-lying<br />
lands subject to flooding. Options to anticipate and<br />
prevent worsening urban growth problems include<br />
relocation of industries to outlying areas, and planned<br />
low-rise housing developments with open-space.<br />
POLICIES AND INSTTTUTIONAL<br />
RESPONSES<br />
As with water resources, the laws and policies<br />
concerning land use are numerous and replete with<br />
problems of administration, coordination, and policy<br />
direction. Underlying Sri Lanka's land use and<br />
management practices, however, are policies, laws, and<br />
institutions affecting land tenure and the distribution of<br />
state land. These policies reflect concerns about how<br />
to allocate land fairly among competing interests — the<br />
landless, land owners, business interests, religious interests,<br />
and interests of the community at large. Recognizing<br />
that the topic is large and all encompassing, a few<br />
key acts and policies are discussed below.<br />
Land Ownership<br />
State ownership has, on balance, remained steady<br />
since Independence at about 80 percent of Sri Lanka —<br />
significantly higher than in most European or other<br />
Asian countries. Yet much land has changed into<br />
private ownership over the interim — 13 million hectares<br />
under the Land Development Ordinance of 1935.
112<br />
Land.<br />
Trends in Human Population Growth and Forest Cover in Sri Lanka<br />
PO« v.r.e.<br />
20 -I 100<br />
Pop-Millions; FC Percent of Total Land Area<br />
Source : Department of Census & Statistics; Nanayakkara (1982), Erdlen (1988)<br />
About one-quarter of all Sri T .ankans live on land<br />
alienated under that law, which reflected a policy favoring<br />
state land alienation. During the 1970s, however,<br />
with the Land Reform Acts, the state nationalized and<br />
acquired vast new acreage, mostly large tea plantations,<br />
but also, under new land ownership ceilings, many small<br />
parcels, even including 7,600 parcels (average size 12<br />
hectares) in Colombo. Net state land ownership has<br />
increased about .4 million hectares (one million acres)<br />
since the nationalizations of the 1970s.<br />
Complex law, custom, and policy, and various<br />
kinds of tenure restrictions resulting from disposition<br />
of state land, make it difficult to grapple with land<br />
tenure conditions and trends in Sri Lanka. Data is<br />
needed on the nature (restricted and unrestricted) and<br />
extent of land under private ownership by corporations<br />
(plantation, industrial, commercial), and individuals.<br />
Major Land Tenure Laws<br />
Land Development Ordinance. Following the<br />
recommendations of the First Land Commission of<br />
1927 — a commission of inquiry established to make<br />
findings and recommendations on specific land<br />
problems — Land Development Ordinance No. 19 of<br />
1935 (revised in 1946, 1955, 1961, 1969) sought "sys-<br />
POPULATION<br />
FORtST COVER<br />
2000<br />
tematic development and alienation of Crown Lands in<br />
Ceylon." But the Act did not propose simple land sales<br />
to individuals. It provided for lands to be alienated first<br />
temporarily through a permit given upon payment of an<br />
annual rent. Once lands were developed the temporary<br />
permit could then be converted to a permanent grant.<br />
The single largest portion of the 830,832 hectares (2.05<br />
million acres) of state land given to private ownership<br />
(nearly 1 million farmer families) since 1935 fell under<br />
this statute. This included the decision to make legal<br />
about half the encroachments identified in 1979, covering<br />
205,762 hectares.<br />
The Land Development Ordinance also provides<br />
for the Government Agent to "map out," carry out land<br />
use planning for, lands appropriate for village expansion,<br />
forestry, pasture, human settlements, prevention<br />
of soil erosion, buildings, or roads. Supplemented by<br />
provisions of the Crown Lands Ordinance No. 8 of<br />
1947, .it established procedures and responsibilities,<br />
under a permanent Land Commissioner, for administering,<br />
selling, and developing state lands.<br />
Agrarian Services Act. The Agrarian Services Act<br />
58 of 1979 (as an amendment to, and continuation of,<br />
the Paddy Lands Act No. 1 of 1958) sought to redress<br />
perceived land ownership inequities by giving more<br />
I<br />
I<br />
I<br />
I<br />
I<br />
I<br />
I<br />
I<br />
I<br />
I<br />
I<br />
I<br />
I<br />
I<br />
I<br />
I<br />
I<br />
I<br />
I
Land<br />
FOREST GARDENS<br />
As Sri Lanka's population increases and arable land becomes more scarce, young farmers<br />
from the hill country are moving up steep slopes into previously unsettled, marginally productive<br />
land, often belonging to the government The phenomenon is fairly recent, with most settlers<br />
having arrived within the last decades. The farmers grow lucrative annual cash crops such as<br />
potatoes and tomatoes and rely on limited crop rotation or fallowing and heavy application of<br />
chemical fertilizers to maintain yields as topsoil erodes and fertility declines. These farming<br />
practices exacerbate soil erosion problems, reducing already marginal fertility in the highlands<br />
and increasing the silt load in dams for irrigation projects downstream. An alternative land use<br />
system for the deforested hills is needed to provide upland watershed protection and income for<br />
small farmers. One of the most promising options is forest gardens, planted to reforest the<br />
mountain pa/ana grasslands while producing multiple crops for farmers.<br />
Sri Lanka's forest gardens have been a dominant form of land use on the island for centuries.<br />
Similar agroforestry systems are known throughout the tropics. The gardens vary in structure<br />
and composition with climate and elevation. What little research has been undertaken on forest<br />
gardens in Sri Lanka has focused on those below 1,000 meters elevation — the 'midcountr/<br />
Kandyan spice gardens (Jacob and Alles, 1987).<br />
Tn fhft largely ite.fnrp^pA fjn T _qnlfqn highignrfo. nnlifo» traditional agroforcsiry systems in the<br />
forest or at the forest edge as in Indonesia and Mexico - forest gardens are begun on the degraded<br />
grassland hillsides. In much of the Uva Basin, the A horizon of the primarily red-yellow podzolic<br />
soil has eroded away. Yet, as villages expand, local farmers can create gardens of trees and shrubs<br />
on these very marginal sites in just a few years. As neighboring gardens blend together, a village,<br />
seen from above, appears as a forest island in a sea of grassland. The "village forest" provides<br />
vital refuge for native flora and fauna as the last remnants of natural forests in the highlands fall<br />
to illicit logging. As the gardens provide wildlife habitat, they may be appropriate models for<br />
nature reserve buffer zone areas, providing a gradual transition from reserve to agricultural land<br />
use.<br />
In Mirahawatte, a slightly larger than average of 600 households, forest gardens account for<br />
nearly 50 percent of private land use. Located immediately around the owners' homes, the<br />
gardens are commonly one component of the larger fanning system which may also include rice<br />
paddies, vegetable fields and/or plantation crops such as tea. Throughout the year they provide<br />
a wide variety of food, fuel, fodder, wood, medicinal and cash crops including coffee; bananas,<br />
avocados and palm sugar as well as a cool and pleasant living environment Households gather<br />
75-100 percent of their firewood from their gardens (the remainder supplied by primings from<br />
nearby tea plantations). The gardens produce such a surplus of jak fruit, a basic carbohydrate<br />
component of the villagers' diet, that 75 percent of the fruit is left to rot on the trees. Individual<br />
timber and over-mature fruit trees are removed as wood is needed and various new seedlings are<br />
planted in their stead. The gardens are never dearcut and many predate living memory in the<br />
village.<br />
113
114<br />
Land<br />
On average thegsrdens are one-third hectare in size with over 250 individual woody perennials of 29<br />
species (120 species of trees and shrubs were identified in the village). When compared with a typical<br />
agricultural field, the gardens' two-to three-tiered structure — shrubs in the understory, medium sized<br />
fruit trees in a mid-level layer and large fruit and timber producing trees in the canopy - increases the<br />
area for photosynthesis and thus production into vertical space. Structural characteristics of the gardens,<br />
including their high density and species diversity, are comparable to measures firom natural forests in<br />
similar elevations and climates. Such characteristics may be used as indicators of vital functions of forest<br />
ecosystems, including, nutrient cycling and watershed protection, suggesting that the gardens are partial<br />
analog» (Senanayake, 1987) of natural forest systems; The fundamental dynamics of the gardens, while<br />
guided by fanners* economic decision making, also follow processes of regeneration and vegetation change<br />
over time, like those of natural forests.<br />
Farmers* knowledge of these processes of change: makes it possible- to modify the surrounding<br />
landscape with such agroforestry systems. Ifwe can clearly grasp how the fanners use these forest garden<br />
systems, the principles can be applied to similar systems elsewhere. One area for further research is<br />
identification of more high value, sustained yield crops such as spices, fruits; medicines and ornamental<br />
plants and their markets from present garden species or front others which might be integrated into the<br />
existing systems and which for the small farmer, on marginal land could compete in value with annual<br />
vegetablecropsw .'...• ......•.; ;....• . ; -•. . .<br />
• Prcpaiedt)yYvomMl&iciett,Neo^thes»Resear^<br />
Association for the Advancement of Science (AAAS) meeting Sag Francisco, CA» Janoaryy 1989* - in pre» Warna, DJ&, D.<br />
iciisy, Indigenous KnowledgeSystemst 7^ Giltural Dimension* of 'Development<br />
Kcegan Paul InternationäL<br />
secure tenure rights to tenant farmers in ways that<br />
would also increase productivity of agricultural lands.<br />
Sound management of agricultural activities was to be<br />
achieved through appointed Agrarian Services Committees<br />
and cultivation officers. The Act provided for<br />
various land use planning functions to ensure suitable<br />
crops or breeds of livestock.<br />
The Act also required cultivation of only paddy<br />
during the paddy cultivation season on "paddy lands,"<br />
interpreted as land presently or at any time previously<br />
cultivated with paddy. Hence, lands in irrigation<br />
projects that might be more suited to other crops that<br />
used less water or caused less waterlogging or salinity<br />
in soils must nevertheless be devoted to paddy. Similarly,<br />
poorly drained lands in coastal regions that were<br />
once unproductive paddy fields are, legally, required to<br />
stay in paddy.<br />
Land Reform Act. The Land Reform Act of 1972<br />
established limits on private ownership of agricultural<br />
land, stipulating a per capita ceiling of 10 hectares (25<br />
acres) for paddy, and 20 hectares (50 acres) on other<br />
cropland such as tea, rubber, or coconut. Limits set for<br />
residences were 2 hectares (one half acre) for an<br />
owner, and .05 hectares (one eighth acre) for staff<br />
quarters per resident family. Amendments in 1975<br />
included acquisition of the large tea estates. The result:<br />
state acquisition of 419,000 hectares (over 1 million<br />
acres), including the tea estates of 169,000 hectares<br />
(418,000 acres). The Act established a Land Reform<br />
Commission with power to acquire and dispose of<br />
property. Of the property acquired, only about 10<br />
percent went to landless people, 4 percent of it tea land<br />
(Report of the Land Commission, 1990, p. 187).<br />
I<br />
I<br />
I<br />
I<br />
I<br />
I<br />
I<br />
I<br />
Ii. *<br />
I<br />
I<br />
I<br />
I<br />
I<br />
I<br />
I<br />
I<br />
I<br />
I<br />
Ij
I<br />
I<br />
I<br />
I<br />
I<br />
I<br />
I<br />
I<br />
I I<br />
I j<br />
I<br />
j<br />
I<br />
I<br />
I<br />
I<br />
I<br />
I<br />
1<br />
I1<br />
Government Responsibilities<br />
Management, disposition, and development of<br />
state land, and implementation of land use policies<br />
intended to foster small land owner prosperity, are<br />
highly fragmented. On one hand, custody of state land,<br />
traditionally with the Land Commissioner, has been<br />
given to a large number of private and public organizations,<br />
including ministries, departments and corporations.<br />
None has overall authority over land use<br />
decisions nor powers to enforce conservation<br />
measures. On the other hand, numerous agencies are<br />
involved in private sector land use activities, from<br />
agricultural technical assistance to the granting of permits<br />
for land development.<br />
Land management complexity is indicated by the<br />
roughly three dozen agencies within seven or more<br />
ministries that directly manage land resources. Many<br />
other agencies affect land directly and indirectly<br />
through permits and other regulations. The following<br />
summarizes major governmental roles and responsibilities<br />
concerning state land management and private<br />
land use and development:<br />
Urban land management and development, including<br />
disposition of state land, is carried out by the<br />
Urban Development Authority, the Sri Lanka Land<br />
Reclamation and Development Corporation, the National<br />
Housing Development Authority, the Ceylon<br />
Tourist Board, the Sri Lanka Port Authority, and the<br />
Sri Lanka Railways. Coordination of land development<br />
needs and proposals is difficult and often obscure.<br />
The Ministry of Lands, Irrigation and Mahaweli<br />
Development is responsible for decisions on state lands<br />
not already allocated to other institutions. The Land<br />
Commissioners Department, Forest Department and<br />
Irrigation Department are Departments under this<br />
Ministry. New Divisions — Water Resources Development,<br />
Forestry Resources Development, Forestry and<br />
Environment, Irrigation Management, and Land Use<br />
Policy and Planning — have also been established. The<br />
jurisdiction of the new agencies, is often unclear and<br />
can conflict with the mandates of the older operating<br />
agencies.<br />
The Ministry of Agricultural Development and<br />
Research is responsible for paddy, annual crops, sugar<br />
Land 115<br />
cane, horticulture, and export crop subsectors. Major<br />
organizations under the Ministry are the Department<br />
of Export Agriculture, Department of Agriculture,<br />
Department of Agrarian Services, and the Agricultural<br />
Development Authority. Overlapping responsibilities<br />
of several of these agencies, particularly among the<br />
latter three have caused confusion among local officials<br />
and residents.<br />
The Ministry of Plantation Industries is responsible<br />
for plantation agriculture research, development<br />
and management. Major organizations involved in the<br />
Plantation Agriculture sector under this Ministry are<br />
the Janatha Estate Development Board, State Plantations<br />
Corporation, Sri Lanka Sugar Corporation, Sugar<br />
Cane Research Institute, National Institute of Plantation<br />
Management, Sri Lanka Cashew Corporation,<br />
Rubber Control Department, Rubber Research Institute<br />
and the Tea Research Institute. The Research<br />
Institutes do research and extension work on ways to<br />
improve crop productivity. Other agencies have<br />
regulatory or subsidy payment functions. The Tea<br />
Commissioners Department, for example, registers tea<br />
lands, factories, and regulates tea dealers, among other<br />
duties, and the Tea Small Holdings Development<br />
Authority issues permits for planting and rehabilitation,<br />
and gives funds for replanting and infilling. The<br />
Ministry of Coconut Industries, also within the Ministry<br />
of Plantation Industries, includes the Coconut<br />
Development Authority, Coconut Cultivation Board,<br />
Coconut Rehabilitation Board, and the Coconut Research<br />
Institute. The Coconut Research Institute carries<br />
out research and extension on conservation<br />
measures and production aspects. The Coconut<br />
Development Authority and Coconut Rehabilitation<br />
Board issue permits for planting, replanting, and<br />
rehabilitation of coconut plantations. It also grants<br />
subsidies to the private sector, part of which are set<br />
aside for soil conservation.<br />
The Ministry of Policy Planning and Implementation<br />
controls development efforts in the districts<br />
financed by the Decentralized Budget and planned and<br />
executed by the District Development Secretariats. Integrated<br />
Rural Development Projects (IRDP) funded<br />
by bilateral donors and the World Bank in over a dozen<br />
districts are a major feature of the regional development<br />
effort. Projects include rainfed agriculture under
116<br />
small holdings, minor export crops, small-scale irrigation<br />
schemes, livestock enterprises, fuelwood and timber<br />
plantations.<br />
The Ministry of Rural Industrial Development,<br />
recently took control of animal husbandry enterprises<br />
formerly directed by the Ministry of Agriculture.<br />
Primary departments are the Department of Animal<br />
Production and Health which carries out research, extension<br />
and veterinary services and the Livestock<br />
Development Board, which operates a number of livestock<br />
farms and promotes livestock development by<br />
individual farmers.<br />
Findings of the Land Commission<br />
The Report of the Land Commission (1990)<br />
evaluated the effect of these and other major land<br />
policies and the ways in which they have been implemented.<br />
Among its major findings that concern basic<br />
land resource policy.<br />
• The long-standing authority of the Land Commissioner<br />
in administering and allocating state land<br />
has eroded by "increasing political interference in<br />
the selection of allottees for state lands. "(Land<br />
Commission Report). Once the sole custodian of<br />
state lands, the Land Commissioner has authority<br />
to issue directions to Government Agents or Land<br />
Officers, subject to general direction of Ministers<br />
in charge of the subject matter. Today management<br />
authority is diffused among a large number<br />
of state agencies.<br />
• Devolution of land and land settlement matters to<br />
the Provinces under the 13th Amendment creates<br />
Land<br />
"an urgent need to develop a comprehensive land<br />
administration system" based on sound scientific<br />
policy guidance that can be administered by the<br />
provinces.<br />
• Goals sought by the Land Reform Act have not<br />
generally been achieved. The Land Commission<br />
found that the Act did not result in significant land<br />
redistribution, increased employment, or boost<br />
total production, although by consolidating land<br />
ownership it did open new possibilities for more<br />
integrated planning and development.<br />
The Land Commission conducted a survey of local<br />
level officials, based on a questionnaire, to determine<br />
their opinions regarding the present system of administration<br />
and management of state lands in their<br />
areas. The general response: it was not satisfactory.<br />
Among the reasons: lack of trained personnel, inability<br />
to control encroachments, and functional overlap<br />
among agencies. About 80 percent of those questioned<br />
recommended creation of a central coordinating<br />
authority for all land matters.<br />
The Commission also found that no inventory of<br />
state land was maintained by local officials in charge^f<br />
land, and virtually no land use planning was carried out<br />
before land was used or approved for a specific use.<br />
Despite reinstitution of the "mapping out" requirements<br />
in 1981, little information on scientific land<br />
capability and land use appeared to be applied to land<br />
development decisions.<br />
I<br />
I<br />
I<br />
I<br />
I<br />
I<br />
I<br />
I<br />
I<br />
I<br />
I<br />
I<br />
I<br />
I<br />
I<br />
I<br />
I<br />
I<br />
I<br />
I<br />
I
I<br />
I<br />
I<br />
I<br />
Î<br />
I '.<br />
I<br />
I<br />
I<br />
II<br />
I<br />
Und 117
Land.<br />
Land degradation on steep slopes contributes significantly to costly earth slides.<br />
I<br />
I |<br />
I<br />
I<br />
I<br />
I<br />
I<br />
I<br />
I<br />
I<br />
I<br />
I<br />
I<br />
I<br />
I<br />
I<br />
I<br />
I<br />
I<br />
I I
I<br />
i :<br />
! ;<br />
I<br />
I<br />
j<br />
! ;<br />
• r i<br />
\ .<br />
!<br />
I<br />
I<br />
I<br />
I »<br />
I<br />
I<br />
I<br />
I<br />
Land degradation denotes all natural or<br />
anthropogenic processes that diminish or impair land<br />
productivity. Natural processes include climatic changes<br />
and accelerated intensity of winds and waves.<br />
Among the anthropogenic factors, over - use of land and<br />
water, deforestation, excessive use of agro-chemicals,<br />
and careless disposal of wastes often degrade land. In<br />
Sri Lanka, man-induced land degradation is more significant<br />
than natural forces. It is manifested through<br />
high rates of soil erosion and silt at ion. landslides,<br />
floods, emerging problems of salini/ation, coastal<br />
erosion, and loss of productivity of agricultural lands.<br />
Problems of land degradation in Sri Lanka have<br />
been evident throughout her history. Cliena cultivation<br />
practised since prehistoric man undoubtedly contributed<br />
to deforestation and associated problems at<br />
least locally and temporarily. Abandonment of the<br />
ancient hydraulic civilization in the Dry Zone may have<br />
been caused, at least in part, by loss of soil fertility or<br />
the development of salinity in rice fields due to centuries<br />
of continuous use.<br />
An early reference to land degradation during the<br />
colonial period concerned impact of Dutch canal construction<br />
on swampy rice fields and fresh water bodies<br />
along the western coast. Some claim that<br />
Muthurajawela, a flourishing paddy Held during the<br />
time of kings, turned into a salt marsh as a result of such<br />
coastal development activities.<br />
Und 119<br />
PART II<br />
LAND DEGRADATION<br />
Significant land degradation began during the past<br />
150 years, particularly after the advent of commercial<br />
plantation agriculture. In 1900, with a population of<br />
only 3.5 million, Sri Lanka had approximate forest<br />
cover of 70 percent. By 1953, when population reached<br />
8.1 million, natural forest cover had diminished to<br />
approximately 44 percent, and when population<br />
doubled by the mid-1980s, the forest was cut by nearly<br />
half, to less than 25 percent. By that time (he man/land<br />
ratio — a rough measure of natural resource availability<br />
per capita relevant to an agricultural economy -equalled<br />
one acre per person.<br />
The well known inverse relationship between<br />
population growth and diminishing forest cover (see<br />
Figure 6.11) does not reveal the magnitude of the associated<br />
land degradation. Deforestation has caused<br />
the most significant impacts in the watershed areas of<br />
the hill country where forests are most needed. Estimated<br />
forest cover has declined to only 9 percent<br />
there.<br />
Soil Erosion<br />
Serious concerns about soil erosion in Sri Lanka<br />
have been expressed since 1873, when Sir J.D. Hooker<br />
stressed dangers of indiscriminate plantation agriculture.<br />
One result was the restriction on land cultivation<br />
above 1,525 meters. In 1931, a Committee on Soil<br />
Erosion documented the damage caused by plantation<br />
crops. The Soil Conservation Act of 1951, which followed<br />
devastating earthslips in the hill country, in particular<br />
in the Kotmale valley, has been largely neglected<br />
since. As Stocking (1986) observed, 'The reality of soil<br />
conservation in Sri Lanka today, is one of much<br />
rhetoric, little action: the concern of some, the disdain<br />
of others."<br />
One critical measure of soil erosion and its impacts<br />
is sedimentation.In one of the earliest estimates of<br />
sediment transport, based on measured sediment<br />
yields, Joachim and Pandithasekera (1930), estimated<br />
132,000-833,000 tons/year (giving a soir loss of 115<br />
tons/hectare) for the upper Mahaweli catchment, 55<br />
percent of which was under tea. The sediment yield óf<br />
the Mahaweli Ganga was estimated recently By<br />
NEDECO (1984), in collaboration with the Irrigation<br />
Department. These studies indicated an average 15<br />
million tons of sediment, calculated for the period 1952-<br />
1982, passed in the upper Mahaweli watershed through
120<br />
(a) Mid-country Wet Zone (Peradeniya)<br />
Soil type : Red Brown Latasol.<br />
Old seedling tea (no conservation)<br />
Well managed tea (contour drains)<br />
Kandyan mixed home gardens<br />
(b)Up-country Wet Zone (Talawakelle)<br />
Soil type : Red Yellow Podsol<br />
Bare, Clean weeded clonal tea<br />
One-year old clonal tea with much<br />
(c)Mid-country Intermediate Zone (Hanguranketa)<br />
Soil type : Immature Brown Loam<br />
Tobacco (No conservation)<br />
Capsicum (No conservation)<br />
Carrots (No conservation)<br />
(d) Low-country Dry Zone (Maha Illuppallama)<br />
Soil type : Reddish Brown Earths<br />
Sorghum/Pigeon Pea<br />
Sorghum/Pigeon Pea (with mulch)<br />
Cotton<br />
Cotton with mulch<br />
iii.Field estimates of soil under chena in mid-country<br />
Tobacco in 45 percent slope<br />
Newly cleared chena plot on 45 percent slope at<br />
Panamure (Ratnapura District)<br />
Mean Annual rate of soil loss over a period of 40 years<br />
Source : Stocking (1986)<br />
the Peradeniya gauging station. The Polgolla barrage<br />
trapped about 70 percent of this load.<br />
Almost 44 percent of the capacity of the Polgolla<br />
reservoir was silted by the end of 1988 (Perera, 1989),<br />
just 12 years after its commissioning. This same<br />
phenomenon is also reflected in the two-thirds reduction<br />
in sediment loads now passing below the reservoir<br />
through downstream gauging stations such as<br />
Weragantota.<br />
Other estimates of soil loss due to erosion have<br />
been reported from different parts of the country.<br />
TAMS/USAID (1980) reports soils losses in the Maha<br />
Land<br />
Soil Losses from Cultivated Land<br />
Figure 6.12<br />
tons/hectare/year<br />
40.00<br />
00.24<br />
00.05<br />
52.60<br />
00.07<br />
70.00<br />
38.00<br />
18.00<br />
21.30<br />
03.90<br />
22^0<br />
02.00<br />
200.00<br />
100.0<br />
Oya catchment (mid-country) in lands under tobacco<br />
on slopes ranging from 45 percent to 60 percent. Estimates<br />
range from 388 to 913 t/ha/year. Although<br />
generally considered overestimates, these<br />
demonstrate the dangers of cash crop cultivation on<br />
high slopes. Contrasts in soil loss from different locations<br />
have been estimated by the Soil Conservation<br />
Division of the Department of Agriculture (Stocking,<br />
1986) based on small plots on slopes in the 20-40 percent<br />
range and for chena. Results are summarized in<br />
Figure 6.12.<br />
I<br />
h I<br />
I<br />
I<br />
I<br />
I<br />
I<br />
I<br />
I<br />
I<br />
I<br />
I<br />
I<br />
I<br />
I<br />
I<br />
I<br />
I<br />
I<br />
I
I<br />
I<br />
I<br />
I<br />
I<br />
I<br />
I!<br />
P<br />
I<br />
I<br />
I<br />
I<br />
I<br />
I<br />
I<br />
I<br />
YEAR<br />
1930<br />
1947<br />
1947<br />
1952<br />
1957<br />
1964<br />
1970<br />
1973<br />
1978<br />
1979<br />
1979<br />
1981<br />
1981<br />
1982<br />
1982<br />
1982<br />
1982<br />
1983<br />
DISTRICT<br />
Kegalle<br />
Kegalle<br />
Kegalle<br />
Land 121<br />
PARTICULARS <strong>OF</strong> LANDSLIDES 1930-1985<br />
Nuwara Eliya<br />
Kegalle<br />
Nuwara Eliya<br />
Nuwara Eliya<br />
Nuwara Eliya<br />
Kegalle<br />
Ratnapura<br />
Kalutara<br />
Kegalle<br />
Kegalle<br />
Kegalla<br />
Kandy<br />
Ratnapura<br />
Matale<br />
Kegalle<br />
LOCATION<br />
Thalawela<br />
Kadugannawa<br />
Aranayake-<br />
Sela-wakanda<br />
Udahewaheta<br />
Pahala Kadugannawa<br />
Walapane<br />
Walapane<br />
Walapane<br />
Bulath Kohupitiya<br />
Wegalla<br />
Kuruvita-Akurana<br />
Kanda<br />
Bulathinhala<br />
Yatiyantota<br />
Polpetiya<br />
Aranayake-Berawala<br />
Mawanella-<br />
Heenalipana Kanda<br />
Pathahewaheta<br />
Paginiwela Kanda<br />
Palmadulla<br />
Pathulpana Kanda<br />
Pikakanda<br />
Pansalatenna<br />
Palindagama<br />
Mawanella<br />
Elangapitiya Kolani<br />
Figure 6.13<br />
MAJOR/MINOR DEATHS<br />
Major<br />
Major<br />
Minor<br />
Minor<br />
Major<br />
Minor<br />
Major<br />
Major<br />
Major<br />
Major<br />
Minor<br />
Major<br />
Major<br />
Major<br />
Minor<br />
Major<br />
Major<br />
Minor<br />
Not known<br />
40<br />
Not known<br />
Not known<br />
05<br />
19<br />
13<br />
03<br />
05<br />
HOUSES<br />
DAMAGED<br />
Not known<br />
Not known<br />
Not Known<br />
Not known<br />
15<br />
17 families affected<br />
Not known<br />
02<br />
Not known<br />
02<br />
Not known<br />
08<br />
23<br />
Not known<br />
Not known<br />
Not known<br />
10<br />
10<br />
Not known<br />
20<br />
30<br />
03<br />
Not known<br />
15<br />
Not known<br />
15
f<br />
YEAR<br />
1984<br />
1984<br />
1984<br />
1984<br />
1984<br />
1984<br />
1985<br />
1985<br />
1985<br />
1985<br />
1985<br />
1985<br />
1985<br />
DISTRICT<br />
Kalutara<br />
Badulla<br />
Badulla<br />
Ratnapura<br />
Ratnapura<br />
Ratnapura<br />
Nuwara Eliya<br />
Nuwara Eliya<br />
Kalutura<br />
Kegalle<br />
Kandy<br />
Kandy<br />
Ratnapura<br />
Source: Social Services Department<br />
Land<br />
Particulars of Landslides 1930<br />
( Continued)<br />
LOCATION<br />
Bulathsinhala<br />
Agalawatta<br />
Matugama<br />
Haliola-Beddegam<br />
Bandarawela-<br />
Livanagahawela<br />
Emhilipitiya<br />
Ih.ila Anduliwewa<br />
Kolonnar Bulutota<br />
Kuruwiia, Ratnapura<br />
Eheliyagoda,<br />
Balangoda<br />
Norton Bridge<br />
Town Division<br />
Matugama Uduwala<br />
Warakapola<br />
Thiyambarahena<br />
Kanda<br />
Galagedara<br />
Bodikulawa<br />
Nawalapitiya<br />
Pemross Est.<br />
Elapatha<br />
Kohombakanda<br />
Figure 6.13<br />
MAJOR/ MINOR<br />
Major<br />
Minor<br />
Minor<br />
Minor<br />
Minor<br />
-1985<br />
DEATHS<br />
42<br />
Not known<br />
Notknown<br />
Notknown<br />
02<br />
(40 threats of Minor earth slips reported)<br />
Minor<br />
Major<br />
Minor<br />
Major<br />
Minor<br />
Major<br />
Major<br />
05<br />
Not known<br />
Not known<br />
10<br />
Not known<br />
04<br />
Not known<br />
•<br />
HOUSES<br />
DAMAGED<br />
Not known<br />
02<br />
21<br />
21<br />
05<br />
Not known<br />
40<br />
Not known<br />
03<br />
Not known<br />
10<br />
46
I<br />
I<br />
I<br />
I<br />
I<br />
I<br />
I<br />
I<br />
I<br />
I j<br />
I<br />
I;<br />
I<br />
I<br />
I<br />
I<br />
I<br />
I<br />
I<br />
I<br />
Several other estimates, mainly concerning soil<br />
erosion in the tea plantations, have been made by individual<br />
researchers (Manipura, 1972; Krishnarajah,<br />
1985; Russell, 1980; and El-Swaify, et al., 1983). They<br />
seem to range from zero erosion rates in mulched and<br />
well-maintained clonal tea plots in the up-country to<br />
remarkably high losses of over 1000/t/ha/year in midcountry<br />
locations. Such extreme situations, while rare,<br />
demonstrate the importance of well-maintained<br />
ground cover in controlling soil losses, and how tea can<br />
be grown on steep slopes.<br />
Soil loss occurs in all agro-ecological zones, although<br />
its intensity can vary according to the climate,<br />
slope, and ground cover. The worst affected area —<br />
mid-country — falls within elevations of 300-1000<br />
meters. At higher elevations, although slopes are steep,<br />
rainfall intensities are relatively lower. In the lowcountry,<br />
where rainfall intensity can be high, slopes are<br />
less steep. Therefore, with Red Brown loamy soils<br />
erosion potential appears highest in the mid-country,<br />
where plantation agriculture began.<br />
Erosion from house and road construction sites<br />
may be extremely high in localised watersheds near<br />
urban areas on steep slopes and at many civil engineering<br />
sites (Weil, 1981). Some examples are the Galata<br />
settlement near Gampola, and new road developments<br />
in the Victoria and Kotmale areas.<br />
Landslides and Related Phenomena<br />
Landslides and high soil erosion often occur in the<br />
same areas, but landslides cause more sudden and<br />
obviously damaging, results. Landslides commonly<br />
occur following heavy rain storms, particularly in the<br />
hill country. Available evidence, though not quantitative<br />
or conclusive suggests that the frequency and magnitude<br />
of landslides' has increased in recent years,<br />
causing serious damage to life and property<br />
(Jayawardhana, 1988).<br />
Measures normally adopted for soil conservation<br />
will not usually prevent landslides. Some, like contour<br />
ditches, may even encourage landslides by allowing<br />
greater infiltration of water to the subsoil and lubrication<br />
of unstable soil masses.<br />
Land 123<br />
Although records of past landslides maintained by<br />
the Social Services Department, are neither systematic<br />
nor comprehensive (Wijeratne, Banda, 1985), they are<br />
summarized in Figure 6.13. Records before 1970 appear<br />
sketchy, and many landslides have certainly gone<br />
unrecorded, like the Kotmale landslides of 1947. Small<br />
landslides that do not cause much significant damage<br />
to life and property are not recorded by the Geological<br />
Survey or the Social Services Department. In 1986,<br />
however, landslides in the Maturata area displaced<br />
over 1,500 families. The NBRO recorded some 136<br />
landslides during that year, and the Remote Sensing<br />
Unit of the Survey Department detected many linear<br />
earthslips in 1986 through aerial surveys of affected<br />
areas. The landslides of 1986 left over 25,000 persons<br />
homeless, and many villages became totally inaccessible<br />
due to disrupted transport. The appearance of<br />
cracks in the walls of houses, observed along the<br />
perimeter of the Kotmale reservoir and at Maturata,<br />
indicated the potential for further slipping. Affected<br />
families had to be accommodated in special refugee<br />
camps and later to be relocated at great expense to the<br />
State.<br />
In early June 1988, ironically on World Environment<br />
Day, Sri Lanka experienced perhaps its worst<br />
landslide damage, which caused over 300 deaths. In the<br />
Kegalle District 167 people died in the AGA Division<br />
of Galigamuwa alone (Madduma Bandara, 1989).<br />
From reports in Parliament some 225,000 people in ten<br />
districts were affected by floods and landslides that<br />
destroyed over 15,000 homes. Cost for rehabilitating<br />
these "environmental refugees" was estimated at about<br />
120 million rupees at 1988 prices (Madduma Bandara,<br />
1989).<br />
Causes and Remedies, The devastating experience<br />
of landslides in the 1980s led to a search for<br />
reasons. In the public and academic debate that ensued<br />
the attributed reasons included cultivation of<br />
tobacco on steep slopes, impacts of the Accelerated<br />
Mahaweli project, high intensity rainstorms, geological<br />
instabilities, and aftereffects of the colonial land clearing<br />
in the hills (Vitanage, 1988; Priyasekera, 1986;<br />
Madduma Bandara, 1986; Dimantha, 1986;<br />
Dahanayake, 1986).
124<br />
Land<br />
Erosion and Accretion Along the Coasts of Selected Countries<br />
Sri Lanka"<br />
Wost Coast, Donmark<br />
rX\r Accretion<br />
World'« Coastline«<br />
South Shor«. Now Jaraay.USA<br />
Erosion k%| Neutrol<br />
* Th* percentages show «ht «xtramai of th« »itimottd rangt« for Sri LankaCoasts.<br />
Source •• Sri Lanka Mas fr Plan for Coast Erosion Managtmtnt (1986)<br />
Conditions which favor landslides fall generally<br />
under two broad groups: First are the geological, structural,<br />
topographical and climatic factors of an area over<br />
which humans have little if any control; second are the<br />
conditions that humans impose on the land through<br />
destruction of watershed forests by fire or felling,<br />
obstruction of natural waterways and drainage lines, or<br />
Figure 6.14<br />
construction of roads and buildings in vulnerable locations.<br />
What "triggers" most landslides is saturation of the<br />
unstable subsoil layers and a build-up of water pressure<br />
along critical zones. Saturation of the soil mass results<br />
from the intense and continuous rainfall so common in<br />
the hill country and the Wet Zone. Landslides begin to<br />
appear when such rainstorms exceed a certain<br />
I<br />
I<br />
I<br />
I<br />
I<br />
I<br />
I<br />
I<br />
I<br />
I<br />
I<br />
I<br />
I<br />
I<br />
I<br />
I<br />
I<br />
I<br />
I<br />
I<br />
I
I<br />
I<br />
I<br />
Ii ':<br />
I<br />
I<br />
!<br />
I<br />
i .<br />
I<br />
I<br />
1<br />
I<br />
1<br />
I<br />
1<br />
Land<br />
Cliff, Dune and<br />
Backshore Erosion<br />
Sources of<br />
( Arrows<br />
Beach Replenishment<br />
Rivers<br />
Dune and Backshore<br />
Storage<br />
Winds *^"<br />
(Supply and Deflection)<br />
inlets and Lagoons<br />
including Outwash<br />
Mining<br />
Land 125<br />
Inputs and Losses to the Littoral Sand Budget<br />
Indicate Mean Net Transport of Sand)<br />
. -<br />
O Q.<br />
CO<br />
C<br />
CO<br />
I— .<br />
Littoral Zone<br />
! CD S<br />
~ r ~"-- Ô<br />
• * -C<br />
'• CO<br />
• CD<br />
: c o<br />
-r— -j<br />
\ \<br />
_ongshore Currents<br />
Tidal Currents<br />
Longshore Winds<br />
^-—<br />
—*<br />
„-—<br />
Source : Shore Protection Manual ( 1973) Depanment of Army, U.S. Crops of Engineers<br />
Figure 6.15<br />
s<br />
Ocean<br />
~~"~\ Onshore-Offshore<br />
Transport<br />
* Submarine Canyon<br />
Dredging<br />
>. Calcium Carbonate<br />
(Production and Loss)<br />
'"""Hydrogenous Deposition<br />
Beach Replenishment
126<br />
Location and<br />
Name of river<br />
Kelani Ganga<br />
Maha Oya<br />
GinOya<br />
SUBTOTAL<br />
Kalu Ganga<br />
Deduru Oya<br />
Gin Ganga<br />
Nilwala Ganga<br />
Land<br />
Estimated Volume<br />
Number of<br />
landing sites<br />
181<br />
61<br />
2<br />
67<br />
2<br />
41<br />
7<br />
363<br />
Note : a cube = 100 cubic feet or approximately 3 cubic meters.<br />
of Sand Mining inSri<br />
Lanka, 1984<br />
Number of cubes*<br />
removed in 1984<br />
222,771<br />
111,720<br />
79,445<br />
46,667<br />
22,896<br />
21,563<br />
Source: CCD Internal Report No.lI:<br />
A census of the exploitation of sand seashell resources in the Coastal Zone of Sri Lanka (1984).<br />
COASTAL LAND<br />
2.868<br />
CCD Internai raportNo.Ç: Soelo-tconomlc<br />
of thoa* angagad In tha coral mining<br />
Induatry (from Ambalangoda to Dlkwalla)<br />
Figure 6.16<br />
2,005<br />
507,866<br />
Coral Collected from Sri Lanka's<br />
Southwestern Coast in 1984<br />
Total Collection 18,059 Metric Tons<br />
BEACH<br />
5.377<br />
Figure 6.17<br />
INLAND<br />
7.532<br />
Total<br />
43<br />
21<br />
15<br />
9<br />
4<br />
4<br />
1<br />
97<br />
FROM REEF<br />
2.282<br />
* As defined by Coast Conservation Act of 1981<br />
I<br />
I<br />
I<br />
I<br />
I<br />
I<br />
I<br />
I<br />
I<br />
I<br />
I<br />
I<br />
I<br />
I<br />
I<br />
I<br />
I<br />
I
I<br />
I !I<br />
I<br />
I<br />
I<br />
I<br />
I<br />
I<br />
I<br />
I<br />
I<br />
I<br />
I<br />
I<br />
I<br />
I<br />
1<br />
I<br />
I<br />
I<br />
threshold leveL Priyasekera (1986) argued that a<br />
threshold figure of 350 to 400 millimeters of continuous<br />
rainfall during two consecutive days could cause<br />
landslides in areas prone to them. Kuruppuarachchi<br />
(1987) found a direct correlation between antecedent<br />
precipitation and landslides.<br />
Increasing damage to life and property from<br />
landslides obviously relates to the spread of human<br />
settlements into unstable areas. Needs for mapping<br />
and identification of such areas are now recognized by<br />
the authorities, but response has been slow.<br />
Coastal Erosion<br />
Legends and narratives of coastal retreat in Sri<br />
Lanka go back over 2,000 years, including references<br />
suggesting supernatural causes. Some geologists have<br />
attributed it to general coastal subsidence while others<br />
have suggested that the island has tilted up in the north<br />
and down in the south. Whatever the cause, coast<br />
erosion in Sri Lanka is not unusual in terms of world<br />
trends, as indicated in Figure 6.14.<br />
Coast erosion hazard exhibits both temporal and<br />
spatial variability. Erosion hazard is greatest when<br />
monsoons are onshore. The southwest monsoon (from<br />
May-September) with its fetch extending over the<br />
breadth of the Indian Ocean, generates waves with high<br />
energy. This monsoon delivers its greatest energy to the<br />
areas between Kalpitiya and PotuviL The northeast<br />
monsoon (from November-January) blows over a more<br />
limited fetch of the Bay of Bengal and accordingly<br />
delivers somewhat less energy to the shore. Its effects<br />
are mainly felt along the north coast and on the east<br />
coast as far south as Potuvil. Spatial variation of<br />
erosion hazards depend on an area's erosion susceptibility,<br />
ocean floor and coastal margin, and the supply<br />
and availability of beach material.<br />
There are several natural defenses against erosion.<br />
Although annual monsoons regularly cause much<br />
damage in some locations, small waves and weak variable<br />
winds prevail most of the time. Devastating<br />
cyclones are rare and major storms usually affect only<br />
sparsely populated coastal areas of the east and<br />
northwest. Coral and sandstone reefs that run parallel<br />
to most of Sri Lanka's shoreline act as natural breakwaters.<br />
Land 127<br />
Although the beaches are receding in most parts of<br />
the island, the impact of coast erosion is most severe<br />
along the western and southwestern coasts, where<br />
development and population are most intense. The<br />
highway and railway are routed through most of these<br />
coastal sectors.<br />
Along the coastal segment extending 685<br />
kilometers from Kalpitiya to Yala National Park, about<br />
175,000-285,000 square meters of coastal land are lost<br />
annually through erosion. Of this, about 145,000 square<br />
meters are lost annually from the 137 kilometer coastal<br />
segment that extends from the mouth of the Kelani<br />
River to Talawila (Kalpitiya peninsula)..<br />
Erosion along Sri Lanka's beaches is highly localized,<br />
with wide variation in erosion and accretion rates.<br />
Whether erosion in a particular sector is viewed as a<br />
problem or not depends on the upland uses. Despite<br />
seasonal erosion or accretion, continuing land loss is<br />
evident in some parts along some sectors. Old maps<br />
and survey plans of landed properties in Seenigama<br />
area indicate that considerable land has been lost to the<br />
sea. The small island on which the Seenigama dévale<br />
now stands formed a part of the mainland some years<br />
ago. Information based on qualitative estimates of<br />
coastal residents suggest that on the average the coast<br />
line of Sri Lanka receded by about one meter during<br />
the last three decades, while accretion was only half a<br />
meter.<br />
About 75 percent of the graded hotels in Sri Lanka<br />
and 80 percent of the hotel rooms are located in<br />
coastal areas. A majority of these hotels have less than<br />
a 15-meter setback between buildings and the water<br />
Une. No major hotel buildings have been destroyed by<br />
erosion to date because coast protection schemes have<br />
saved the most vulnerable. However, smaller structures<br />
such as restaurants and swimming pools have been<br />
damaged or destroyed. Several hotels have experienced<br />
decreased occupancy attributed to their<br />
diminished beach frontage.<br />
There is little information available regarding the<br />
damage caused by erosion in economic terms, but<br />
public and private investments in protecting the<br />
shoreline are significant
128<br />
Although erosion has received public attention because<br />
of its impacts along the populous west and southwest<br />
coasts, comparatively little attention has focused<br />
on problems caused by accretion. These include<br />
obstruction of outlets affecting: escape of flood waters<br />
(the Kaluganga and Maha Oya), navigation (Negombo<br />
Lagoon, Chilaw Lagoon), migration offish and shellfish<br />
species between an estuary or lagoon and the sea<br />
(Nandi KadaL and Nayaru Lagoon in the Mullaittivu<br />
District), silting of harbors (Kirinda Harbour) and<br />
fishery habitats (Negombo Lagoon), outlets for urban<br />
and industrial pollutants (Lunawa Lagoon), and intake<br />
sites for seawater required for salterns. Seasonal accretion<br />
in Kandakuliya imposes restrictions on certain<br />
fishery activities, such as the Madel fishery.<br />
Accretion is also caused by wind and aggravated by<br />
removal of dune vegetation. In certain areas close to<br />
Batticaloa and PotuviL sand blown away during the dry<br />
season is deposited on paddy lands and cocon ut plantations.<br />
Causes and Remedies. The major source of beach<br />
sand in Sri Lanka is sediment carried down by the<br />
rivers, but other sources include sediment from eroding<br />
coastal features and offshore sand brought onshore.<br />
Broken seashells and corals contribute to a very limited<br />
extent. Under the action of natural processes, such as<br />
waves, currents and winds, sediment moves on and off<br />
and along the beaches. If the sand supplied to a particular<br />
coastal sector is less than what is carried away,<br />
the shoreline will erode. Sources of inputs and losses<br />
on the littoral sand budget are illustrated in Figure 6.15.<br />
Natural processes cause most shoreline erosion,<br />
but various human activities contribute. The most significant<br />
of these include sand mining from river beds<br />
and beaches, coral mining and destruction of reefs,<br />
removal of mangroves and other coastal vegetation, and<br />
improper location or construction of maritime structures,<br />
such as shoreline protection works, fishery harbors,<br />
or river outfall training schemes.<br />
Of the human activities aggravating erosion, most<br />
widespread is sand mining in rivers, estuaries and<br />
beaches. Figure 6.16 indicates the removal of sand in<br />
the western and southwestern sectors in 1984.<br />
Land .<br />
Demands for sand are high in and around areas where<br />
development pressure is high.<br />
Coral mining, is not only a coastal or offshore<br />
problem. Although it has been restricted largely to<br />
certain parts of the southwest coast, has caused significant<br />
damage to the fringing reefs and is rendering<br />
the coasts more erosion prone. Figure 6.17 indicates<br />
the removal of coral along the southwestern coast in<br />
1984. Coral mining was brought under control on the<br />
east coast in 1978, but with civil unrest in recent years<br />
it has reportedly become serious again.<br />
Salinity and Waterlogging<br />
Land degradation due to salinity and waterlogging<br />
is primarily associated with coastal areas and irrigated<br />
lands in the Dry Zone of Sri Lanka, which covers over<br />
half a million hectares.<br />
Because irrigation has been practised in these<br />
areas since Sri Lanka's earliest history, salinity should<br />
have been a problem at least in patches of irrigated<br />
lands. The term 'kivula' or 'kivul bim' (or salinity affected<br />
lands) suggests that the problem did arise.<br />
With development of modern irrigation networks,<br />
it was anticipated that salinity would become a problem<br />
over the years, as it has in many other countries with<br />
large irrigated areas. However, because Sri Lanka's<br />
Dry Zone is not as arid as most other areas of the world<br />
affected by salinity, salts that accumulate in top soils<br />
tend to flush out with the high intensity seasonal rains.<br />
Salts go deeper, as indicated by the increasing salinity<br />
levels in dug-wells in irrigated areas during the initial<br />
phase of the rainy season (Arumugam, 1970).<br />
Unfortunately few systematic studies exist on land<br />
degradation from soil salinization in Sri Lanka; we have<br />
no records of the actual extent of lands affected by<br />
salinity or data that indicate its recent trends. Much of<br />
the available information comes from sporadic surveys.<br />
Thus Gangodawila (1990) compared soil salinity levels<br />
in the valley bottom lands of purana villages under<br />
minor irrigation with those in the 'H' irrigation system<br />
of the Mahaweli Project. These investigations were<br />
carried out in locations that the farmers themselves<br />
cited as being affected by waterlogging and salinity.<br />
Results of such studies undoubtedly indicate the<br />
I<br />
I<br />
I<br />
I<br />
I<br />
I<br />
I<br />
I<br />
I<br />
I<br />
I<br />
I<br />
I<br />
I<br />
I<br />
I<br />
I<br />
I<br />
I<br />
I<br />
I
I<br />
I<br />
I<br />
I<br />
I<br />
I<br />
I<br />
I<br />
I<br />
I<br />
gradual emergence of problems of salinity, particularly<br />
in areas of poor soil drainage like valley bottoms, and<br />
sites of old tank-beds converted to irrigated rice fields<br />
under the Mahaweli Project. However, it is difficult to<br />
predict the significance of long-range salinity from<br />
these data. The problem of soil salinity exists even in<br />
thepurana villages, although not at the same scale as in<br />
the Mahaweli Project areas. There are serious<br />
drainage problems to be remedied in the Mahaweli<br />
systems.<br />
Causes and Remedies. In contrast to salinity<br />
caused by irrigation, salinization of low-lying farming<br />
lands due to intrusion of sea water has always been a<br />
problem, stimulated by human intervention in Sri<br />
Lanka's coastal areas. Some development activities<br />
such as the construction of canals during the colonial<br />
period led to such problems (Brohier, 1935). At the<br />
same time a large extent of land was cultivated by<br />
providing pumping and drainage facilities in southwestern<br />
coastal areas. These areas were neglected in<br />
recent decades due to high costs of fuel for pumps<br />
following the energy crises in the 1970s; it is no longer<br />
economical to grow paddy in once fertile lands. Paddy<br />
fields covering nearly 15,000 hectares in the Galle District<br />
are affected by salinity during high tides that extend<br />
their influence 10-15 kilometers into the interior<br />
in some places (Land Commission, 1989). Engineering<br />
structures built to contain saline intrusions have not<br />
been effective. In some cases, as at the Tangalu<br />
Welyaya fed by Kirama Oya in the Hambantota district<br />
(HIRDEP, 1989), they have made conditions worse.<br />
Alternative land and water uses, including tourism<br />
and sustainable natural fisheries, can make these areas<br />
more productive. Over 70,000 hectares of low-lying<br />
marshy land around the island have been identified by<br />
the government for reclamation. Some areas located<br />
closer to urban areas are now being reclaimed by the<br />
Sri Lanka Reclamation and Development Corporation.<br />
Careful assessments of the hydrologie and environmental<br />
impacts of reclamation schemes will be necessary to<br />
help determine their costs and benefits.<br />
Land 129<br />
EVALUATING IMPACTS<br />
AND PRIORITIES<br />
Some causes of land degradation, such as intensified<br />
land use and over-exploitation of resources, appear<br />
destined to continue in spite of measures to<br />
control them. Policy makers need to identify the activities<br />
causing the most harmful long-term degradation<br />
and develop methods and incentives that can effectively<br />
reduce the impacts.<br />
To establish priorities policy makers need adequate<br />
quantitative measurement of these significant<br />
land impacts that can help them compare the costs and<br />
benefits of remedial actions. Unfortunately, quantitative<br />
measures useful to policy makers are highly inadequate.<br />
There is hardly any information to quantify the<br />
precise impacts of soil erosion. Stocking (1986) made<br />
an attempt in this direction on the basis of field observations<br />
and anecdotal evidence. He believed that Wet<br />
Zone soils had a relatively high tolerance to erosion,<br />
and that the main limitations to land use were the<br />
eventual stoniness and limited rooting depth due to<br />
high rates of erosion.<br />
A key question is how soil erosion reduces productivity<br />
from loss of fertilizers, organic matter, and available<br />
water capacity. Measurements have been difficult<br />
because effects are gradual and cumulative, and effects<br />
may vary with soil type and depth. The mid-country wet<br />
zone appears to suffer the greatest productivity impact,<br />
as reflected in the low productivity and even abandonment<br />
of some tea estates. Many Dry Zone soils display<br />
a concentrated nutrient distribution in the top soil and<br />
a critical water holding capacity. Any erosion of these<br />
soils can reduce the crop yields drastically, as is evident<br />
in areas where the chena cycle has become shorter over<br />
the years. More precise measurements of lost productivity<br />
throughout Sri Lanka, including production<br />
projections ten years hence, are needed, given continued<br />
erosion trends.<br />
Sedimentation of tanks, irrigation works, and upcountry<br />
reservoirs directly result from soil loss in catchment<br />
areas. Experts have differed in judging the<br />
seriousness and costs of sedimentation. Although<br />
some consultant reports (TAMS/USAID, 1980) contend<br />
that the lifespan of new Mahaweli reservoirs will
130<br />
r<br />
Und<br />
Chena Cultivation<br />
With A Difference<br />
Sri Lanka's Co-operative Reforestation, or Chena Reforestation, scheme is modelled on traditional<br />
chena cultivation. Similar to the Burmese taungya reforestation system it consists of leasing state land<br />
containing low quality or non-productive natural forest to local villagers for them to carry out the<br />
traditional slash and burn followed by cultivation of cash crops. It differs from the traditional chena,<br />
however, because lessees must also plant forest species as directed by the Forest Department; and cash<br />
crops are restricted to the intervening space. The Forest Department supplies nursery plants of the forest<br />
species.<br />
Each lessee obtains up to two hectares and signs an agreement with the Divisional Forest officer to<br />
plant the forest species and tend them for three years, during which time he can raise several rotations of<br />
cash crops. If planting and maintenance attains the required standard, the lessee receives a modest reward<br />
by the Forest Department After three years, the lessee leaves the area and the Department assumes full<br />
control over what by then is a young forest plantation. Because a lessee may. obtain one area every year,<br />
he can, at any given time, be planting and maintaining three co-operative reforestation blocks»<br />
This scheme gained popularity after the earlylPóOsandatitspeakmcorporatedaround^OOOhectares.<br />
per yean It operated only in the Dry Zone, and the forest species planted was teak. Nearrf altof therteak<br />
plantations in the country (estimated at 40,000 hectares) were raised, under dûs progn<br />
Main advantages of the system: ^ ; - •<br />
• It attracted chena cultivators who would otherwise have practised traditional shifting,cultivation<br />
and left behind weed-infested fallow land;<br />
• Areas under co-operative reforestation can provide good harvests of vegetables and other<br />
food crops; •<br />
Reforestation of tow quality natural forests takes place at little cost to the government.<br />
The prograntterminated in the late 1970s in the belief that the hundreds of thousandsi of hectaresof<br />
deforested, derelict land in the Dry Zone required soil working; fertüßatttMiand r other costly inputs that<br />
only the Forest Department could carry out using hired labor. Yet so far the results of tfds arrangementh<br />
a v e n o t b e e n p r o m i s i n g . ....... • •••;;.^^•'•• : :; v | ; "^ v!: *' ; ;f"?•;i?^Ç : ' ? ' t^<br />
The Forestry Master Plan recommends the resumption of the conirjctatrvcreforattatioit scheme. -<br />
With the^pressing need to expand the area under industrial woodspeciësv tneFoie^DepartmènÇcannot<br />
.-..;. -••;-< \V '<br />
ignore a scheme that produced singularly successful results
not be affected seriously during their first 50 years, such<br />
optimistic assessments have not considered continuing<br />
changes in upper watershed land use and catchment<br />
characteristics. Recent observations of high rates of<br />
siltation in the Polgolla reservoir emphasize this<br />
dynamic dimension to the problem. In the case of small<br />
tanks in the Dry Zone, a comparison of 1956 aerial<br />
photographs with those of 1982 brings out clearly the<br />
high rates of siltation resulting from the clearance of<br />
their catchments for agriculture and settlements. Experience<br />
elsewhere — including substantial reductions<br />
in the lives of reservoirs in Pakistan, Colombia, and the<br />
Philippines -- indicates the high economic costs of unanticipated<br />
soil erosion and, correspondingly, the<br />
economic benefits of sound upper watershed management<br />
(Brown, Worldwatch, 1984).<br />
Sri Lanka, like so many other countries, needs far<br />
better information on the economic and environmental<br />
relationship, between soil erosion and land and water<br />
productivity.<br />
Landslide impacts, being so obvious on the<br />
landscape, are most easily quantified. Figure 6.13<br />
provides rough estimates of damage to life and property<br />
caused by landslides in the past. More comprehensive<br />
attempts to measure total costs of landslides — including<br />
refugee relief, land rehabilitation, and lost productivity—<br />
would reinforce the need to prevent or minimize<br />
landslide damage in the future through better land use<br />
practices.<br />
INSTITUTIONAL RESPONSES<br />
Allocation of Authority<br />
Over 40 state institutions have functions or responsibilities<br />
pertaining to land management, allocation,<br />
and development that were identified by the Land<br />
Commission (1985). Analyses of their functions indicate<br />
the diffused jurisdiction and uncoordinated actions<br />
of individual organizations grappling with some<br />
aspect of land degradation.<br />
Certain key institutions have significant shares of<br />
responsibility. The two key ministries dealing with land<br />
management are Agriculture and Lands. Nearly half of<br />
the 40 land-related institutions fall within these two<br />
ministries. The Ministries of Mahaweli Development<br />
Land 131<br />
and Plantation Industries play an important role in<br />
controlling land degradation and the newly created<br />
Ministry of Environment will also have a primary role<br />
in the future.<br />
Despite the large number of institutions dealing<br />
with land management, when a landslide or flood occurs,<br />
no single institution takes primary responsibility<br />
to respond, or at least to coordinate the work of others.<br />
The aftermath of the 1986 and 1988 landslides and<br />
floods illustrates an interesting pattern of institutional<br />
responses. Initial reaction came from the Government<br />
Agents of the Districts and the Social Services Department,<br />
which rushed humanitarian assistance to the victims.<br />
Then many other institutions, including that of<br />
the Prime Ministers office, became involved: the<br />
Central Environmental Authority, the Geological Survey<br />
and the NBRO among them. Committees formed<br />
to investigate the problems and reports were prepared<br />
and presented (CEA, 1986; IFS, 1986).<br />
Long-term Planning<br />
By planning ahead these responses can be<br />
designed for greater efficiency. There are many instances<br />
where the victims of landslides and floods were<br />
accommodated in congested refugee camps for several<br />
months or years without effective action. Medium- or<br />
long-term planning is essential to mitigate adverse impacts.<br />
A single organization or an emergency management<br />
agency can be designated and equipped to handle<br />
all facets of such an exercise.<br />
But further action, designed to anticipate and<br />
prevent or mitigate future events, will also be needed.<br />
As in so many other countries, when the floods recede<br />
and fair weather returns, enthusiasm tends gradually to<br />
fizzle out, and unpleasant events of the past are soon<br />
forgotten. Yet we know from Sri Lanka's history that<br />
natural disaster will strike again.<br />
The rapid, often devastating landslides and floods<br />
should be viewed as symptoms of a wider, more insidious<br />
problem of land degradation. Unfortunately,<br />
despite high levels of public awareness, soil erosion and<br />
siltation receive much less effective institutional attention<br />
than they require, for several reasons.
132<br />
Providing Resources<br />
Institutions entrusted with soil conservation lack<br />
personal and financial resources. The history of the<br />
implementation of the Soil Conservation Act as<br />
recounted by the Land Commission (1985) and the "rise<br />
and fall" of the Soil Conservation Division of the<br />
Department of Agriculture provides an interesting case<br />
of institutional responses to the problems of land<br />
degradation. The Soil Conservation Division, resembling<br />
the same institution in the United States,<br />
remained vibrant until the 1960s, had a precarious existence<br />
in the 1970s and early 1980s, and finally ceased<br />
to exist after 1989. Serious soil conservation efforts are<br />
conducted by a few institutions such as Integrated<br />
Rural Development Projects, NADSA, the Ceylon<br />
Tobacco Company, and some plantation corporations.<br />
An underlying problem has been an inability to<br />
gain voluntary participation of the affected farmers in<br />
soil conservation as a matter of enlightened self-interest.<br />
Subsistence farmers have immediate concerns and<br />
cannot be expected to initiate costly conservation<br />
measures. Government funds and technical assistance<br />
will be essential. Others, however, can be made more<br />
aware of the benefits of mulching, ground cover, and<br />
other measures to maintain productivity and control<br />
costs of fertilizer, pesticides, and labor. Good information,<br />
patience, and adequate budgets are essential.<br />
Inter-agency Coordination<br />
No less essential to soil conservation is coordination<br />
among existing agencies with overlapping mandates.<br />
Limited budgets and available expertise require<br />
effective agency management. One course is to<br />
strengthen Sri Lanka's many existing institutions concerned<br />
with soil conservation and coordinate their<br />
responsibilities. Considering this ineffective, the Land<br />
Commission (1985) recommended an overall<br />
rationalization of their functions and a powerful national-level<br />
authority for watershed management. Its<br />
proposal for a Watershed Management Authority was<br />
based on the premise that major restructuring or even<br />
liquidation of some existing institutions was necessary<br />
as well. Otherwise another institution with overlapping<br />
Land<br />
functions, would be pointless, ineffective, and costly<br />
(Stocking, 1986). Five years after the Land<br />
Commission's recommendations for reforming watershed<br />
management in 1985, nothing substantial has happened.<br />
The same observations cannot be levelled against<br />
the institutions dealing with the problem of coastal<br />
lands. The Coast Conservation Department (CCD),<br />
has made some concerted efforts to plan and implement<br />
a variety of conservation measures. It has recognized<br />
that in many areas, erosion is a seasonal<br />
occurrence and becomes a problem only if the beachfronted<br />
land is highly populated or contains heavy investment<br />
in terms of railways, highways, or buildings. It<br />
has also recognized the fact that the erosion is caused<br />
by natural processes which man can rarely control but<br />
can mitigate by avoiding costly human actions and planning<br />
wise ones. It has therefore gone beyond traditional<br />
shoreline protection programs to active planning for<br />
and management of development within the narrow<br />
coastal zone established under the Coast Conservation<br />
Act of 1981.<br />
Much can be learned from Sri Lanka's coastal<br />
experience in designing workable approaches to inland<br />
problems. One option for control of land degradation<br />
in the inland areas and the hill country is a systematic<br />
development of watershed land use programs based on<br />
critical land use information. Gathering and use of<br />
information should include high hazard areas, erosionprone<br />
slopes and soils, catchment characteristics,<br />
agricultural practices, land lot size and tenure rights,<br />
wood lots and forest characteristics, and suitability for<br />
small hydro or other developments. Public participation<br />
in the gathering and application of this information<br />
will be equally critical, because those with a stake in the<br />
planned outcome are more apt to support it. Similar<br />
plans for larger areas can be developed in conjunction<br />
with watershed plans. Ultimately, national level support<br />
will be necessary for watershed and larger land use<br />
plans. National support can be backed by government<br />
agency use of impact assessment mechanisms to<br />
evaluate the impacts of proposed development projects<br />
on local and regional land use plans.<br />
I<br />
I<br />
I<br />
I<br />
I<br />
I<br />
I<br />
I<br />
I<br />
I<br />
I<br />
I<br />
I<br />
I<br />
I<br />
I<br />
I<br />
I<br />
I<br />
I<br />
I
References<br />
Abeysekera, W.A.T. (1986). Changes in producer incentives<br />
in Sri Lanka's paddy sector 1979-85. Summary of a paper<br />
presented at the Annual Session of the SLAAS, December<br />
1986. ARTI Report S pp.<br />
Bandaranayake, R. Dias (1984). Tea production in Sri Lanka:<br />
future outlook and mechanisms for enhancing sectoral<br />
performance. Central Bank of Ceylon Occasional Papers<br />
No. 7.<br />
Beatty, M.T.; Peterson, G.W.; and Swindale, L.D. (1978).<br />
Planning the uses and management of land. Agronomy<br />
Monograph 21. American Society of Agronomy, Wisconsin.<br />
Beek, KJ. (1978). Land evaluation for agricultural development.<br />
International Institute for Land Reclamation and<br />
Improvement. Publication 23. Wageningen.<br />
Betz, Joachim (1989). Tea policy in Sri Lanka. Marga<br />
Quarterly Journal 10(4). pp. 48-71.<br />
Bibby, J.S. and Mackney, p. (1969). Land use capability classification.<br />
Technical Monograph No. 1. Soil Survey of<br />
England and Wales. Rothamsted Experiment Station,<br />
Harpenden.Christian, CS. and Steward, G.A. (1964).<br />
Methodology of integrated surveys. Proceedings<br />
Toulose Conference. UNESCO, pp. 233-281.<br />
De Alwis, KA. and Dimantha, S. (1981). Land suitability<br />
evaluation and land use study Nuwara Eliya. Integrated<br />
Rural Development Project, Nuwara Eliya.<br />
De Alwis, ICA. (1983). Land use planning in Sri Lanka.<br />
Economic Review, Vol. 9, No. 1. pp. 30-31.<br />
De Silva, K.M. (1981). A History of Sri Lanka. Oxford<br />
University Press, Oxford.<br />
Dimantha S. (1984). Land evaluation for land use planning in<br />
Sri Lanka. Review paper. Proceedings 40th Annual Sessions<br />
Sri Lanka Association for Advancement of Science,<br />
Colombo.<br />
Dimantha, S.; Fernando, M.HJ.P.; and Sikurajapathy, M.<br />
(1984). Rainfed highland farming pilot project, Hambantota<br />
District An assessment Land Use Division,<br />
Colombo.<br />
Dimantha, S. and de Alwis, ICA. (1985). On-Farm Management<br />
for Sri Lanka in some aspects of water resources in<br />
Sri Lanka. Irrigation Department, Colombo.<br />
F.A.O. (1967). Soil survey interpretation and its use. Soils<br />
Bulletin8. F.A.O., Rome.<br />
F.A.O. (1974). Approaches to land classification. Soils Bulletin<br />
22. F.A.O., Rome<br />
F.A.O. (1976). A framework for land evaluation. Soils Bulletin<br />
32. F.A.O., Rome.<br />
F.A.O. (1983). Guidelines: lajid evaluation for rainfed<br />
agriculture. Soils Bulletin 52. F.A.O., Rome.<br />
Und 133<br />
Government of Sri Lanka (1935). Land Development Ordinance.<br />
Government Gazette No. 8172. Government<br />
Press, Colombo.<br />
Government of Sri Lanka (1989). Second Interim Report of the<br />
Land Commission -1985, Sessional Paper No. II - December<br />
1989. Department of Government Printing, Colombo.<br />
Government of Sri Lanka (1990). Report of the Land Commission-1987,<br />
Sessional Paper No. Ill-May 199a Department<br />
of Government Printing, Colombo.<br />
Gunasena, HP.M. (1990). Agriculture and livestock sectors.<br />
Draft submitted for Natural Resources Profile.<br />
Hamilton, I~S.; BonelL M.; Cassels, D.S.; Gilmour, D.A. (1985).<br />
The protective role of tropical forests. A state of knowledge<br />
review. Proceedings Ninth World Forestry Congress.<br />
Mexico City.<br />
Higgins, G.M. and Kassam, A.H. (1981). The F.A.O. agroecological<br />
zones approach to determination of land potential.<br />
Pédologie, Vol. 31. Ghent pp. 147-168.<br />
ILO-ARTEP (1986). Employment and development in the<br />
domestic food crop sector, Sri Lanka. Report of the ILO-<br />
ARTEP Rural Employment Mission to Sri Lanka, September<br />
1984.<br />
Jacob and Alles (1987). Bavappa and Jacob (1981) McConnel<br />
and Dharmapala (1973).<br />
Joshua, W.D. (1977). Soil erosive power of rainfall in the<br />
different climatic zones of Sri Lanka. Proceedings Paris<br />
Symposium. A.LS.H. Publication No. 122. UNESCO.<br />
Klingebiel, AA and Montgomery, P.H. (1966). Land capability<br />
classification, agricultural handbook 210. U.S. Government<br />
Printing Office, Washington D.C<br />
Krishnarajah, P. (1985). Soil erosion control measures for tea<br />
land in Sri Lanka. Sri Lanka Journal of Tea Science 54(2).<br />
pp. 91-100.<br />
Land and Water Use Division (1976). Agro-ecological regions<br />
map of Sri Lanka. Dept of Agriculture, Peradeniya.<br />
Moorman, F.R. and Panabokke, CR. (1961). Soils of Ceylon.<br />
Tropical Agriculturist 117. pp. 2-65.<br />
NARESA/Dept of Agriculture. Abstracts of papers presented<br />
at the Conference on the Use of Organic Matter in Agriculture<br />
in Sri Lanka, June 199a<br />
O'Loughlin, CL. (1974). The effect of timber removal on the<br />
stability of forest soils. Hydrology 13. pp. 121-134.<br />
O'Loughlin, CL. and Pearce, AJ. (1976). Influence of<br />
Cenozoic geology on mass movement and sediment yield<br />
response to forest removal. North Westland, New Zealand.<br />
Bulletin of the International Association of Engineering<br />
Geology 14. pp. 41-48.<br />
Perera, aMAO. et al. (1989). Sri Lanka water buffalo.<br />
Science Education Series No. 31. NARESA.
134<br />
Perera, M.B.A. (1989). Planned land use for the tea country.<br />
Sri Lanka Journal of Tea Science 58(2). pp. 92-103.<br />
Sandanam, S. (1981). Let's halt the downslide of our primary<br />
capital. Tea Bulletin 1(1). pp. 23-29.<br />
Senadhira, D^ Dhanapala, M.P.; and Sandanayaka, D.A.<br />
(1980). Progress of rice varietal improvement in the dry<br />
and intermediate zones of Sri Lanka. Proceedings of the<br />
Rice Symposium 1980. Dept of Agriculture, Peradeniya.<br />
Senanayake, F.R. (1987). Analog forestry as a conservation<br />
tooL Tigerpaper, VoL XIV, No. 2. pp. 25-29.<br />
Land<br />
U.S. Department of Interior, Bureau of Reclamation (1953).<br />
Irrigated land use. Land classification, VoL V, Part 3.<br />
Colorado.<br />
U.S. Department of Interior, Bureau of Reclamation (1982).<br />
Land classification techniques and standards. Series 510.<br />
Washington D.C<br />
VS Department of Agriculture, Forest Service (1977). Declining<br />
root strength in Douglas Fir after felling as a factor in<br />
slope stability, by RR. Burroughs and BJt Thomas. Research<br />
Paper INT-190, Intermountain Forest and Range<br />
Experiment Station. Ogden.
I<br />
I<br />
I<br />
II<br />
I<br />
I<br />
I [<br />
!<br />
I<br />
i<br />
i<br />
i r<br />
I<br />
I<br />
Land 135
136<br />
Land<br />
Sri Lanka's central hills that rise over 2,000 meters intercept moisture-laden monsoon winds and supply water<br />
to her major rivers and reservoirs.
7 Water Resources<br />
Historians studying the rise and fall of Sri Lanka's<br />
ancient hydraulic civilization have marvelled at its engineering<br />
technology and water resource management<br />
systems. Arnold Toynbee noted that ancient Sri Lanka<br />
"once achieved the tour de force of compelling monsoon<br />
smitten highlands to give water and life and wealth to<br />
the plains that nature had condemned to lie parched<br />
and desolate."<br />
Sri Lanka has relied on water resources during the<br />
last half century to produce staple food and energy,<br />
capped by the Mahaweli Development Project — the<br />
largest development project in Sri Lanka's history at<br />
38.26 billion rupees by the end of 1986. The mediumterm<br />
investment plan (1986-1990) envisaged capital<br />
outlays of 27,626 million rupees (or about 20 percent of<br />
the total) on irrigation, power and water supply, equalling<br />
nearly 30 percent of the Government budgetary<br />
allocations for ongoing projects.<br />
Sri Lanka suffers almost annually from droughts<br />
and floods. These and occasional cyclones and<br />
landslides are problems directly related to water<br />
resources. Total costs of these phenomena - economic<br />
and environmental — are high, but they can only be<br />
roughly extrapolated from disaster assistance expendi-<br />
tures. (See Figure 7.1) In recent years the contamina-<br />
tion of Sri Lanka's waters has added new and still rising<br />
economic and environmental costs, which have not<br />
even roughly been calculated.<br />
Part I of this chapter summarizes available infor-<br />
mation on the nature and extent of Sri Lanka's water<br />
resources, their present conditions, use, and trends,<br />
and current development policies and institutional<br />
responses. Part II describes the problems of water<br />
pollution in Sri Lanka, and what we have learned and<br />
need to know about its present impact and trends.<br />
Average Annual Expenditure oh Climatic<br />
Disaster Assistance, Sri Lanka, 1959 - 84<br />
Period<br />
1950-59<br />
1960-69<br />
1970-79<br />
1980-85<br />
Droughts<br />
(Rs. million)<br />
01.91<br />
01.09<br />
00.03<br />
88.60<br />
Source : Department of Social Services<br />
Figure 7.1<br />
PARTI<br />
Roods<br />
(Rs.million)<br />
0.73<br />
0.38<br />
0.04<br />
6.35<br />
WATER <strong>RESOURCES</strong><br />
AND USE<br />
GEOGRAPHICAL AND<br />
GEOLOGICAL BACKGROUND<br />
137<br />
Sri Lanka's location between 6 and 10 degrees<br />
North of the Equator, and close to the Indian subcontinent,<br />
gives it a predominantly monsoonal and tropical<br />
climate. As an island in the northern half of the Indian<br />
Ocean, Sri Lanka is exposed to moisture-laden winds<br />
from the southwest and the northeast.<br />
Sri Lanka's highland massif in the south central<br />
part of the island, standing across the passage of monsoonal<br />
winds is undoubtedly the overriding geographical<br />
determinant of water resources. It creates high<br />
rainfall in the southwest and relatively dry regions in the<br />
east and north that cover over two-thirds of the country.<br />
The central hills that rise above 2,000 meters intercept<br />
the moisture-laden monsoonal winds, particularly on
138<br />
Golle<br />
Water Resources<br />
Mean Annual Rainfall<br />
Figure 7.2<br />
———— Climotic Zon« Boundary<br />
-I9OO- isohyttsinmm.<br />
Mean Annual Discharge<br />
in millions of M 3<br />
Source: National Atlas of Sri Lanka<br />
Hombantoia<br />
Bottiealoo<br />
O 20 4P<br />
km
Water Resources 139<br />
River Basins of Sri Lanka<br />
Figure 7.3<br />
LIQUID<br />
RIVER<br />
BASIN BOUNDARY<br />
BASIN NUMBER<br />
0 20 40<br />
km
140<br />
Basin No<br />
1.<br />
2.<br />
3.<br />
4.<br />
5.<br />
6.<br />
7.<br />
8.<br />
9.<br />
10.<br />
11.<br />
12.<br />
13.<br />
14.<br />
15.<br />
16.<br />
17.<br />
18.<br />
19.<br />
20.<br />
21.<br />
22.<br />
23.<br />
24.<br />
25.<br />
26.<br />
27.<br />
28.<br />
29.<br />
30.<br />
31.<br />
32.<br />
33.<br />
34.<br />
35.<br />
36.<br />
37.<br />
38.<br />
39.<br />
40.<br />
41.<br />
43.<br />
44.<br />
45.<br />
46.<br />
47.<br />
48.<br />
49.<br />
50.<br />
51.<br />
52.<br />
Name of Basin<br />
Kelani Ganga<br />
Bolgoda Lake<br />
Kaluganga<br />
Bentota Ganga<br />
Madu Ganga<br />
Madam pe Lake<br />
Telwatte Ganga<br />
RatgamaLake<br />
Gin Ganga<br />
KoggalaLake<br />
Polwatta Ganga<br />
Nilwala Ganga<br />
Sinimodara Oya<br />
WramaOya<br />
Rekawa Oya<br />
Uruhokke Oya<br />
Kachigala Ara<br />
Walawe Ganga<br />
Karagan Oya<br />
MalalaOya<br />
Embilikala Oya<br />
Wrindi Oya<br />
BambaweAra<br />
Mahasilawa Oya<br />
ButawaOya<br />
Menik Ganga<br />
Katupila Aru<br />
Kuranda Ara<br />
Namadagas Ara<br />
Karambe Ara<br />
Kumbukkan Oya<br />
Bagura Oya<br />
Girikula Oya<br />
Helawa Ara<br />
WilaAra<br />
HedaOya<br />
KarandaOya<br />
Simena Ara<br />
Tandiadi Aru<br />
Kangikadichi Ara<br />
RufusKulam<br />
PannelOya<br />
Am bal am Oya<br />
Gal Oya<br />
AndellaOya<br />
Thumpankeni Tank<br />
Namakada Aru<br />
Mandipattu Aru<br />
Catchment<br />
Area Sq. Km.<br />
2278<br />
374<br />
2688<br />
6622<br />
59<br />
90<br />
51<br />
10<br />
922<br />
64<br />
233<br />
960<br />
38<br />
223<br />
755<br />
348<br />
220<br />
2442<br />
58<br />
399<br />
59<br />
1165<br />
79<br />
13<br />
38<br />
1272<br />
86<br />
131<br />
46<br />
46<br />
1218<br />
92<br />
15<br />
51<br />
484<br />
604<br />
422<br />
51<br />
22<br />
56<br />
35<br />
184<br />
115<br />
1792<br />
522<br />
9<br />
12<br />
100<br />
Pattanthe Dephue Aru 100<br />
Magalawatavan Aru<br />
VettAru<br />
Mundeni Aru<br />
346<br />
26<br />
1280<br />
Water Resources<br />
River Basins<br />
Basin No.<br />
53.<br />
54.<br />
55.<br />
56.<br />
57.<br />
58.<br />
59.<br />
60.<br />
61.<br />
62.<br />
63.<br />
64.<br />
65.<br />
66.<br />
67.<br />
68.<br />
69.<br />
70.<br />
71.<br />
72.<br />
73.<br />
74.<br />
75.<br />
76.<br />
77.<br />
78.<br />
79.<br />
80.<br />
81.<br />
82.<br />
83.<br />
84.<br />
85.<br />
86.<br />
87.<br />
88.<br />
89.<br />
90.<br />
91.<br />
92.<br />
93.<br />
94.<br />
95.<br />
96.<br />
97.<br />
98.<br />
99.<br />
100.<br />
101.<br />
102.<br />
Source : Hydrology Division, Irrigation Department.Colombo. 103,<br />
Figure 7.3<br />
Name of Basin<br />
Miyangolla 8a<br />
Madura Oya<br />
Pulliyanpotha Aru<br />
Wrimechi Odai<br />
BodigodaAru<br />
Mandan Aru<br />
Makarachchi Aru<br />
Mahaweli Ganga<br />
Catchment<br />
Area Sq. Km<br />
225<br />
1541<br />
52<br />
77<br />
164<br />
13<br />
37<br />
10327<br />
Kantalai Basin Per Ara 445<br />
PannaOya<br />
Palam potta Aru<br />
Pankulam Ara<br />
69<br />
143<br />
382<br />
Kanchikamban Aru 205<br />
PalakuttiAru<br />
Van Oya<br />
Mee Oya<br />
Ma Oya<br />
Churian Aru<br />
Chavar Aru<br />
PalladiAra<br />
Nay Ara<br />
Kodalikallu Am<br />
Per Ara<br />
Pali Aru<br />
Muruthapilly Aru<br />
Thoravil Aru<br />
Piramenthal Aru<br />
Nethali Aru<br />
Kanakarayan Aru<br />
Kalawalappu Aru<br />
Akkarayan Aru<br />
Mendekal Aru<br />
Pallarayan Kadu<br />
Pali Ara<br />
Chappi Aru<br />
Parangi Ara<br />
Nay Ara<br />
MalvatuOya<br />
Kal Are<br />
Moderagam Ara<br />
KalaOya<br />
Moongil Ara<br />
Mi Oya<br />
Madurankuli Ara<br />
Kalagamuwa Oya<br />
Pantampola Oya<br />
DeduruOya<br />
KarambalaOya<br />
RatmalOya<br />
MahaOya<br />
Attanagalu Oya<br />
20<br />
1520<br />
90<br />
, 1024<br />
74<br />
31<br />
61<br />
187<br />
74<br />
374<br />
84<br />
41<br />
90<br />
82<br />
120<br />
986<br />
56<br />
192<br />
297<br />
159<br />
451<br />
66<br />
832<br />
560<br />
3246<br />
210<br />
932<br />
2772<br />
44<br />
1516<br />
62<br />
151<br />
215<br />
2616<br />
589<br />
215<br />
1510<br />
727
I<br />
I<br />
I<br />
I<br />
l' ;<br />
I<br />
P<br />
r<br />
I<br />
I<br />
I<br />
i<br />
I<br />
I<br />
I<br />
I<br />
f<br />
I<br />
r<br />
the steeper western flanks, causing rainfall patterns as<br />
shown in Figure 12.<br />
The radial drainage pattern that carries surface<br />
water down from the high watersheds includes 103<br />
distinct natural river basins that cover over 90 percent<br />
of the island (Figure 73); the remaining 94 small coastal<br />
basins contribute little to water resources (Arumugam,<br />
1969). River basins originating in the wetter parts of<br />
the hill country are perennial, while many of those in<br />
the Dry Zone are only seasonal. Only a few river basins,<br />
such as the Mahaweli Ganga that drains 16 percent of<br />
Sri Lanka, carry water from the Wet to the Dry Zone.<br />
Geological formations that largely determine Sri<br />
Lanka's aquifer characteristics can be grouped into<br />
four categories:<br />
• Ancient crystalline hard rocks spread over 90 percent<br />
of the land. These Pre-Cambrian rocks have<br />
poor primary porosities and their groundwater is<br />
often found in their joints, fissures and cracks (Basnayake,<br />
1981).<br />
• Sedimentary formations, that characterize most<br />
remaining areas, which include Miocene limestone<br />
areas of the north and northwest;<br />
• Surface alluvium, consisting of clays, sands and<br />
gravels in the riverine and coastal areas; and<br />
• Weathered over-burden in hard-rock areas, which<br />
includes products of in situ weathering, such as soil<br />
and gravelly material that form localized aquifers.<br />
Rates of ground water recharge from rainfall vary<br />
from one geological formation to another. In general it<br />
ranges from 10 percent to 30 percent in many areas of<br />
the Dry Zone (de Mel & Sumanasekara, 1973; Dharmasiri<br />
et al., 1985). At least 10 percent of the irrigation<br />
flow which seeps down may be available for recycling<br />
(Fernando, 1973,1974; Madduma Bandara, 1980).<br />
PRECIPITATION AND WATER<br />
AVAILABILITY<br />
Rainfall supplies nearly all surface and ground<br />
water, supplemented by mist, fog and dew in certain<br />
areas. At higher elevations cloud-water also contributes<br />
to the surface water flow.<br />
Water Resources 141<br />
The mean annual rainfall of Sri Lanka is around<br />
2,000 mm (Anilananthan, 1985) which, distributed over<br />
the surface area of 65,610 square kilometers, gives an<br />
average volume of 131,230 million cubic meters (m 3 ) of<br />
fresh water. What does not soon evaporate into the air<br />
runs off the surface or percolates into the soil to reach<br />
the sea as riverflow. Average annual riverflow, at 31<br />
percent of the rainfall, equals 40,680 million m 3 (Bocks,<br />
1959). The balance, 90,550 million m 3 is used and<br />
transpired by crops and natural vegetation or<br />
evaporates from the soil directly to the air.<br />
This simple approximation introduces the considerable<br />
variations in time and space that affect Sri<br />
Lanka's surface water balance.<br />
Average Rainfall<br />
Average annual rainfall varies spatially from 1,000<br />
mm to over 5,500 mm. Maximum rainfall occurs on<br />
windward slopes of the central highlands. A large area<br />
of high rainfall on the southwestern flanks (Figure 7.2)<br />
is influenced by the strong southwest monsoon (May-<br />
September) with a small area influenced by the northeast<br />
monsoon (November-March). These major river<br />
supplies are supplemented by the more widespread<br />
Inter-Monsoonal rains, (April-May and September-<br />
October). Tropical depressions and cyclones of high<br />
inter-annual variability also influence the rainfall<br />
during October-November.<br />
Mean annual rainfall declines rapidly toward the<br />
northwest and southeast, yielding minimal average<br />
rainfall along these coasts. The same complex topography<br />
of the central hill country that attracts heavy<br />
rainfall on windward slopes produces "rain shadows" on<br />
the leeward flanks, such as the Dumbara valley and the<br />
Uva basin.<br />
Wet and Dry Zones<br />
Rainfall divides Sri Lanka into Wet and Dry Zones<br />
and an Intermediate Zone between the two. (Figure<br />
7.2). The Wet Zone of the southwest and central hill<br />
country averages 2,500 mm of rainfall, mostly<br />
throughout the year, while the remaining two-thirds of<br />
the country in the north, east and southeast stays comparatively<br />
dry, averaging 1,500 mm, mostly the 'Maha'
142<br />
season (October-January). It remains dry during the<br />
five months of the 'Yala' season (May-September).<br />
The southwestern flanks of the central hill country<br />
form the critical upper catchments of Sri Lanka's<br />
largest rivers. Over 65 percent of Wet Zone catchment<br />
rainfall is discharged into rivers, with Kalu Ganga showing<br />
maximum discharge of 77 percent. Rivers rising in<br />
the drier eastern half of the hill country have<br />
runoff/rainfall ratios of 20-40 percent<br />
Evapo-transpiration<br />
Data on evapotranspiration are limited, being<br />
more difficult to determine than rainfall and riverflow.<br />
Best estimates in the Wet Zone indicate annual<br />
evapotranspiration of approximately 1,500 mm, with an<br />
upper limit at about 1,700 mm (Kayane, 1982). In the<br />
highest montane areas of central Sri Lanka, with<br />
greater cloudiness and lower solar energy, it declines to<br />
1,000 mm.<br />
In the Dry Zone, evapotranspiration attains similar<br />
rates to the Wet Zone during the Malta (October-<br />
January) season and lower rates during the dry Yala<br />
(May-September) season. But rates vary more than in<br />
the Wet Zone, the annual value being 1,000-1,400 mm.<br />
Evaporation values from Dry Zone tanks can reach<br />
2,100 mm/yr., higher even than maximum Wet Zone<br />
values because the comparatively small water bodies<br />
are set in a dry climate.<br />
Inter-annual variability<br />
Elements of Sri Lanka's surface water balance are<br />
subject to substantial annual variability so that consideration<br />
of averages can be misleading. Variations<br />
are about 10 percent annually in the Wet Zone, 15<br />
percent in the Dry Zone, and up to 20 percent on the<br />
east coast. Maha season rainfall is far more variable<br />
than Yala rainfall, due to the weaker Northeast Monsoon<br />
and irregularity of tropical depressions and<br />
cyclones during the Maha season. Maximum rainfall<br />
variability along the east coast results from landfalls of<br />
occasional tropical cyclones.Rainfall variations affect<br />
runoff and evapotranspiration, as illustrated by rainfall<br />
and discharge records of a Dry Zone basin between<br />
1915-1961 (see Figure 7.4). Discharge is nearly absent<br />
in the dry years of 1934, 1946, 195L 1955 and 1958.<br />
Water Resources<br />
Inter-annual variability of the catchment is high and so<br />
the discharge varies even more.<br />
Extremes: Floods and droughts<br />
Floods and droughts constitute the extreme<br />
weather forms that disrupt Sri Lanka's economic and<br />
social life. During the last century two drought years,<br />
1950 and 1974, and three flood years, 1891, 1957 and<br />
1963, affected 50 percent or more of the country (see<br />
Figure IS).<br />
Serious floods recur particularly in the Kelani,<br />
Kalu, and Mahaweli river basins, and occasional floods<br />
occur in many other major rivers. When intense rainfall<br />
from cyclones combines with normal monsoons, floods<br />
can devastate lowlands even in the Dry Zone, as occurred<br />
in 1957 in the Yan Oya basin. Data on major<br />
floods are provided in Figure 7.6.<br />
Rainfall Probability<br />
Rainfall variations are themselves unpredictable so<br />
agricultural planning has relied on simple probability<br />
levels. Annual surface water regimes of 25 agroecological<br />
regions of Sri Lanka, defined by a 75 percent<br />
probability of monthly rainfall, give expected surface<br />
water levels in three years out of four. This analysis has<br />
been particularly useful for planning paddy production.<br />
Surface Water<br />
Water that remains from rainfall after<br />
evapotranspiration and infiltration losses may generally<br />
be considered available surface water. Amounts are<br />
measured in terms of water discharged by the rivers, in<br />
cubic meters per year (m 3 /yr) or as units of water depth<br />
distributed over the land surface as hectare meters<br />
(HM) or acre feet (AF). Information on surface water<br />
available for the whole island is given in Figure 7.7.<br />
Although surface water estimates vary significantly<br />
- 4.04 million HM annual runoff (IBRD Mission,<br />
1952), 432 million HM (Walker, 1962), and 5.13 million<br />
HM (Bocks, 1959; Arumugam, 1969; Ranatunge, 1985)<br />
- Sri Lanka's total annual runoff appears to be roughly<br />
5.0 million HM. Much of this now serves irrigation and<br />
hydropower projects, and less than 33 million HM<br />
escapes to the sea. Over 60 percent of the water that<br />
I<br />
I<br />
I<br />
I<br />
I<br />
I<br />
I<br />
I<br />
I<br />
I<br />
I<br />
I<br />
I<br />
I<br />
I<br />
I<br />
I<br />
I 1<br />
I<br />
I<br />
I
Water Resources 143<br />
Secular Changes of Annual Rainfall and Annual Discharge for<br />
Kalawewa Catchment<br />
Figure 7.4<br />
2300<br />
2000<br />
Climatic Extremes, Sri Lanka, 1971-1980<br />
Lo»««l 0«*» o« twwol INtrftll<br />
amp»'<br />
— -**o o<br />
IK*<br />
of o<br />
Figure 7.5
144<br />
River<br />
Kalu Ganga<br />
Kelani Ganga<br />
Kirindi Oya<br />
MahaOya<br />
Mahawell Ganga<br />
Malvatu Oya<br />
Menik Ganga<br />
Nilwala Ganga<br />
Kuda Oya<br />
Yan Oya<br />
Source: Navaratne, 1985<br />
Mean Annual Rainfall (mm)<br />
Mean Annual Runoff<br />
(Hectare Meters)<br />
Runoff rainfall ratio (%)<br />
Escape to the sea<br />
(Hectare Meters)<br />
Water Resources<br />
Maximum Recorded<br />
Station<br />
Putupaula<br />
Glencourse<br />
Lunugamvehera<br />
Badalgama<br />
Randenigala<br />
Kappachchi<br />
Kataragama<br />
Bopagoda<br />
Kuda Oya<br />
Escape as a % total runoff (%) 78.83 %<br />
Source : Ranatunga, 1985<br />
•<br />
Pangurugaswewa<br />
Surface Water<br />
Wet Zone<br />
2424<br />
2.58x10 6<br />
65.1%<br />
2.04x10 8<br />
Figure 7.6<br />
Floods in Sri Lanka<br />
Water Year<br />
1946/47<br />
1966/67<br />
1966/67<br />
1970/71<br />
1955/56<br />
1948/49<br />
1957/58<br />
1943/44<br />
1978/79<br />
1957/58<br />
Resources of Sri Lanka<br />
Figure 7.7<br />
1450<br />
Dry Zone<br />
2.55x10 6<br />
35.8%<br />
1.30X10 6<br />
51.11%<br />
Peak Discharge<br />
(CU.m)<br />
2547<br />
3794<br />
1354<br />
1982<br />
1642<br />
2733<br />
1365<br />
1692<br />
1852<br />
6031<br />
Island Total<br />
1937<br />
5.13X10 6<br />
40.5%<br />
3.33x10 6<br />
64.91% .<br />
I<br />
I<br />
I<br />
I<br />
I<br />
I<br />
I<br />
I<br />
I<br />
I<br />
I<br />
I<br />
I<br />
I<br />
I<br />
I<br />
I<br />
I<br />
I<br />
I<br />
I
I<br />
I<br />
I<br />
I<br />
I<br />
I<br />
I<br />
I<br />
Water Resources<br />
Surface Water Potential<br />
Figure 7.8<br />
WATER DEPTH (m)<br />
km
146<br />
does escape comes from the Wet Zone, which often<br />
creates flooding and waterlogging in lowlands. In the<br />
Dry Zone, however, over 50 percent of total runoff was<br />
used by 1972. Recent river basin developments, particularly<br />
the Accelerated Mahaweli Programme, have<br />
substantially reduced Dry Zone runoff.<br />
Efforts to quantify Sri Lanka's surface water potential<br />
have been based on available rainfall, streamflow,<br />
and reservoir replenishment data. As summarized on<br />
a district basis, Figure 7.8 clearly shows spatial variation<br />
of surface water potential over the Island; while<br />
Kalutara, Galle, Ratnapura, Kegalle and Colombo<br />
record over 2.4 meters in water depth, most of Dry<br />
Zone districts have values below 0.03 meters.<br />
Ground Water<br />
Although information on available ground water in<br />
different aquifer formations remains incomplete, Sri<br />
Lanka's largest, most studied aquifers lie in the north<br />
and northwest. Research since 1966 indicates that the<br />
Miocene limestones of the northwest extend over 200<br />
kilometers in the northwestern and northern coastal<br />
areas, with aquifers becoming increasingly thick as they<br />
reach the coast. They are karstic with a high degree of<br />
secondary porosity. In the Vanathavillu basin, which<br />
spreads over some 40 square kilometers, the confined<br />
aquifer creates artesian conditions. Estimates of<br />
ground water resources available in Vanathavillu basin<br />
vary between 5 -20 million cubic meters per year, with<br />
the higher figure indicating the ultimate potential<br />
(Henreck and Sirimanne, 1968; Wijcsinghe, 1975;<br />
Foster et al., 1976).<br />
North of Vanathavillu, in the Murunkan basin located<br />
between the stream courses of Malvatu Oya<br />
(Aruvi Aru) and Nay Aru, deep tube well technology<br />
has developed over the last fifteen years to supply water<br />
for irrigation and domestic use under programs of<br />
IRDPs and Water Supply Authorities. A relatively high<br />
yielding semi-confined aquifer system has been found<br />
from 15-25 meters below ground. The next major<br />
aquifer system, located in the Mulankavil Basin north<br />
of Mannar, lies between the Pali Aru and Pallavarayankaddu<br />
Aru, covering 180 square kilometers.<br />
Average yields from tube wells there range from 15-35<br />
liters per second (Foster et al., 1976).<br />
Water Resources<br />
Within the metamorphic complex covering over 90<br />
percent of the Island, regional aquifers underlie 1-2<br />
percent of the land ~ that underlain by quartzites or<br />
crystalline limestone bands within the metamorphic<br />
suite. In the extensive regions devoid of large aquifers,<br />
ground water resources depend on local long-term<br />
recharge from rainfall infiltration and irrigation<br />
seepage. Unfortunately, we know too little about<br />
groundwater in this large area. "[A]nyone attempting<br />
to formulate a national policy on groundwater development<br />
for the metamorphic regions of Sri Lanka is confronted<br />
with enormous deficiencies in hydrogeologic<br />
data" (Foster et al., 1977).<br />
Estimates of well yields outside the north and<br />
northwest illustrate the modest ground water potential.<br />
In the Vavuniya District they range from 0.1 - 0.6 liters<br />
per second (I/sec). In the Colombo district at two sites<br />
laterites have yielded a total of 3.5 1/sec and 1.21/sec;<br />
tube wells drilled up to 25 meters deep in Trincomalee<br />
and Hambantota districts recorded yields up to 0.4<br />
1/sec; wells sunk into quartzite formations as at Melsiripura<br />
(Kurunegala District) and Kebitigollewa<br />
(Anuradhapura District) have recorded yields of 0.5<br />
1/sec for less than one meter of drawdown. Transverse<br />
valleys that dissect quartzite formations often create<br />
significant springs, as in the Matale District.<br />
Ground water quality from limestone and<br />
metamorphic areas have been affected by chemical<br />
conditions. Figure 7.9 indicates the quality of water in<br />
tube wells constructed up to 1985. In many areas tube<br />
wells yield water of reasonable quality, occasionally<br />
affected by excessive salinity, hardness or fluoride content<br />
(Dissanayake et al., 1986).<br />
WATER USES AND<br />
REQUIREMENTS<br />
During Sri Lanka's hydraulic civilization in the first<br />
millenium, major population centers in the Dry Zone<br />
left the hill country watersheds largely undisturbed.<br />
Under colonial rule this pattern drastically changed;<br />
coastal waters became heavily used for navigation and<br />
other purposes and hill country forests were progressively<br />
denuded for plantation agriculture.<br />
Development of irrigated agriculture in the Dry<br />
Zone gradually became the dominant state<br />
I<br />
I<br />
I<br />
I<br />
I<br />
I<br />
I<br />
I<br />
I<br />
I<br />
I<br />
I<br />
I<br />
I<br />
I<br />
I<br />
I<br />
I<br />
I<br />
I<br />
I
I<br />
I I<br />
I<br />
I i<br />
I<br />
I :Ij<br />
I<br />
I<br />
I<br />
I<br />
I<br />
1<br />
development policy in the latter period of British rule.<br />
The Irrigation Department, established at the turn of<br />
the century, assumed control over most water resource<br />
programs. Renovation of derelict ancient irrigation<br />
works and new land settlement around them became<br />
major concerns in the 1930s and continued virtually<br />
unchanged after National Independence. Large<br />
schemes such as Gal Oya and Uda Walawe culminated<br />
in the Accelerated Mahaweli Development Project.<br />
Nearly all major ancient reservoirs have now been<br />
renovated.<br />
To facilitate macro-scale planning the island has<br />
been divided into four main regions (GOSL, 1977): the<br />
Mahaweli Project region;- southeast Dry Zone region;<br />
western Wet Zone region; and northwest Dry Zone<br />
region. Today, Sri Lanka's only area with a water<br />
surplus is the Western Wet Zone (see Figure 7.10). Her<br />
most acute water deficit areas occur in the<br />
northwestern and southeastern Dry Zone. The Dry<br />
Zone region of the Mahaweli basin, however, with an<br />
estimated deficit of 199 million m 3 , may nevertheless<br />
become self-sufficient under improved water conservation<br />
and management.<br />
Water Resources 147<br />
Tube Wells Constructed Up to 1985<br />
Figure 7.9<br />
WTER OtMLITT<br />
gic<br />
The Mahaweli basin discharges about 7,650 million<br />
m annually which represents roughly one-fifth of all<br />
the island's river discharge from its watershed of 10,450<br />
square kilometers. Development of these water<br />
resources occurred under the Mahaweli Master Flan<br />
(UNDP/FAO, 1967) and the Accelerated Mahaweli<br />
Development Programme, which commenced in 1978.<br />
All major Mahaweli projects except in the<br />
Moragahakanda are completed or nearly so.<br />
With completion of the Mahaweli project few<br />
favorable sites remain for major irrigation development.<br />
The proposed Kaluganga Project may be able to<br />
convey water to at least some parts of the southeastern<br />
Dry Zone, but other river basin projects are possible<br />
only in the Kalu, Kelani and Walawe basins. In the<br />
Walawe Basin the only new project to be completed is<br />
the Samanalawewa reservoir and hydroelectric plant.<br />
In the future Sri Lanka's water resource development<br />
must increasingly focus on augmentation,<br />
rehabilitation and improved water management. The<br />
village tank rehabilitation program has shown positive<br />
results, particularly where it has increased cropping<br />
intensities (Herath et al., 1988). Any future irrigation
148<br />
expansion will depend largely on small-scale schemes<br />
and exploitation of ground water.<br />
Most major hydropower sites have also been<br />
developed, as discussed in Chapter S. Small-scale<br />
projects may become economically attractive, but their<br />
long-term success will depend on sound watershed<br />
management.<br />
Ground water can provide supplementary irrigation<br />
in many areas of the Dry Zone except the northern<br />
districts such as Jaffna and Vavuniya (Madduma Bandara,<br />
1980). Ground water use has exceeded safe limits<br />
in most areas of Jaffna where sustainable irrigation<br />
depends on maintaining a delicate balance between<br />
recharge and extraction (Arumugam and Balendran,<br />
1969). Heavy use of agro-chemicals threatens the<br />
purity and utility of the resource.<br />
The quantities of water required for industrial and<br />
domestic uses are not so significant as lor in içaiion and<br />
hydropower generation. Total requirements stood at<br />
665 million liters per day in 1973 and have been<br />
projected to increase to 2,820 liters per day in A.D.<br />
2000. Quality and investment requirements of water<br />
supply projects for industrial and domestic water use<br />
will assume greater significance as demand increases.<br />
WATER <strong>RESOURCES</strong><br />
CONDITIONS AND TRENDS<br />
Conditions and trends of water resources are<br />
determined by natural factors and the impacts of their<br />
use for human benefit.<br />
Local Rainfall Decreases<br />
Studies of island-wide rainfall trends have been<br />
attempted for several decades without conclusive<br />
results (Thambiapillay, 1958), but significant local<br />
trends have been observed in the annual rainfall or<br />
rainfall during agriculturally critical periods. For example,<br />
Nuwara Eliya has experienced significant<br />
decline in annual rainfall during the last 100 years.<br />
(Hamamori, 1968; Madduma Bandara and Kuruppuarachchi,<br />
1988) (see Figure 7.11). The decline coincided<br />
with deforestation of the hill country for tea<br />
plantations, but this fact alone cannot explain a rainfall<br />
decrease of nearly 20 percent in a hundred years. Some<br />
Water Resources<br />
still unknown meteorological change may be responsible<br />
for this rainfall decline, which also appears to have<br />
affected rainfall stations such as Abergeldie in the<br />
upper Mahaweli Basin.<br />
Data do not support the belief of many Dry Zone<br />
farmers that rainfall has been declining over the past<br />
generation or more, adversely affecting agricultural<br />
production; analyses of long period rainfall at Anuradhapura<br />
do not indicate significant progressive rainfall<br />
decline in recent decades. On the other hand more<br />
drought years have occurred over the last 30 years than<br />
during the first half of this century. As Figure 7.12<br />
indicates, between 1873-1974, 7 out of 11 years falling<br />
within the driest décile came between 1950-1974.<br />
Similarly 4 out of the 11 driest Januaries came in the<br />
eight-year period of 1973-1980 (Gooneratne and Madduma<br />
Bandara, 1990).<br />
Increased Runoff<br />
Available streamflow data cover shorter periods<br />
than those for rainfall and cannot provide meaningful<br />
time series analyses. Nevertheless, the few studies that<br />
exist (Abernathy, 1976) indicate a steady increase in the<br />
runoff/ rainfall ratios as expected from deforestation<br />
(Figure 7.13). For example, trends in Kirindi Oya basin<br />
streamflow (Madduma Bandara, 1977) revealed this<br />
increasing trend clearly (see Figure 7.14). Similarly<br />
streamflow data in the upper Mahaweli basin above<br />
Peradeniya (Madduma Bandara and Kuruppuarachchi,<br />
1988) show an increase in runoff/rainfall ratios ~<br />
that is, an increase in discharge during the wet months<br />
and a decrease during dry months (see Figures 7.15 and<br />
7.16). Also, average discharge of the Mahaweli Ganga<br />
over the long period (1944-1974) is 10 percent higher<br />
than the estimates of the UNDP/FAO Master Plan<br />
based on the twenty years 1944-1964 (Madduma Bandara,<br />
1989). Such changes in river discharge trends<br />
stem largely from changes in catchment area land use.<br />
Although data available on sediment discharges in the<br />
rivers of Sri Lanka do not suffice for time-series<br />
analysis, in theory, increasing runoff/rainfall ratios indicate<br />
increased sediment transport from upstream<br />
and eventual increases in reservoir siltation.<br />
High siltation rates are evident in many Dry Zone<br />
tanks (Gangodawila, 1988) as well as in such upcountry<br />
I<br />
I<br />
I<br />
I<br />
I<br />
I<br />
I<br />
I<br />
I<br />
I<br />
I<br />
I<br />
I<br />
I<br />
I<br />
I<br />
I<br />
I<br />
I<br />
I<br />
I
I<br />
I<br />
I<br />
I<br />
I<br />
I<br />
I<br />
II<br />
I<br />
Supply / Demand<br />
Total average annual<br />
yield<br />
Surface Water<br />
Mahawell<br />
Project<br />
Region<br />
7375<br />
Current Requirementsi<br />
1049<br />
Future demand for<br />
Agriculture by year 2000 6134<br />
Surplus/Deficit 199<br />
Water Resources 149<br />
Requirements<br />
South-<br />
East<br />
Dry Zone<br />
2783<br />
2165<br />
1534<br />
Future demand is assessed on the basis of an average duty of 0.480 m/ha (10 Ac. ft/Ac)<br />
Source: GOSL, 1977<br />
2300<br />
- 2400<br />
E<br />
J2300<br />
^2200<br />
32100<br />
x<br />
«2000<br />
i 1900<br />
I «00<br />
Y« 2314-71-4-98 X<br />
Y=0.4026<br />
Figure 7.10<br />
916<br />
(in Million m3)<br />
Western<br />
Wet Zone<br />
16,760<br />
-<br />
+2960<br />
Trend Of Annual Rainfall At Nuwara Eliya<br />
20 Yr. MOVING AVERAGES<br />
1870 1880 1890 1900 I»K> 1920 1930 I94O I9SO I960 1970<br />
PERIOD <strong>OF</strong> RECORD<br />
Figure 7.11<br />
North Western<br />
Dry Zone<br />
835<br />
216<br />
1996<br />
1377
150<br />
Water Resources<br />
Occurrence of Years Falling within the Driest Decile at<br />
Anuradhapura (1870 -1980 )<br />
Driest in terms<br />
of Annual Total<br />
1873<br />
1876<br />
1893<br />
1905<br />
1950<br />
1956*<br />
1958<br />
1967<br />
1968<br />
1973<br />
1974<br />
reservoirs, as Kandy Lake and Lake Gregory<br />
in Nuwara Eliya. A recent study of Polgolla<br />
reservoir indicated that 44 percent of its<br />
capacity has silted up within less than 12 years<br />
(Perera, 1989). Hence, despite conclusions of<br />
the TAMS consultants (TAMS 1980), the new<br />
Mahaweli reservoirs, such as Kotmale, Victoria<br />
and Randenigala may well be seriously<br />
affected by siltation within their first 50 years.<br />
Ground Water Exploitation<br />
Temporal data for analysis of ground<br />
water resources trends are altogether lacking<br />
except perhaps in the Jaffna peninsula where<br />
a network of observation wells was maintained<br />
for some time by the Water Resources Board.<br />
Increased exploitation of groundwater for<br />
domestic use through large numbers of tube<br />
wells in hard rock areas of the Dry Zone re-<br />
Figure 7.12<br />
Driest<br />
Januaries<br />
1873<br />
1877<br />
1888<br />
1898<br />
1916<br />
1940<br />
1945<br />
1973<br />
1974<br />
1976<br />
1980* (* Driest on record)<br />
quires careful monitoring to determine the<br />
impact on adjacent shallow wells and other<br />
surface waters.<br />
DEVELOPMENT POLICIES<br />
AND INSTITUTIONAL<br />
RESPONSES<br />
With the completion of the Mahaweli<br />
Project, government policies appear to be increasingly<br />
directed towards several new water<br />
resource goals:<br />
• greater efficiency in irrigation water<br />
management in existing schemes, through<br />
farmer participation;<br />
• increasing productivity in existing irrigated<br />
lands through crop diversification<br />
and higher cropping intensities;<br />
I<br />
I<br />
I<br />
I<br />
I<br />
I<br />
I<br />
I<br />
I<br />
I<br />
I<br />
I<br />
I<br />
I<br />
I<br />
I<br />
I<br />
I<br />
I<br />
I
I<br />
I<br />
I<br />
I Î<br />
I.<br />
Î '<br />
I[<br />
IIf<br />
I<br />
I"<br />
I<br />
Iit •<br />
t<br />
I<br />
f •<br />
I<br />
I<br />
I<br />
I<br />
I<br />
i<br />
i i<br />
i i<br />
• rehabilitation of minor irrigation systems;<br />
• ground water development for agriculture and<br />
domestic use;<br />
• development of small-scale hydro-power projects;<br />
• drainage and flood protection improvement; and<br />
• systematic watershed management.<br />
Institutional Authority<br />
Implementation of these policies rests with dozens<br />
of agencies and several ministries under scores of parliamentary<br />
acts. Some institutions began at the turn of<br />
the century, like the Irrigation Department, and others<br />
are more recent, like the Irrigation Management<br />
Division of the Ministry of Lands.<br />
The Ministry of Lands and Land Development ~<br />
the single most important ministry responsible for<br />
water resources affairs in Sri Lanka ~ covers all three<br />
major water resources development sectors, land, irrigation<br />
and forestry.<br />
Within the Ministry the Irrigation Department had<br />
for decades primary responsibility for water resource<br />
planning, project formulation, construction and maintenance.<br />
Its groundwater exploration and development<br />
functions were later transferred to the Water<br />
Resources Board (established in 1964), which now<br />
coordinates government water resources functions and<br />
formulates national policies relating to the control and<br />
use of water resources.<br />
Since 1979 the Mahaweli Authority has been<br />
responsible for water resources development in a large<br />
area of the country, not only coming within the<br />
Mahaweli project region, but also covering many other<br />
major river basins of Sri Lanka. The Water Management<br />
Secretariat of the Mahaweli Authority has the<br />
necessary technical resources to plan the distribution<br />
of water resources under the Authority's jurisdiction.<br />
Other important government institutions include<br />
the Water Supply and Drainage Board -- the leading<br />
state agency on domestic and industrial water supply<br />
and sewage and surface drainage - and the Ceylon<br />
Electricity Board, responsible for the generation, transmission<br />
and distribution of electric power.<br />
Water Resources 151<br />
But these are only the prominent state institutions<br />
concerned with water resource management. Scattered<br />
functions among departments, corporations and<br />
ministries have often resulted in poor coordination and<br />
wasteful duplication. The Water Resources Board has<br />
yet to fulfill its role as the single institution specifically<br />
devoted to water resource coordination and policy<br />
making. The Irrigation Department and the Mahaweli<br />
Authority have not yet made the fundamental changes<br />
in outlook, staffing and priorities to move from construction<br />
to water management responsibilities.<br />
Water Resources Legislation<br />
Scores of parliamentary acts cover different<br />
aspects of water resources in Sri Lanka. By 1977 there<br />
were 41 acts and ordinances related to water resources,<br />
administered by government departments, public corporations<br />
and local bodies (GOSL, 1977). Since then<br />
new acts have been passed, governing coastal and inland<br />
waters as well. Among them all, new and old, a<br />
few have retained central importance: The Irrigation<br />
Ordinance codified ancient customs pertaining to irrigation<br />
water management to suit changing agrarian<br />
conditions, while the Crown Lands Ordinance<br />
provides for the use and control of all waters in rivers<br />
and reservoirs.<br />
The Crown Land Ordinance of 1949 defined a<br />
"private stream" as any river, creek, or ela, whose source<br />
and entire course lies within private land. All others<br />
are "public streams" under state ownership. In the<br />
absence of large landholdings, therefore, private<br />
ownership can only incorporate micro-catchments falling<br />
entirely within private property. Similarly, a private<br />
lake must be situated entirely within the boundaries of<br />
any private property. The right to use, manage and<br />
control water in any public lake or public stream vests<br />
in the State, subject to a few limitations. The Act gives<br />
a person who occupies land on the bank of any public<br />
lake or public stream the "right to use the water in that<br />
lake or stream for domestic use, livestock or agricultural<br />
purposes" provided that it is extracted by manual<br />
means. However, because all beds of public streams<br />
and lakes belong to the State they can only be used by<br />
permit. These provisions of the Crown Lands Ordinance<br />
are implemented through Government Agents<br />
and their deputies.
152<br />
2.5<br />
2<br />
1.5<br />
1<br />
0.5<br />
0<br />
Water Resources<br />
Yearly Average Increase of Runoff<br />
Rainfall Ratios in Some River Basins<br />
-^m ^M WE ._<br />
•^m jH ^Ê M ^J<br />
Kelani Ganga Nilwala WetZone DryZone Island<br />
Catchment Areas<br />
Hi Annual Increase %<br />
Figure 7.13<br />
Kirindi Oya Basin Stream Flow<br />
»CCIIf 5510»<br />
jo i« » i.o» x »nksi>>4.»r<br />
•---o RLMOrr V. T.IJB2+0.9I« >lmSif:2.O7<br />
pcfttoo or RCCORO<br />
Figur» 7.14
I<br />
I I<br />
I<br />
I i ;<br />
I ir ':<br />
I I<br />
I<br />
I<br />
I<br />
I<br />
I !<br />
t<br />
i<br />
I I<br />
I<br />
I<br />
1<br />
I<br />
I<br />
I<br />
I<br />
1500<br />
Iac<br />
g<br />
«5 1000<br />
d<br />
AllYFA<br />
ac<br />
ûî<br />
<<br />
a<br />
500<br />
1939/40<br />
Water Resources 153<br />
Changing Runoff / Rainfall Ratios of the<br />
Upper Mahaweii above Peradeniya<br />
Y=O.56I3+3.7O-23X<br />
r= 0.3969 (95 V.)<br />
n» 34<br />
/<br />
1949/50 1959/60 1969/70<br />
PERIOO <strong>OF</strong> RECORD<br />
Figure 7.15<br />
Mahaweii Ganga Monthly Discharge at Peradeniya<br />
154 Water Resources<br />
Need for watershed management legislation has<br />
been strongly recognized since the 1960s because the<br />
I<br />
Soil Conservation Act of 19S1 did not provide specific m<br />
measures for water conservation. The Water Resources<br />
Board took some interest in formulating a draft Act<br />
f<br />
on watershed management (Arumugam, 1969) over m<br />
twenty years ago without results. Then in 1980, TAMS |<br />
consultants, in their report on the Mahaweli development,<br />
outlined the legislation necessary for a Catchment<br />
Development Corporation. The Presidential<br />
Land Commission followed with its First Interim<br />
I<br />
Report (1985), which cited needs for watershed •<br />
management and provided draft legislation for a<br />
"Watershed Management Authority."<br />
|<br />
Since these largely unfulfilled recommendations •<br />
little has been done to work towards sustainable watershed<br />
management in Sri Lanka. Only the Mahaweli ^<br />
Authority initiated watershed management, but on a I<br />
limited scale in the upper Mahaweli basin, with help<br />
from the GTZ (West German) and ODA (British). In _<br />
the meantime, the Soil Conservation Division of the I<br />
Department of Agriculture and the Department's extension<br />
services for farmers have essentially ceased to ^<br />
function. •<br />
I<br />
I<br />
I<br />
I<br />
I<br />
I<br />
I<br />
I<br />
I<br />
I<br />
I<br />
I
Water Resources 155
156<br />
Clean surface water is essential to meet the needs of Sri Lanka's growing population in urban and rural areas.<br />
I<br />
I<br />
I<br />
I<br />
I<br />
I<br />
I<br />
I<br />
I<br />
I<br />
I<br />
I<br />
I
I<br />
I<br />
I<br />
I<br />
I<br />
I<br />
I<br />
With her small cities and industries and plentiful<br />
water to dilute wastes, water pollution problems in Sri<br />
Lanka are not insurmountable, but they are increasing<br />
rapidly. They will grow steadily more serious as urban<br />
communities grow, industry expands, rural areas<br />
develop, farmers use more pesticides and fertilizers,<br />
and forestry, mining, and other development projects<br />
unfold. In varying degrees Sri Lanka's waters will<br />
receive the unwanted effects of all these human activities.<br />
This section discusses conditions and trends of<br />
water pollution and what can be done to manage the<br />
problem before it gets out of hand.<br />
SOURCES <strong>OF</strong> POLLUTION<br />
Urban Wastes<br />
About 21.5 percent of Sri Lanka's total population<br />
live in officially designated urban areas, which cover 0.5<br />
percent of Sri Lanka's 65,610 square kilometers.<br />
Colombo, Jaffna and Kandy already have serious<br />
problems in disposing of urban wastes, which includes<br />
sewage, liquid waste from industrial processes, sullage<br />
water from kitchens and laundries, garbage and industrial<br />
solid waste, and urban storm water runoff that<br />
carries wastes of every description.<br />
The Colombo Municipal Council area with its estimated<br />
population of 625,000 is the only municipality<br />
with piped sewerage. In 1986 it connected 60 percent<br />
of the inhabitants. Sewage disposal facilities within the<br />
city are shown in Figure 7.17. Yet this means that within<br />
the larger Colombo Urban Area ~ population 1.4 million<br />
in 1981 and over 1.6 million today - sewers serve<br />
less than one quarter of the population. None of<br />
Colombo's sewage is treated before discharge. By<br />
comparison, Bangkok treats only 2 percent of its<br />
sewage, but Singapore treats 80 percent (WRI, 1988-<br />
89).<br />
Colombo's sewered area divides into two districts:<br />
the northern covers 2,100 hectares and until recently it<br />
discharged waste water directly into the Kelani Ganga<br />
PART n<br />
WATER POLLUTION<br />
157<br />
at Madampitiya; the southern covers 1,000 hectares<br />
and now discharges directly to the sea through an ocean<br />
outfall at the mouth of the Dehiwela Canal. Sewage<br />
flow into the Kelani ranges from 67,500-90,000 cubic<br />
meters per day, equivalent to an estimated organic load<br />
of 10,000-26,400 kg BODs/d. Many of the effluents<br />
from Colombo's industries, although not connected to<br />
the sewer network, nevertheless reach the Kelani<br />
through the city drainage network.<br />
Storm water and industrial effluents in the city<br />
discharge into a network of streams and canals (Figure<br />
7.18). This drainage system divides into two parts. The<br />
north-flowing section discharges through the Mutwal<br />
tunnel to the sea near the harbor, and into the Kelani<br />
through the St. Sebastian canal north lock when its<br />
water level is low. At high water, however, this discharge<br />
is directed to the west-flowing sections that<br />
open to the sea at Dehiwela and Wellawatta. A number<br />
of overflows in the sewer system cause further pollution<br />
as sewage enters open water courses.<br />
Problems of waste disposal in Colombo are com-<br />
- pounded because 50 percent of the population belongs<br />
to the low income category, of which many are slum and<br />
shanty dwellers. Occupying marginal lands, they normally<br />
have little or no access to sewer services. Their<br />
sewage and garbage are dumped into the surface water,<br />
particularly where they occupy stream and canal reservations.<br />
A recent study identified 76 low income communities<br />
situated on canal reservations.<br />
Approximately 10-15 percent of the estimated<br />
625,000 inhabitants in the city of Colombo discharged<br />
sewage directly or indirectly into the surface water<br />
network in 1989. In addition, industrial and other<br />
domestic wastewater overflows from the sewer network<br />
regularly enter and pollute the canals. Organic pollution<br />
from sewage accounts for at least 50-60 percent of<br />
the total waste load (10,000 kg BODs/d) discharged<br />
into the canal network in Colombo.<br />
The good news is that the sewer system is being<br />
upgraded and extended to minimize these overflows.
158<br />
Water Resources<br />
Profile of Water Pollution<br />
Although water pollution is caused by hundreds of chemicals, it basically consists of nutrients from<br />
sewage or fertilizers, pesticides from croplands, sediments from cleared lands, and toxic metals from<br />
industry. In Europe and North America serious pollution of lakes and streams comes from the air through<br />
acid precipitation, but in Sri Lanka, so far as we know, the most significant pollution comes from the land.<br />
It comes from either specific discharge points or diffused, non-point sources. Point sources, most<br />
easily controlled in theory, include industrial discharges of heavy metals, organic waste, and other<br />
pollutants, or discharge from urban sewers or sewage treatment plants.<br />
Non-point pollution, more difficult to identify and manage, includes urban, agricultural, or any other<br />
land runoff. Urban runoff into lakes, streams or canals includes nearly every pollutant - nutrients, toxics,<br />
oils, bacteria, and sediment. Agricultural runoff into streams and rivers usually includes pesticides,<br />
dissolved solids, nutrients from fertilizers, organic material, and pathogens. Runoff from forestry, road<br />
construction or other land-clearing introduces high levels of suspended solids and various oxygendemanding<br />
loads. Runoff from mines can add sediment, acids, and heavy metal pollution.<br />
We care about water pollution first and foremost because it makes people ill or causes death.<br />
Lack of potable water and sanitation causes the most common tropical diseases, transmitted by<br />
mosquitoes, other insects, parasites, and other water-related disease vectors. About 80 percent of all<br />
illness in the developing world results from unsafe and inadequate water supplies. Contaminated water<br />
causes cholera in 10 million people each year, and diarrhea that kills 5 million children each year (WRL<br />
1988-89).<br />
Pollution reduces food supply by killing fish and destroying aquatic habitat Periodic fish kills in the<br />
Kelani River starkly illustrate the problem, but more gradual destruction of productive fisheries may be<br />
more difficult to control. In Asia alone, pollution seriously harms major fisheries in the Strait of Malacca,<br />
the Andaman Sea coast, the Bight of Bangkok, and Manila Bay. Heavy metal toxics from industrial effluent<br />
attack productive estuaries by concentrating in fish and shellfish, making them hazardous for humans to<br />
eat. Sediment from upstream agriculture and land clearing has caused turbidity in marine waters by<br />
blocking light and reducing Gsh habitat.<br />
Excess nutrients from urban sewage cause lakes and lagoons to die by becoming eutrophic — a<br />
common global problem starkly evident in Colombo's murky and greenish Beira Lake (see box). Nutrients<br />
from point and non-point sources cause an aging process - eutrophication — that stimulates plant<br />
production and algae blooms. As the plants die, settle, and decay, they rob the water of levels of dissolved<br />
oxygen needed for plants and fish, causing the death of formerly productive ecosystems. Eutrophication<br />
from human activities not only kills fish but makes waters unsuited to recreation.<br />
To measure water quality we use various indicators.<br />
Fecal Coliform Bacteria (FC) is a traditional, sanitary engineering measure of water pollution from<br />
feces of warm-blooded animals. They usually arise from discharges of human sewage, feedlots, and grazing<br />
lands.
I<br />
I I Water<br />
I<br />
I<br />
I<br />
I<br />
k<br />
i i<br />
i<br />
Resources 159<br />
• Dissolved Oxygen (DO) is one measure of water's ability to support aquatic animal life - a necessary<br />
but not sufficient condition. Low DO levels may result from large amounts of decaying organic matter<br />
introduced by natural causes or from human sewage. Low levels may cause many aquatic organisms<br />
to die.<br />
• Biochemical Oxygen Demand (BOD5) measures the amount of dissolved oxygen that microorganisms<br />
consume as they oxidize organic materials over a given period.<br />
• Measurements of heavy metals, such as lead (Pb), mercury (Hg), copper (Cu), cadmium (Cd), are<br />
important because they are toxic to plants and animals. They are neither readily soluble in fresh water<br />
nor usually found in high concentrations under natural conditions. High levels indicate industrial<br />
pollution and persistent hazards to humans who consume the water.<br />
• High levels of nitrates and phosphorous (P) in rivers indicate pollution from domestic sewage,<br />
agricultural fertilizers, livestock wastes, and some industrial wastes. Nitrogen (N) and phosphorous<br />
are nutrients that help cause algal blooms and eutrophication. Nitrates are health hazards, especially<br />
to infants.<br />
Sewage Disposal in Colombo City<br />
Percentage of Households Served<br />
Sewer<br />
Septic tanks<br />
22<br />
Sourc«:Cantral Environmental Authority;<br />
Tlllakaratn»<br />
Figure 7.17<br />
Pit/Bucket<br />
12
160<br />
Further, because the ocean outfall at the harbor mouth<br />
has become operational, the northern sewerage system<br />
longer discharges into the Kelani river at Madampitiya.<br />
Yet questions remain: will an ocean outfall solve<br />
the pollution problem, or simply exchange one problem<br />
for a new one in the ocean and along the coasts? Even<br />
with new ocean outfalls and new developments with<br />
sewage disposal, discharges from the drainage systems<br />
of Colombo will still cause serious water pollution.<br />
Cities smaller than Colombo produce similar<br />
urban water pollution problems that often receive less<br />
notice. Kand/s population of 97,872 (1981 census)<br />
largely uses on-site disposal systems for sewage disposal,<br />
but only 50-60 percent of the houses use septic<br />
tanks or pit latrines. Low income settlements and high<br />
density mixed development in the city core discharge<br />
sewage and sullage directly into the surface drainage<br />
network.<br />
This pattern recurs in all our cities and suburbs;<br />
canals and waterways have been turned into open<br />
sewers.<br />
Urban waste disposal has affected not only surface<br />
water but ground water as well. Water pollution in<br />
Jaffna, which rests on miocène limestone soils, is one<br />
such example. Sewage disposal in Jaffna occurs<br />
through on-site systems, mainly pit latrines, and the<br />
permeability of the limestone, enhanced by its inherent<br />
crevices and channels, has caused widespread pollution<br />
of the water table.<br />
In unsewered urban areas some major housing<br />
schemes and hospitals have waste water treatment<br />
plants. Yet many operate poorly due to lack of awareness,<br />
technical skills, or interest on the part of responsible<br />
authorities.<br />
Water Resources<br />
Large urban centers face rising problems in disposing<br />
of urban solid waste, both domestic and industrial.<br />
Generation of domestic solid waste within the Colombo<br />
Metropolitan Council region was 450 tonnes per day in<br />
1987 and is estimated to rise to 470 tonnes per day in<br />
1992. Disposal and filling is not always sanitary, causing<br />
pollution and clogging of surface canals and drains and<br />
pollution of ground water. The problem compounds<br />
when urban solid waste fills lowlands for development<br />
purposes — a common occurrence given increasing<br />
demands for urban land. Housing developments on<br />
such sites, lacking piped water, may resort to ground<br />
waters that are badly polluted.<br />
Industrial Waste<br />
Industrial wastes in Sri Lanka undergo little or no<br />
treatment before discharge. Until recently the laws and<br />
by-laws relating to pollution and nuisance have been<br />
poorly enforced; liquid effluents are discharged directly<br />
into surface drainage networks or onto land, whence<br />
they reach the closest water body. Thus, textile dyeing<br />
and printing industries have caused widespread pollution<br />
in Ratmalana and Moratuwa. One study for the<br />
Central Environmental Authority estimates that in<br />
Colombo the total waste from industry discharged into<br />
the canal network is 70,000 person equivalents, or 3,900<br />
kg BODs/day. A portion of this eventually reaches the<br />
Kelani Ganga.<br />
Industries in Sri Lanka fall into two categories.<br />
One includes large-scale operations which have been<br />
established outside the main cities that have essential<br />
infrastructure and urban services. The second includes<br />
the smaller and medium-scale industries which of<br />
necessity are established in or near cities where infrastructure<br />
and urban services are, or can easily be,<br />
available.<br />
Industrial estates are not numerous. The most well<br />
known are the Katunayake and Biyagama industrial<br />
estates in the Gampaha district within the jurisdiction<br />
of the GCEC. Both are equipped with treatment<br />
plants. From 1963 to 1975 only three major industrial<br />
estates were established by the government — Ekala,<br />
Pallekelle and Atchuvely. During the late 1970s three<br />
mini-estates were developed in Horana, Pannala and<br />
Lunuwila. The Colombo district has two others ~ the<br />
Ratmalana industrial estate and the LadyCatharine<br />
industrial estate, both established south of Colombo<br />
outside its municipal limits. Neither carries out any<br />
waste treatment. The Katuwana estate in Homagama,<br />
in the Gampaha district, will commence operations<br />
shortly. In addition medium-scale operations tend to<br />
agglomerate, creating areas of predominantly industrial<br />
development that are usually designated<br />
I<br />
I<br />
I<br />
I<br />
I<br />
I<br />
I<br />
I<br />
I<br />
I<br />
I<br />
I<br />
I<br />
I<br />
I<br />
I<br />
I<br />
I<br />
I<br />
I<br />
I
I<br />
I<br />
Is •<br />
I<br />
I<br />
I<br />
I<br />
i<br />
I<br />
i;<br />
p<br />
I<br />
I<br />
!<br />
I<br />
I<br />
I<br />
I<br />
i<br />
i<br />
i<br />
i<br />
i<br />
COLOMBO<br />
KOLLUPITIYA<br />
BAMBALAPfTIYA<br />
km.<br />
Mf. LAVINIA<br />
Water Resources<br />
Colombo North and South Drainage Canals<br />
MORATUWA<br />
Otmatogodo Canal North<br />
Rgure 7.18<br />
Kot f Ela<br />
LoHa<br />
COLOMBO CITY LIMITS<br />
PILIYANDALA<br />
PANNIPITIYA<br />
161
162 Water Resource*<br />
Sector<br />
Textile dyeing<br />
Printing<br />
Leather<br />
Processing<br />
Distillery<br />
Waste Load from some Polluting Sectors<br />
No.<br />
12<br />
4<br />
1<br />
5<br />
6<br />
5<br />
Location<br />
District<br />
Colombo<br />
Gampaha<br />
Kurunegala<br />
Colombo<br />
Gampaha<br />
Kalutara<br />
as industrial zones by the Urban Development<br />
Authority when it produces development plans for a<br />
particular local authority.<br />
Data on industrial plants and pollution has been<br />
limited, but industrial pollution appears ever more<br />
serious as the information base improves. A 1989 survey<br />
indicated that 80 percent of manufacturing industries<br />
of all sizes are located in Colombo and<br />
Gampaha districts. Of the 7,610 medium- and largescale<br />
plants it identified, 60 percent (4,600) were considered<br />
likely to have potential for pollution. Of these,<br />
291 (6 percent) appeared to have a high pollution<br />
potential and 1,900 (40 percent) moderate potential.<br />
The 1989 survey identified 115 significant polluters, but<br />
the CEA staff now estimate (November, 1990) that well<br />
over 230 plants may be significant polluters, including<br />
state as well as private companies, and that the number<br />
of the industrial plants is larger than the original survey<br />
showed.<br />
Figure 7.19 lists the process waste loads from highly<br />
polluting industrial sectors, both state and privately<br />
owned. Because of their high pollution potential, the<br />
extent to which even these small- to medium-sized<br />
BOD5 tons/yr SS tons/yr<br />
1,564<br />
1,629<br />
Figure 7.19<br />
480<br />
734<br />
767<br />
421<br />
Waste Load<br />
472<br />
492<br />
145<br />
510<br />
533<br />
492<br />
HM tons /yr*<br />
11<br />
12<br />
* heavy metals<br />
facilities have already caused pollution is remarkable.<br />
Their size and scattered location makes pollution control<br />
costly and difficult. This is particularly evident in<br />
the case of local resource-dependent activities like rubber<br />
processing. By conservative estimates, up to 28,300<br />
tons of BOD5 are discharged annually, polluting waters<br />
in the Ratnapura District.<br />
Unlike many developed countries, however, Sri<br />
Lanka has relatively few severe pollution problems<br />
from chemical industries, because this sector is largely<br />
represented by manufacturers of paints, varnishes, cosmetics,<br />
and other chemical products estimated to have<br />
a relatively low potential for pollution.<br />
Pollution from purely state-owned industries is<br />
most likely from the medium- to large-scale plants<br />
manufacturing paper, sugar, cement, steel, and<br />
petroleum. Individually these industries are highly polluting,<br />
as is the case with the cement factories at<br />
Kankesanthurai, Puttalam, and Galle, and the paper<br />
mills at Valachchenai and Embilitiya. In theory, being<br />
few in number, and having centralized operation, their<br />
problems can be easily controlled, if the state makes the<br />
effort to do so.<br />
I<br />
I<br />
I<br />
I<br />
I<br />
I<br />
I<br />
I<br />
I<br />
I<br />
I<br />
I<br />
I<br />
I<br />
I<br />
I<br />
I<br />
I<br />
I<br />
I<br />
I
I<br />
I<br />
I<br />
I<br />
I<br />
I<br />
I<br />
I [<br />
I<br />
I rii<br />
i<br />
i<br />
i<br />
i i<br />
i •<br />
i<br />
I<br />
Rural Sanitation<br />
The census figures for rural areas in 1981 revealed<br />
that only 5 percent of the rural population had access<br />
to piped water, 85 percent used wells, and the rest<br />
depended on streams and rivers (see Population Chapter).<br />
Between 30 and 40 percent of the wells in the<br />
Hambantota, Moneragala, and Matale districts are unprotected<br />
and 25-30 percent of rural populations in<br />
Moneragala and Hambantota areas depend on rivers<br />
and tanks for potable water. If similar trends occur<br />
elsewhere, rural sanitation problems will assume growing<br />
importance. Lack of sanitation facilities and practices<br />
will largely determine the exposure of rural<br />
populations to waterborne disease.<br />
Sanitation figures show that 44 percent of the rural<br />
population use pit and bucket latrines, while 36-5 percent<br />
use no latrine facilities whatsoever. In 7 of the 13<br />
predominantly rural coastal districts, 60 percent of<br />
residents have no sanitary facilities. In these same<br />
districts over 90 percent of the population use wells,<br />
rivers, tanks and springs for water supply. Many water<br />
sources in rural areas are also unprotected. The result:<br />
a high proportion of the population is exposed to health<br />
risks associated with fecally contaminated water, either<br />
through ground water pollution or from surface contamination.<br />
According to one study, "the poor water<br />
supply and excreta disposal systems have resulted in 40<br />
percent of the Sri Lankan population being affected by<br />
typhoid, amoebic and bacillary dysentery, infectious<br />
hepatitis, gastro-enteritis, colitis and worm infections"<br />
(Hydrogeochemical Atlas of Sri Lanka).<br />
Agricultural Wastes<br />
Agricultural waste results from agricultural practices<br />
and agro- and livestock-based industries in the<br />
rural sector. - - - •<br />
Nearly one-third of Sri Lanka's land is cropped,<br />
and on it fanners put two to eight times more fertilizer<br />
than other countries in the region, reaching levels as<br />
high as 77 kg/ha. Certain districts show annual application<br />
rates for paddy in the range of 124 kg/ha. Fertilizer<br />
application rates for the country in general show an<br />
upward trend over the past decade (Figure 7.20).<br />
Water Resources 163<br />
Fertilizer pollution has become a potential hazard.<br />
Intensive agricultural patterns in the Jaffna and<br />
Nuwara Eliya districts have already caused pollution of<br />
ground and surface water by nitrates. Excess nitrates<br />
can cause bowel and other diseases in children. With<br />
its extensive sugarcane plantations covering an estimated<br />
25,000 hectares, the Moneragala district is<br />
another potential recipient of fertilizer pollution. Seven<br />
river basins drain this district and monitoring of surface<br />
waters may well reveal the presence of agrochemicals<br />
in some of them.<br />
Pesticide use has also risen steadily. Paddy is the<br />
highest consumer of pesticides (equivalent to 70 percent<br />
of the imports), and the average rate of application<br />
between 1977-1983 increased from 1,200 grams per<br />
hectare to 1,600 grams per hectare.Between 50 and 60<br />
percent of the farmers use at least twice the recommended<br />
dose.<br />
A further consequence of agricultural practices on<br />
hilly terrain is the silt carried through the run-off, along<br />
with the fertilizers and pesticides. Degradation of<br />
Lake Gregory has become notorious ~ an oft-cited<br />
example of the impacts of seasonal crop cultivation<br />
with inadequate soil conservation.<br />
Lack of data clouds our understanding of pesticides<br />
and fertilizer impacts on waterways. No systematic<br />
studies have been undertaken and little or no<br />
published data on monitoring are available on pesticides<br />
and fertilizer levels in the run-off from cultivated<br />
land. CISIR is presently involved in two monitoring<br />
studies in the Kandy and Batticaloa districts.<br />
Nor have studies systematically measured the<br />
potential pollution impacts of agricultural and livestock-based<br />
industries here, such as pig and poultry<br />
farms. For example, paddy milling capacity increased<br />
by 60 percent between 1980 and 1987 due to new private<br />
sector mills. Although milling has caused localized<br />
pollution in the north central and eastern provinces we<br />
cannot yet determine the magnitude of the problem. We<br />
do know that mills consume substantial quantities of<br />
water during the milling season, and their high BODs<br />
can cause pollution of wells and streams used for local<br />
drinking water.
164<br />
Natural Factors<br />
700 -,<br />
600<br />
SOO<br />
300<br />
K 200<br />
ui<br />
u.<br />
100<br />
Water Resources.<br />
Trends in Fertilizer Application Rate<br />
1979 '80 '81 '82 '83 '84 '6<br />
TEAR<br />
Background contributions of geological factors to<br />
water pollution cannot be overlooked when analysing<br />
water resource constraints and environmental conditions<br />
and trends. Geological conditions cause high<br />
fluoride levels in water in parts of Sri Lanka. Too much<br />
fluoride causes dental fluorosis, and too little may<br />
result in high dental caries. Eppawela and Anuradhapura<br />
have the highest groundwater concentrations,<br />
reportedly as high as 9 milligrams per liter (mg/1). In<br />
Polonnaruwa district 15 percent of tube wells showed<br />
levels of fluoride above 2 mg/1. Excessive levels of<br />
fluoride that cause severe dental fluorosis among area<br />
residents result from fluoride leaching into ground<br />
Figure 7.20<br />
'86 '87<br />
TEA<br />
COCONUT<br />
RU88ER<br />
water from the area's fluorine-rich apatite deposit. The<br />
Uda Walawe area is also high in ground water fluorine<br />
concentrations, due to serpentine deposits that contain<br />
1000 to 2000 ppm fluoride. Pollution of ground water<br />
occurs through a process of ion exchange.<br />
Oil Discharges<br />
-Oil pollution in Sri Lanka, although low level, is<br />
becoming chronic. The southern coast lies along the<br />
main east-west shipping routes that bring oil from the<br />
Middle East to Asian and other ports. Risks of a<br />
massive accidental spill are omni-present, but long term<br />
build-up from chronic pollution is more likely from<br />
discharge of ballast and bilge water.<br />
I<br />
I<br />
I<br />
I<br />
I<br />
I<br />
I<br />
I<br />
I<br />
I<br />
I<br />
I<br />
I<br />
I<br />
I<br />
I<br />
I<br />
I<br />
I<br />
I<br />
I
I<br />
I<br />
I<br />
i<br />
!<br />
i<br />
i<br />
i !<br />
!<br />
I<br />
I<br />
1<br />
I<br />
I<br />
I<br />
f<br />
Water Resources<br />
Beira Lake Pollution - Causes And Remedies<br />
Colombo's Beira Lake is one of Sri Lanka's most polluted waters. At 67.6 ha. Beira is twice<br />
the size of the well known Kandy Lake but it divides into four sections. The pollution problem<br />
is conceptually simple; too much pollution comes in and virtually none gets out. Flows out of<br />
Beira are restricted yet it receives city waste from an extensive catchment of 757 hectares and a<br />
thousand or more outfalls of varying sizes.<br />
A recent study (NBRO, 1989) of 28 of these outfalls shows COD levels varying between 29<br />
and 816 mg/1 and SS in the range of 39-330 mg/1. The volumetric discharge in these outfalls varied<br />
between 7 and 40m 3 /ha in dry weather.<br />
The lake is artificially maintained at a level of 1.8 meters msl by a system of lock gates opening<br />
into the St. Sebastian canal and thence north to the Kelani river. These gates allow drainage of<br />
lake water into the Kelani on certain occasions and vice versa. Early in the British period the<br />
entire Colombo canal network and Beira Lake were an integrated system used extensively for<br />
navigation. Then this system fell into disuse and the rapidly growing city used it as a natural<br />
drainage outlet.<br />
Lake water quality began to deteriorate in the late nineteenth century. The decrease in<br />
quality became exponential and recent studies (NARA 1985) indicate that the "greening" of the<br />
Beira is due to algal blooms caused by the blue green algae microcyst. Beira Lake is a fine example<br />
of eutrophication!<br />
After earlier efforts failed to improve matters a technical committee in 1989 recommended<br />
several remedial measures. One is a throughflow system to replenish and circulate the waters of<br />
the Beira, particularly in the south west section. The initial source of replenishment would be<br />
the waters of the east Beira, but pumping Kelani water through the St. Sebastian canal is a<br />
longer-term proposal, estimated at 62 million rupees in 1986. Controlling the pollution inputs is<br />
the other key remedy involving a number of difficult actions: connecting sewers properly so they<br />
do not overflow into the Beira; removing or eliminating all other sources; settling shanty<br />
populations away from the banks; dredging the lake bottom; and working with all major polluters<br />
to control their pollution. It will take time and money; both will be necessary to restore Beira<br />
Lake to the kind of urban amenity that can again please tourists and residents alike.<br />
These discharges already pollute some southern<br />
beaches with tar balls. A different concern is oil and<br />
petrol washout from the 100-odd service stations and<br />
large garages in Colombo. These discharges may be<br />
carried to the Kelani estuary or the beaches around<br />
Colombo. Actual pollution loads must still be computed<br />
even to begin to understand the problem.<br />
TRENDS IN WATER QUALITY<br />
Comprehensive water quality data on surface<br />
water, ground water, estuaries and coastal waters are<br />
not available in part because of diffused resources<br />
165<br />
management responsibilities. The Irrigation Department,<br />
Water Resources Board, National Water Supply<br />
and Drainage Board (NWS & DB), National Aquatic<br />
Resources Agency (NARA), Mahaweli Authority, and<br />
Coast Conservation Department (CCD) all manage<br />
water resources and collect data. Many independent<br />
water quality studies by universities and international<br />
agencies have also been carried out with no cohesive<br />
force guiding the search for information or its ultimate<br />
use. With data scattered, unpublished, or available in<br />
unprocessed form, analysis becomes onerous, when<br />
possible at all.
166<br />
An attempt is made here to project some coherent<br />
trends based on data for the Kelani and Mahaweli<br />
rivers, several important urban water bodies in cities<br />
and health resorts, ground water in the Jaffna peninsula,<br />
areas subjected to pollution and salt water intrusion,<br />
and coasts and estuaries.<br />
Kelani Ganga<br />
The Kelani Ganga, the second largest river in Sri<br />
Lanka (1443 kilometers), drains an area of 2,278<br />
square kilometers in the west zone that contains some<br />
of the country's most densely populated districts. However<br />
most of its organic pollution comes in its last SO<br />
kilometers before it flows into the sea at Mattakuliya.<br />
Colombo receives most of its potable water from<br />
the Kelani Ganga. The intake point is at Ambatale, 14<br />
kilometers from the river mouth. In turn, the Ketani<br />
receives a substantial portion of Colombo's sewage and<br />
drainage. Until 1990 the Madampitiya pumping station<br />
discharged 68,000-90,000 cubic meters of sewage and<br />
industrial waste into the Kelani each day. Characteristics<br />
vary between 250-500 mg/1 COD and 16-45<br />
mg/1 TKN, which means that from this source alone thé<br />
daily load entering the Kelani was 10,000 kg BODs/d.<br />
Among the many water quality parameters that can<br />
be measured, most significant for the Kelani are organic<br />
matter from the large volumes of sewage and organic<br />
industrial effluent, and nitrates from sewage and fertilizer<br />
runoff. Heavy metal contamination also occurs<br />
mainly from tanning effluents in the lower reaches and<br />
to a lesser extent discharge from metal finishing and<br />
processing industries, but no precise discharge data are<br />
available.<br />
Pesticide contamination may not be serious yet<br />
because much of the Kelani catchment drains through<br />
plantations where pesticide use has been much lower<br />
than in irrigated agriculture.<br />
Estimated contributions from the major waste<br />
sources most likely to affect the Kelani are displayed in<br />
Figure 7.21 and Figure 7.22. Figures do not include<br />
non-point sources. The St. Sebastian canal, one of<br />
Colombo's drainage outlets, enhances pollution levels<br />
periodically when the Kelani is sufficiently low to allow<br />
the discharge of canal water through the North lock.<br />
Water Resources<br />
Dissolved oxygen (DO) levels in the canal are zero, and<br />
the BODs levels are around 350 mg/1. As can be observed,<br />
recent operation of the northern ocean outfall<br />
for the city sewage, diverting it from the Kelani, will<br />
vastly improve water quality.<br />
Monitoring of water quality in the lower Kelani<br />
from 1973 to 1974 (see Figure 723) measured dissolved<br />
oxygen — a good indicator of the river's health. Even in<br />
1973 the last 12 kilometers of the river that drains the<br />
most industrialized section had DO values of only 20<br />
to 30 percent saturation, whereas 60 percent saturation<br />
was observed at Kitulgala, about 96 kilometers<br />
upstream from the river mouth. Low values of DO<br />
downstream indicate how quickly a large influx of pollution<br />
can cause anaerobic conditions. Sudden fish kills<br />
that occur in the river illustrate one of the severe effects.<br />
The highest values of suspended solids and total<br />
nitrogen are also occurring in this stretch. More recent<br />
data from a single monitoring station 20 kilometers<br />
from, the river mouth and upstream of the Ambatale<br />
water intake show water quality within levels deemed<br />
acceptable (Figure 7.24).<br />
Heavy metals and pesticide levels have not been<br />
studied extensively in the Kelani. Levels in excess of<br />
tolerance limits for fresh water have been noted for<br />
cadmium (9 ppb), copper (11 ppb), and lead (9 ppb),<br />
which are the only elements monitored (Dissanayake,<br />
Weerasooriya, 1986). Discharges from local tanneries<br />
may well cause chromium pollution, but no data are<br />
available.<br />
I<br />
I<br />
I<br />
i<br />
i<br />
i<br />
i<br />
i<br />
i<br />
i<br />
i<br />
i<br />
i<br />
A reliable picture of the pollution conditions and Ä<br />
trends requires sustained monitoring of sediment pol- •<br />
lution as well as surface water pollution.<br />
Impacts of sandmining in the Kelani have been<br />
extensive in the lower reaches. As a result, the Kelani's<br />
lowered river bed has allowed the intrusion of salt<br />
water. Conductivity and chloride measurements made<br />
by the Irrigation Department have shown that the saline<br />
plume is steadily extending further inland and will<br />
presently reach the Ambatale intake.<br />
Mahaweli Ganga<br />
The Mahaweli, Sri Lanka's longest river (325<br />
kilometers), with an annual discharge of 7,650 million<br />
I<br />
I<br />
I<br />
I
I<br />
I<br />
I<br />
Sewage pumping ^^^H<br />
10000 ^^^M<br />
Water Resources 167<br />
Waste Sources Affecting the Kelani<br />
Before Ocean OutfalKKG B0D5/d)<br />
cubic meters also has by far the largest catchment area<br />
(IO327 square kilometers), covering one-sixth of the<br />
country. Under the Mahaweli development program<br />
over 16 percent of this catchment will be irrigated for<br />
paddy and home garden cultivation. By 1984 the<br />
Mahaweli water quality monitoring program was underway<br />
to assess project impacts of these and other<br />
changes.<br />
For approximately half its length the Mahaweli<br />
traverses the Wet Zone, passing through densely populated<br />
towns, including Kandy and Matale. From Kandy<br />
alone it receives substantial untreated urban waste<br />
water through the two main waterways draining the city<br />
- the Meda Ela and the Hali Ela, which together<br />
receive a load of 712-1,507 kg BODs/d from dense city<br />
center developments.<br />
Low levels of industrialization have kept industrial<br />
pollution of the Mahaweli below that of the Kelani, yet<br />
expansion of the agricultural and agro-based industrial<br />
sector will require careful impact assessment. Results<br />
of a hydrogeochemical survey from August to December<br />
1983 documented the variation in a number of<br />
metallic and non-metallic constituents in the water.<br />
Monitoring data covered the area from Nawalapitiya to<br />
Gallela. Ranges for some of these parameters are<br />
ft<br />
IM<br />
II<br />
luTanneries<br />
700<br />
Figure 7.21<br />
1§SN§sf Oil refinery •<br />
! C ^' 860<br />
Food, vegetable oil<br />
1900<br />
shown in Figure 7.25. A comparison of heavy metals<br />
concentrations for the two major rivers indicates that<br />
levels are still well within the fresh water norms (Figure<br />
7.26).<br />
Nitrate concentrations have shown a definite increase<br />
along the direction of flow. Sewage also contributes<br />
to increased nitrate levels, but population in<br />
these areas is relatively low. The Mahaweli River is a<br />
clear case of agrochemical usage in the catchment contributing<br />
to elevated nitrate levels.<br />
Without recorded data on pesticide residues we<br />
can only estimate the pollution caused by these<br />
materials. Increased pesticide levels may occur as the<br />
river flows downstream.<br />
Other Rivers,Waterways and Water Bodies<br />
Wastes from townships often discharge into small<br />
adjacent streams or rivers and ultimately reach the<br />
major waterways. Most of this waste is organic and<br />
could cause anaerobic conditions in some places.<br />
Rivers like the Uda Walawe have also been subjected<br />
to industrial wastes from a single factory. Such conditions<br />
can be corrected relatively easily, however.
168<br />
Water Resources<br />
Water Pollution Impacts on the Keiani River<br />
Before Ocean Outfall<br />
COkOMBO<br />
TSSmg/l 15.6 28<br />
Total Nmg/I 1.0 2.51<br />
CODmg/l 0.8 1.9<br />
DO% Sat 21 28<br />
Distance<br />
Figure 7.22<br />
Water Quality of Lower Keiani River<br />
Minimum values observed During 1973-1974<br />
Modéra Mattakuliya<br />
from mouth Mouth lKm<br />
TSS = Total Suspended Solids<br />
Total N = Total Nitrogen<br />
COD = Chemical Oxygen Demand<br />
DO = Dissolved Oxygen<br />
69<br />
1.57<br />
1.7<br />
36<br />
Madampitiya<br />
UK<br />
Figure 7.23<br />
26 11.6<br />
0.71 0.63<br />
1.12 1.2<br />
53 18<br />
Kelaniya Ambatale<br />
12K 14.6<br />
2.9<br />
1.26<br />
Kitulgala<br />
96 Km<br />
1.0<br />
68
Ground Water<br />
Ground water is increasingly used for potable<br />
water, especially in small towns and rural areas. The<br />
ten year plan launched in 1980 envisaged drilling 20,000<br />
deep wells and constructing or rehabilitating 25,000<br />
dug wells. By this means 50 percent coverage for the<br />
rural population was to be achieved by 1990, although<br />
this target has not yet been reached.<br />
Estimated ground water potential for the country<br />
is 780,000 hectare/meters per annum. For this water to<br />
remain safe, water extraction must not exceed the<br />
aquifer's replenishment capacity. Otherwise the well<br />
will run dry or, in coastal areas, invite brackish water<br />
intrusion.<br />
This problem has occurred in northern coastal<br />
areas and the northwest agricultural belt where ground<br />
water irrigates rice and cash crops. Demand for<br />
domestic water from ground water is rising in Puttalam,<br />
Mannar, Paranthan, Kilinochchi, and Mullaitivu areas.<br />
To supplement surface water irrigation 130 tube wells<br />
were built over four years to tap the Murunkan limestone<br />
aquifer. Subsequent unregulated ground water<br />
use led to rapid salinity intrusion. Salt water intrusion<br />
into ground water has occurred in the Hambantota area<br />
due to seepage from rainwashed dissolved solids.<br />
The most serious threats to ground water come<br />
from nitrate and bacterial (fecal) contamination.<br />
Nitrate pollution is due as much to extensive use of<br />
agrochemicals as to the disposal of sewage effluent<br />
from pit latrine soakaways and septic tanks, which<br />
causes bacterial contamination of ground water.<br />
River and canal pollution also affects ground<br />
water; analyses of well waters from Thotalanga near a<br />
polluted stretch of the Kelani, and from the banks of<br />
the Meda Ela in Kandy, highlight the influence of polluted<br />
surface waters on wells. This problem is critical<br />
in urban areas where ground water provides most of the<br />
potable water.<br />
Data on distribution of nitrate in ground water is<br />
available for the northern and northwestern coastal<br />
areas that largely comprise miocène limestone.<br />
Limited monitoring in the Kalpitiya peninsula, intensively<br />
cultivated and irrigated, has shown considerable<br />
Water Resources 169<br />
aquifer contamination by nitrates in fertilizer. Peak<br />
seasonal concentrations there reached four times the<br />
WHO guideline; concentrations in the ground water<br />
beneath unfertilized land were substantially lower.<br />
Similarly, in agricultural and non-agricultural<br />
areas in the Jaffna peninsula, nitrate concentrations<br />
over 200 mg/1 of NO3 have been recorded. Widespread<br />
water contamination in the peninsula results from<br />
agricultural washouts and pit latrine soakaways.<br />
Within the urban limits of Jaffna and Point Pedro high<br />
nitrate concentrations in some areas range from 122 to<br />
174 mg/1, which can be attributed to sewage pollution<br />
from pit latrines. As noted above, the karstified limestone<br />
enhances the possibilities of such pollution. Of<br />
the wells monitored in one study 80 percent showed<br />
unacceptable bacterial quality due to sewage.<br />
Leaching of pesticides into ground water may also<br />
occur in these agricultural areas, but no analyses have<br />
been carried out due to lack of facilities and funding for<br />
monitoring.<br />
The Moratuwa urban council area, extending<br />
beyond Ratmalana, still uses ground water for potable<br />
water, although pipeborne water from Colombo<br />
reaches the town center. Sewage disposal is by septic<br />
tanks or latrines. The population of 135,000 inhabitants<br />
occupies an area of 13.1 square kilometers — making<br />
the area second in density to Colombo (Figure 7.27).<br />
Not surprisingly, fecally contaminated ground water<br />
(95 percent of samples studied in an area covering 1.5<br />
square kilometers) has been reported in certain<br />
localities.<br />
Differences in population densities affect nitrogen<br />
levels in ground water. Figure 7.28 shows the nitrogen<br />
generated by different population densities and the<br />
concentrations likely to reach ground water in areas<br />
using on-site waste disposal.<br />
Where towns are rapidly expanding and dense<br />
housing communities develop, on-site sanitation systems<br />
are often favored, even though their potable water<br />
comes from ground water. Water treatment systems<br />
are simply too expensive and ground water offers the<br />
most cost-effective alternative. Hence, ground water<br />
protection has become a development imperative.
170 Water Resources<br />
Parameter<br />
Dissolved oxygen mg/l<br />
Conductivity (microsiemens)<br />
pH (acidity)<br />
Suspended solids mg/1<br />
COD mg/1<br />
(chemical oxygen demand)<br />
Nitrate mg/1<br />
Free ammonia mg/1<br />
SAR(sodium absorption ratio)<br />
Source : NBRO (1989)<br />
Estuaries and Lagoons<br />
Water Quality at Ambatale Intake<br />
Average<br />
7.2<br />
34.8<br />
6.5<br />
9.1<br />
19.7<br />
0.12<br />
0.61<br />
0.38<br />
Sri Lanka's 1,585-kilometer coastline is broken by<br />
extensive lagoons, bays, brackish water lakes, and wetlands.<br />
(See Coastal Resources chapter.) Brackish<br />
water bodies include 80,000 hectares of estuaries and<br />
large deep lagoons, and about 40,000 hectares of shallow<br />
lagoons, tidal flats, mangroves, and swamps. Of the<br />
small lagoons, especially along the southwestern,<br />
southern, and southeastern coasts, only a few are open<br />
to the sea and then only for short periods. Largemouthed<br />
lagoons at Negombo, Puttalam, and Jaffna are<br />
perennially open to the sea, and a few others, like<br />
Batticaloa, Kokkilai, and Nayani, form sand bars across<br />
their mouths during the dry season.<br />
Pollution monitoring data on the numerous<br />
lagoons and estuaries are virtually nonexistent. Lower<br />
reaches of the Kelani have received some attention, but<br />
no detailed pollution studies have been made of the<br />
estuary .The same can be said for the Mahaweli estuary<br />
and other lagoons and coastal water bodies. In part this<br />
neglect stems from priorities favoring study of areas<br />
most seriously affected by pollution from large populations.<br />
No major lagoons, except at Jaffna, are linked to<br />
urban centers with populations over 60,000, and no<br />
coastal towns are heavily industrialized except around<br />
Figure 7.24<br />
1988-1989<br />
Range<br />
6.2-13.2<br />
27-44<br />
5.9-7.0<br />
0.4-40<br />
4.6-50.6<br />
0.02-0.2<br />
0.04-6.07<br />
0.1-2.3<br />
1973-1974<br />
. Range<br />
1.5-8.7<br />
-<br />
5.1-7.5<br />
11.6-180<br />
1.2-3.9<br />
0.25-2.65<br />
0.08-1.8<br />
the Kelani estuary. No other large riverine or basin<br />
estuary receives industrial waste. Consequently, with<br />
the assimilative capacity of the sea, pollution loads have<br />
so far been absorbed.<br />
Pollution of the small lagoons and bay estuaries is<br />
much more serious, however. Lunawa Lagoon, the<br />
Bolgoda-Panadura riverine estuary, and Valachchenai<br />
Lagoon show how urban and industrial waste disposal<br />
affects the marine environment.<br />
The Lunawa Lagoon receives water from streams<br />
and rivers and is opened to the sea by human intervention<br />
every three to four weeks to prevent lowland<br />
floods. On the average it receives 81 tons COD and 43<br />
tons SS during each year from surrounding residential<br />
and industrial development. Sewage and industrial<br />
waste have made the two main feeder streams (five in<br />
all) completely anaerobic. The northern lagoon is<br />
eutrophic and exhibits higher levels of nutrients and<br />
pollutants (Figure 7.29) than in the southern section.<br />
Lagoon pollution has caused sediment buildup, although<br />
sediment quantity and quality data are not available.<br />
Eutrophication has set in and the lagoon has lost<br />
much of its value for recreation and prawn and fish<br />
culture.<br />
I<br />
I<br />
I<br />
I<br />
I<br />
I<br />
I<br />
I<br />
I<br />
I<br />
I<br />
I<br />
I<br />
I<br />
I<br />
I<br />
I<br />
I<br />
I<br />
I<br />
I<br />
—I
I<br />
I nI<br />
I<br />
Some Constituents of Mahaweli<br />
Parameter<br />
Copper (Cu)<br />
Zinc (Zn)<br />
Lead (Pb)<br />
Cadmium (Cd)<br />
Water<br />
Chloride (CI)<br />
Nitrate (as nitrogen) (NO3-N)<br />
Phosphate (P04)<br />
Range ppb<br />
4-37<br />
2-270<br />
1-4<br />
1-2<br />
11-27<br />
480-3100<br />
37-473<br />
Source: Oissanayake and Weerasooriy a t'966)<br />
Water Resources 171<br />
Average Metal Contents in<br />
Mahaweli and Kelani<br />
Constituents Mahaweli (ppb) Kelani (ppb)<br />
Cadmium<br />
Cobalt<br />
Lead<br />
Zinc 58 53<br />
Source : Dissanayake and Weerasooriya (1986)<br />
Figure 7.25 Figure 7.26<br />
Population Densities in Major Urban<br />
Colombo<br />
Moratuwa<br />
Kolonnawa<br />
Dehiwela —Mt. Lavinia<br />
Kotte<br />
Centers<br />
50 100 150<br />
i^H Density (pop/ha)<br />
Figure 7.27<br />
200
172<br />
The Panadura-Bolgoda estuary, which also<br />
receives urban and industrial waste, showed BOD<br />
values ranging from 10-100 mg/1 during spring tide.<br />
Background levels are relatively high even for marine<br />
waters.<br />
The Valachchenai Lagoon receives its waste from<br />
a single industry ~ a government paper factory whose<br />
discharge causes significant pollution. Waste loads of<br />
18,000 kg suspended solids and 9,000 kg BOD5 reach<br />
the lagoon daily.<br />
Figures showing fishery declines caused by estuarine<br />
and coastal water pollution are not available but<br />
isolated cases of such pollution leading to economic<br />
losses have become increasingly common. The sea can<br />
assimilate large quantities of industrial wastes, but like<br />
every other recipient it too has limits. Coastal marine<br />
pollution has become an increasing problem around<br />
the globe, and Sri Lanka can be vulnerable, too. Rapid<br />
economic development envisaged for the future, with<br />
attendant rise in tourism, will require immediate attention<br />
to the impact of pollution o<br />
Other Forms Of Water Degradation<br />
Throughout the country, each watershed is likely<br />
to have its own peculiar mix of water degradation<br />
problems. Along with water pollution from industrial<br />
facilities and urban communities, other other adverse<br />
impacts on water quality may be significant as well.<br />
The mineral chapter discusses sand and gem mining<br />
impacts in riverbeds leading to bank erosion and<br />
deregulation of water flows. Land clearing, deforestation,<br />
and steep slope cultivation cause soil erosion and<br />
siltation that contributes to sedimentation and destabilized<br />
seasonal water flows in rivers.<br />
IMPACTS<br />
Economic, social, health, and biological impacts of<br />
water pollution interlink and cannot be viewed in isolation.<br />
All impacts cannot be quantified but efforts can<br />
be made to improve our ability to measure the long- and<br />
short-term economic costs of water degradation and<br />
the lost benefits of water quality.<br />
The high economic costs of water pollution in Sri<br />
Lanka have not been, but can and should be calculated.<br />
Water Resources.<br />
Pollution of surface and ground waters requires costly<br />
treatment to meet potable water demands of expanding<br />
populations. Pollution of inland and estuarine waters<br />
supporting fisheries has resulted in heavy economic and<br />
social loss to fishermen. Pollution of water bodies and<br />
waterways in our cities contributes to a loss in aesthetic<br />
value, and may reduce diversity in plant and animal<br />
species in fresh and estuarine waters. (See Biodiversity<br />
chapter.) Most of these impacts can be quantified, and<br />
many can be put into economic terms: they include lost<br />
fisheries, lost income to fishermen, tourist companies<br />
and guides, costs of pollution controls, water treatment<br />
facilities, and so forth. Such measurements, however<br />
imperfect, offer rational ways to rank priorities for<br />
anticipating and preventing, as well as treating, water<br />
pollution problems.<br />
Water-borne diseases caused by polluted water,<br />
although not precisely evaluated, have increased costs<br />
of health care in cities, small towns, and rural areas.<br />
Despite some improved health care, the numbers of<br />
people affected by water-borne diseases have increased.<br />
The frequent outbreaks of such disease are<br />
evidence of the increased water pollution.<br />
LEGAL AND INSTITUTIONAL<br />
RESPONSE<br />
Heightened concern about environmental pollution<br />
has come recently, but because water is one of<br />
humankind's primary needs, early legislation sought to<br />
prevent water pollution; in 1861 the Thoroughfares<br />
Ordinance made it an offense to throw rubbish into<br />
rivers and canals. Since then Parliament has passed<br />
numerous acts administered by different agencies, from<br />
the purely advisory and coordinating scheme of the<br />
Water Resources Board Act of 1964 to the regulatory<br />
approach of the National Water Supplies and Drainage<br />
Board Act of 1974, dealing with aspects of pollution<br />
control. (See Figure 730.)<br />
Only the laws enacted after 1980, in particular the<br />
National Environment Act, reflect the view that water<br />
is a resource to be protected and managed for the use<br />
of future generations. The National Environment Act<br />
of 1980 with its Amendments of 1988 stands as the most<br />
important single piece of legislation on environmental<br />
protection and management Pollution control is to be
Water Resources 173<br />
Ground Water Pollution In Jaffna<br />
Beneath the Jaffna peninsula and the islands in northern Sri Lanka are sedimentary limestones more<br />
than 50 meters thick, and within these Karst formations are large quantities of ground water that serve the<br />
populatiori~and its agriculture. Pollution now threatens its long-term value and sustainability.<br />
About 30 to 32 percent of Jaffna's rainfall - 1,255 mm annually - recharges its groundwater, while<br />
the rest evaporates or runs off. Recharge to groundwater in the peninsula depends almost entirely on<br />
rainfall percolation. The water table fluctuates in response to the rainfall, rising in the wet season and<br />
falling in the dry season. Fresh water forms lenses up to 24 meters thick, and these overlie the saline<br />
ground water that connects with the sea.<br />
Ground water is the peninsula's only potable water source, exploited mainly through large diameter<br />
hand-dug wells. Of the more than 100,000 such wells, over 25 percent are for irrigation. Since introduction<br />
of mechanical pumps, largely in the 1960s, pumping in excess of safe yield has led to over-extraction. Most<br />
of the water pumped comes from the storage below sea level. As a result the fresh-salt water interface<br />
continues to rise. Storage is replenished during the monsoonal rains, when water levels rise and the<br />
fresh-salt water interface is lowered. If annual recharge to the aquifer is less than annual discharge the<br />
long-term position of the interface will be higher and wells will become increasingly saline.<br />
The major problem with ground water quality is high chloride concentrations. Data from the Water<br />
Resources Board indicate a sharp increase in ground water chloride concentration as one goes deeper,<br />
from less than 400 milligrams per liter to more than 900 milligrams per liter. Areas of the peninsula<br />
experiencing high chloride concentration generally occur where pumping from wells has caused a rise in<br />
the lower boundary of the thin fresh-water lens that overlies saline water. About 23 percent of the<br />
peninsula now experiences or is prone to receive saline water in the dry season. This declines to 10 percent<br />
in December. About 15 to 22 percent of the peninsula receives moderately saline water.<br />
Salinity distribution in the peninsula is very much related to population density and land use. Average<br />
population density of the peninsula is 430 per square kilometer, compared to national density of about<br />
250 per square kilometer, and 1170 per square kilometer in the Western Province. About 60 percent of<br />
the peninsula is occupied by residences and home gardens, 13 percent is under subsidiary crops, and 12<br />
percent lies under paddy cultivation. The island lagoons take up about 10 percent and the balance remains<br />
undeveloped and largely unused.<br />
Intense urban development and agricultural activity in the densest western peninsula (800-1,200<br />
people per square kilometer) has resulted in ground water overdraft far in excess of replenishment. The<br />
serious implications of these trends — a peninsula essentially devoid of fresh water, at least in the dry<br />
season — require restrictions on new wells including careful regulation of size, diameter and the distance<br />
between wells.<br />
Intensive agriculture with increased chemical inputs also raises fears of ground water pollution - a<br />
problem compounded by urban sanitary conditions. Most Jaffna residents lack sanitary toilets, and a large<br />
number of septic tank systems contribute to the deteriorating water quality.<br />
Ground water of the Jaffna peninsula has the highest nitrate content in Sri Lanka. Nitrate levels<br />
directly relate to population density and organic pollution.<br />
Jaffna's nitrate levels exceed WHO limits by 100-150 percent. A detailed study of the ground water<br />
contamination based on case studies in the Jaffna peninsula (Gunasekaram, 1983)found that 80 percent<br />
of the wells yielded water of poor bacteriological quality with high levels of fecal coliform. Among the<br />
major factors responsible:
174<br />
Water Resources<br />
• Discharge of human excreta. Soakage pit/septic tank effluents discharge directly underground. In<br />
densely populated urban areas the distance between soakage pits and wells is as short as 6 meters.<br />
• Excessive use of agricultural fertilizers. Farmers mainly use urea, which contains 46 percent nitrogen.<br />
Excessive use of urea on crops such as chillies and onions is common everywhere. In addition<br />
cattle-manure is often used as a fertilizer, which adds more nitrogen to ground water.<br />
• The ready solubility of urea. Urea easily reaches the shallow ground water table, and under normal<br />
conditions about 75 percent of the nitrates applied reach the ground water body.<br />
The abundant nitrogenous waste from human excreta and synthetic and animal fertilizer easily<br />
percolates to the shallow ground water table through the cavernous limestone aquifer. Geological<br />
conditions are ideal for the excessive accumulation of nitrates.<br />
Ground water pollution and over-pumping in the peninsula result from various activities. The<br />
increasingly urgent need to protect and enhance supplies of fresh water in the peninsula requires careful<br />
management that only peaceful conditions can create.<br />
achieved through permit regulation under the Central<br />
Environment Authority (CEA). All stationary sources,<br />
existing and new, that emit any form of waste-causing<br />
pollution will require environmental licences to meet<br />
legally binding pollution standards.<br />
The CEA's pollution control program has only<br />
recently begun. Polluting industries will be issued annually<br />
renewable licenses by CEA. Local authorities or<br />
Provincial Councils will be delegated the authority to<br />
license small- and medium-scale enterprises under the<br />
licence system initiated on 1 July 1990.<br />
With proper enforcement, liquid effluents from<br />
industries and other stationary and point sources can<br />
be controlled through these regulations, but they will<br />
not control pollution from non-point sources such as<br />
runoff from cultivated or cleared land or urban streets.<br />
Other strategies will have to be adopted within the<br />
framework of a comprehensive environmental policy.<br />
Water quality monitoring, analysis, and research<br />
will be essential to support the permit system and to<br />
identify water quality conditions and trends. Legal<br />
responsibilities for these activities vest in several different<br />
agencies operating in local or regional areas -<br />
such as the Mahaweli Authority in its jurisdiction,<br />
Greater Colombo Economic Commission (GCEC) in<br />
its. Nationally, the CEA has water authority, along with<br />
its regulatory responsibilities. The Coastal Conserva-,<br />
tion Department (CCD) has authority to make water<br />
quality findings in the coastal zone and to regulate<br />
discharge within it.<br />
NARA has the broadest national responsibilities<br />
for scientific, research on aquatic resources — defined<br />
as "all living and non-living resources contained in or<br />
beneath the medium of water." Its authority includes<br />
the collection and dissemination of aquatic resource<br />
data, and the conduct of research on development,<br />
management and conservation of aquatic resources. It<br />
also has the authority to prepare an Aquatic Resources<br />
Management Development and Research Plan, although<br />
without any specified regulatory or management<br />
authority. NARA carries out water quality<br />
monitoring for industries regulated in the free-trade<br />
zone by the GCEC.<br />
KEY ISSUES<br />
Domestic Waste Management<br />
Integrated environmental management for polluted<br />
waterways and water bodies in Sri Lanka's cities<br />
is essential. Urban areas cause and suffer from the<br />
most serious water pollution, although by Asian and<br />
world standards even Colombo is not a large city.
Population<br />
per ha<br />
50<br />
100<br />
250<br />
Source : Lawrence (1988)<br />
DOmg/l<br />
CODmg/l<br />
SSmg/l<br />
Nor-N mg/l<br />
Total P mg/l<br />
Chemical<br />
Nitrogen<br />
kgN/ha/yr<br />
250<br />
500<br />
1000<br />
Northern<br />
0.7-15<br />
20-140<br />
50-170<br />
176<br />
Industrial Waste Management<br />
Industrial water pollution is within manageable<br />
levels because levels of industrialization have so far<br />
been low in Sri Lanka. For CEA's pollution control<br />
strategy to be successful, state-owned industries as well<br />
as large scale private sector industries must adopt pollution<br />
control measures. Small- and medium-scale<br />
operations will often need to control pollution through<br />
common facilities that bring economy of scale. Planning<br />
such facilities for scattered existing industries will<br />
be difficult but future siting of such industries in estates<br />
will facilitate common treatment. The priority for existing<br />
industries is to encourage as much low-cost<br />
primary treatment as possible prior to discharge.<br />
Facilities must be provided for disposal of toxic<br />
industrial chemicals, including chemical sludge from<br />
treatment plants containing toxic wastes. Controlled<br />
landfills or incinerators must be provided.<br />
Expertise on industrial waste treatment technology<br />
is badly needed. It is not readily available in Sri Lanka,<br />
and some must be imported.<br />
Recognizing the limited funds available for direct,<br />
government research and development, incentives<br />
must be given to the private sector to encourage investment<br />
in programs that will bring them, and the community<br />
at large, long-term benefits. Increasing<br />
numbers of environmentalists and economists emphasize<br />
the need to design legislation that not only sets<br />
optimal quality standards and allows careful monitoring<br />
and rigorous enforcement, but also incorporates<br />
economic incentives and allows industrial managers to<br />
determine how best to achieve pollution control goals.<br />
Pollution can be minimized by making it costly to pollute<br />
and profitable to change production processes or<br />
install pollution controls.<br />
Economic incentive schemes to reduce pollution<br />
will require careful monitoring of effluent quality.<br />
Quality standards are necessary, based on the pollution<br />
levels a water body and its biological systems can assimilate<br />
and sustain over time, and what is necessary to<br />
protect human health. As in any approach, discharge<br />
of highly toxic pollutants will need to be prohibited<br />
entirely. To ensure that industries internalize the costs<br />
of their environmental impacts, fees might be estab-<br />
Water Resources<br />
lished for industrial effluent, and penalties carefully set<br />
and rigorously enforced.<br />
Agricultural Waste Management<br />
Agricultural waste disposal and pollution from<br />
pesticides have not become major environmental<br />
problems because agro- and livestock-based industries<br />
have not yet fully developed. Problems need not<br />
develop so long as management and control of these<br />
impacts occur along with agro-industrial development.<br />
Strategies for agricultural waste management should<br />
depend on the type of expansion and activity planned.<br />
Small- and medium-scale livestock-based industries,<br />
for example, might stress size and dispersement criteria<br />
for waste management, because waste treatment technologies<br />
may be too costly. Large-scale developments<br />
may require centralized pollution control management<br />
made feasible through economies of scale.<br />
A coordinated program for collecting data on<br />
various agro-industrial sectors, with particular emphasis<br />
on their water pollution potential will establish<br />
bases for future strategic planning. Similar data collection<br />
is needed on agricultural practices relating to land<br />
and chemical use.<br />
Ground Water Management<br />
Ground water assumes major importance in Sri<br />
Lanka because of its potential as an abundant, clean<br />
source of increasingly necessary supply, yet contamination<br />
threatens this development in urban and rural<br />
areas alike. Once polluted, ground water may be impractical<br />
to clean up. The economic and social costs of<br />
contamination are unusually high.<br />
Long-term ground water management is already<br />
necessary. Systematic monitoring of ground water is a<br />
first, essential requirement, and a monitoring network<br />
must be established and coordinated by an agency.<br />
Ideally, the agency should also be responsible for<br />
ground water protection and use.<br />
Research and Data Generation<br />
Future pollution- control requires much better<br />
generation, and collection of all water-related data.<br />
Methods of identifying and obtaining environmental<br />
data require study and major reform. An idea worth
I<br />
I<br />
I<br />
I j :<br />
I<br />
I<br />
I<br />
I<br />
I<br />
I<br />
i •<br />
I<br />
P I<br />
r Water<br />
Resources 177<br />
Environmental Legislation relating to Water<br />
Name of Legislation Pollution<br />
Thoroughfares Ordinance x<br />
and Act (1861)<br />
Irrigation Ordinance (1900) x<br />
Colombo Muncipal Council<br />
Waterworks Ordinance (1907) x<br />
Crown Lands Ordinance (1947) x<br />
Water Resources Board Act (1964) x<br />
National Water Supply and<br />
Drainage Board Law (1974) x<br />
Sri Lanka Ports AuthorityAct (1977) x<br />
Agrarian Services Act (1979)<br />
National Aquatic Resources and<br />
Development Agency Act (1981) x<br />
Coast Conservation Act (1981) x<br />
Marine Pollution Prevention Act (1981) x<br />
National Heritage and Wilderness Act (1988) x<br />
National Environmental Act(1980)<br />
and Amendment (1988) x<br />
exploring is the establishment of environmental units<br />
within each relevant agency, to provide such information<br />
to a centralized coordinating agency. Research<br />
requirments in the field of water pollution control will<br />
readily emerge from such an exercise.<br />
Surface Water Quality Monitoring and<br />
Control<br />
A surface water quality monitoring network is long<br />
overdue and must be established without delay. Unlike<br />
ground water, still a source of untreated water supply,<br />
surface waters have become heavily polluted and are<br />
secondary sources of untreated water even in village<br />
communities. Declines in surface water quality are<br />
increasingly neglected, perhaps because they reflect<br />
Figure 7.30<br />
Resource<br />
Management<br />
expected trends.But as the developed world has<br />
learned to its peril, most recently in Eastern Europe,<br />
surface water pollution can quickly become an uncontrolled<br />
major health and biological hazard. A network<br />
is essential to ensure that basic human health standards<br />
and ecological processes are maintained as law requires.<br />
Within the framework of such a program,<br />
monitoringof the Colombo city sewage outfalls must<br />
also be undertaken. Only through such monitoring can<br />
changes in coastal water quality be recorded and<br />
remedial action taken.
178<br />
Waste Reduction Technologies<br />
For developing countries in particular, economic<br />
growth and environmental protection require costefefective<br />
waste reduction technologies. Many<br />
countries, including Sri Lanka, have experienced the<br />
adverse economic effects of expensive and complex<br />
References<br />
ArcwgodaM.G(l987). Pollution due to heavy metals in i he Kclaniya<br />
area. Some aspects of the chemistry of the en imminent of Sri<br />
Lanka. Sri Lanka Association for Advancement of Science.<br />
Colombo. 161-167 pp.<br />
Central BankofSri Lanka,Statistics Department ( I''M) Consumer<br />
finance and socio-economic survey l'JKl I -s2 Sn I.anka.<br />
Colombo.<br />
Central Bank of Sri Lanka, Statistics Depart me m i ; ^"i I lonomic<br />
and social statistics of Sri Lanka, vol. X. (.•!..mix. HIK pp.<br />
Central Environmental Authority (1981). Imluvm.il ;>.>iiuiion in<br />
Ratmalana and Moratuwa area • a preliminary •.udi<br />
Central Environmental Authority (1983). Insniun.n.ii<br />
tive framework in the field of environment MI 1<br />
Water Resources<br />
legisla-<br />
Central Environment Authority (1985). Indusirul pollution in the<br />
Kelani River. Colombo. 205 pp.<br />
Central Environmental Authority (1986). Water pollution survey<br />
with an ultra light aircraft. Phase I. Colombo. 77 pp.<br />
Centraj Environmental Authority (1987). Water pollution survey<br />
with an ultra light aircraft. Phase II. Colombo. 4 pp.<br />
Central Environmental Authority (1987). Environmental study of<br />
Nuwara Eliya. Colombo. 88 pp.<br />
Central Environmental Authority (1989). Survey of stationary pollution<br />
sources. Volumes 1 and 2. Colombo.<br />
Dassanayake, N.H.; Perera, R. and De Alwis, P. Water quality of the<br />
Belihul-Oya at Horton Plains. National Aquatic Resources<br />
Agency. 4 pp.<br />
Dassanayake, N.H. et al. : Estuarinc studies-vanutions of some<br />
physical chemical and microbiological parameters in three<br />
selected systems. National Aquatic Resources Agency. 7 pp.<br />
Dassanayake, N.H. et al. Nuwara Eliya Lake preliminary results of<br />
an environmental survey. National Aquatic Resources Agency.<br />
9 pp.<br />
Dissanayake, C.B. ( 1990). Use of gcochemical duiuhunks in monitoring<br />
natural environment-a case study from Sri I -jnku. Environment<br />
International.<br />
Dissanayake, C.B. and Weerasooriya, V.R. (1986). l"he environmental<br />
chemistry of Mahaweli Rjver, Sri Lanka. Intern Journal.<br />
Environmental Studies, 28. pp. 207-223.<br />
Dissanayake, C.B. et al. (1986). Heavy metal pollution of the mid<br />
canal of Kandv; an environmental case study from Sri Lanka.<br />
Environmental Research, 41.12 pp.<br />
Dissanayake, C.B. (1988). Nitrates in the ground »jitrm Sn Lankaimplications<br />
for community health. Journul of the Geological<br />
Society of Sri Lanka, 1. pp. 80-84.<br />
Dissanayake, C.B. (1988). Nitrates in the ground »aicnn Sn Lankaimplications<br />
for community health. Journul of the Geological<br />
Society of Sri Lanka, 1. pp. 80-84.<br />
pollution control equipment that cannot be well maintained<br />
and efficiently used. Small-scale industries with<br />
limited access to speialized skills require appropriate<br />
technological responses that may be unlike those often<br />
employed in developed countries, yet far too little attention<br />
has been given to these particular neds.<br />
Dissanayake, C.B. Environmental geochemistry and its impact on<br />
humans.<br />
Dissanayake, C.B. et al. Heavy metal abundance in the Kandy Lake:<br />
an environmental case study from Sri Lanka. Department of<br />
Geology, University of Peradeniya.<br />
Elvitigala, S. (1983). Bibliography on the environment (Sri Lanka).<br />
Colombo. 88 pp.<br />
Friedrich-Ebert-Stiftung (1988). Use of pesticides and health<br />
hazards in the plantation sector. Colombo. 105 pp.<br />
Friedrich-Ebert-Stiftung (1989). Pesticides in Sri Lanka. Colombo.<br />
255 pp.<br />
Geological Survey Department (1970). Groundwater in Ceylon:<br />
Mineral Information Series, No. I. Colombo.<br />
Gunawardhana, H.D. (1976). Water quality in the Mahaweli Areas.<br />
Presented at the seminar on "Mahaweli after ten years" or-<br />
inised by Sri Lanka Association for Advancement of Science,<br />
ri Lanka<br />
f<br />
Gunawardhana, H.D. (1976). Studies on the Quality of Irrigation<br />
Waters in Kalawewa Area. J. National Science Council Sri<br />
Lanka Area. Vol. 9(2). pp. 121-148.<br />
Gunawardhana, H.D. et al. (1989). Monitoring of water quality in<br />
the Ratmalana-Moratuwa area. Chemistry in Sri Lanka. Vol. 6<br />
(D-<br />
IRDP Office Kachcheri, Moneragala (1989). Environmental Study<br />
Moneragala District. 101 pp<br />
IRDP Office Kachcheri, Ilambantota (1989). Environmental Study<br />
Hambantota District. 106 pp.<br />
Jeyarai, E.E. (1984). Some examples of environmental assessment in<br />
Sri Lanka. Proceedings of seminar on environmental analysis<br />
and assessment: WHO/University of Moratuwa, X-l to X-20.<br />
Kandiah, S. (1981). Grounwater pollution in the north of Sri Lanka:<br />
an analysis. Phyta Vol. 2 (1). pp. 9-12!<br />
Lawrence, A.R.; Chilton, P J.; and Kuruppuarachchi, D.S.P. (1988).<br />
Review of the pollution threat to grounwater in Sri Lanka.<br />
Journal of the Geological Society of Sri Lanka, 1. pp. 85-92.<br />
Middleton, John. T. (1977). Air and water pollution in Sri Lanka:<br />
Report of UNDP Task FOrce on Human Environment. Sri<br />
Lanka.<br />
Motha, S. (1985) . Bibliography on chemical pollution in the Sri<br />
Lanka environment. University of Colombo Department of<br />
Zoology. Colombo. 88 pp.<br />
Mubarak, A.M. (1987). Pesticides and their impact on the environment.<br />
Some aspects of the chemistry of the environment of Sri<br />
Lanka. Sri Lanka Association for Advancement of Science, pp.<br />
89-99.<br />
I<br />
I<br />
I<br />
I<br />
I<br />
I<br />
I<br />
I<br />
I<br />
I<br />
I<br />
I<br />
I<br />
I<br />
I<br />
I<br />
I<br />
I<br />
I<br />
I<br />
I
I<br />
p<br />
I<br />
I i<br />
I<br />
I<br />
I<br />
I<br />
Î<br />
Î<br />
National Aquatic Resources Agency (1985) . ßeira Lake Colombo.<br />
44 pp.<br />
National Building Research Organisation (1989V Effluent monitoring<br />
of major storm water outfalls entering Beira Lake. Colombo.<br />
7 pp.<br />
National Building Research Organisation (1989V Water quality<br />
monitoring data at Ambatale; Environmental Division.<br />
National Building Research Organisation (1989). Water quality<br />
monitoring data, Lunawa Lagoon; Environmental Division.<br />
National Science Council Sri Lanka (1976). Environmental management<br />
in Sri Lanka, Sub-Committee Report. Colombo. 65 pp.<br />
National Water Supply & Drainage Board (1984). Groundwater<br />
investigations for community water supply source in Mannar<br />
Island.<br />
National Water Supply & Drainage Board/WHO (1985). National<br />
workshop in environmental health research at country level Sri<br />
Lanka. An inventory of research and studies on environmental<br />
health at country level.<br />
National Water Supply & Drainage Board (1988). Study of the canal<br />
and drainage system in Colombo, Vol. 1. Executive Summary.<br />
Colomba<br />
National Water Supply & Drainage Board (1988). Study of the canal<br />
and drainage system in Colombo. Vol. 2. Final Report. Colombo.<br />
NORAD/Colombo (1989). Environmental study of Sri Lanka.<br />
Colombo. 207 pp.<br />
People's Bank Research Department. A census on the exploitation<br />
of sand and seashell resources in the coastal zone of Sri Lanka.<br />
Colombo. 87 pp.Picris, N.D. (1984). Water policy adopted by<br />
National Water Supply & Drainage Board for Sri Lanka.<br />
Proceedings of seminar on environmental analysis and assessment.<br />
WHO/University of Moratuwa. V-l to V-5.<br />
Pieries, N.D. (1984). Waterpolicy adopted by National Water Supply<br />
and Drainage Board for Sn Lanka. Proceedings of seminar on<br />
environmental analysis and assessment. WHO/University of<br />
Moratuwa. V-l to v-5<br />
Water Resources 179<br />
Ponnanibalam. M. (1987). Chromimum in the environment - a survey.<br />
Some aspects of the chemistry of the environment of Sri<br />
Lanka. Sri Lanka Association for Advancement of Science, pp<br />
65-78.<br />
Ragava, Rao K.V. ( 1984). Overviewof ground water problems in Sri<br />
Lanka. Proceedings of seminar on environmental analysis and<br />
assessment, WHO/University of Moratuwa. XVIII-1 to<br />
XVIII-10.<br />
Sivabalasundaram (1984). Groundwater pollution and quality.<br />
Proceedings of seminar on environmental analysis and assessment.<br />
WHO/University of Moratuwa. XX-1 to XX-17.<br />
Sri Lanka, Department of Census and Statistics, Ministry of Plan<br />
Implementation (1986). Sri Lanka Census of Population and<br />
Housing - 1981, Colombo District Report, Vol. 1, Part 1.<br />
Colombo. 212 pp.<br />
Tillakaratna, K.A. (1984). Environmental dimensions of ground<br />
water extraction in Sri Lanka. Proceedings of seminar on<br />
environmental analysis and assessment. WHO/University of<br />
Moratuwa. V-l to V-5.<br />
UNEP (1986). Environmental problems of the marine and coastal<br />
area of Sri Lanka: national report. Kenya. 99 pp.<br />
Weerasooriya, S.V.R. et al. f1982). The environmental impact of<br />
nitrate distributions in the lake-effluent canal system in Kandy,<br />
Sri Lanka. Journal of Environmental Management. 15. pp.<br />
239-250.<br />
Wickramasinghe, R.H. (1987). Legal and institutional aspects of<br />
environmental management. Some aspects of the chemistry of<br />
the environment of Sri Lanka. Sri Lanka Association for<br />
Advancement of Science, pp. 179-186.<br />
Wijayadasa, K.H J. and Ailapperuma, W.D. (1986). Survey of environmental<br />
legislation and institutions in the SACEP<br />
countries. Sri Lanka. Central Environmental Authority,<br />
Colombo. 50 pp.<br />
WHO(1982). Rapid assessment of sources of air water and land<br />
pollution. Geneva. 95 pp.
Small gem pits like this one produce gemstones unique in qualrty and variety. Gemstones are the country's<br />
most important mineral resource.<br />
I<br />
I<br />
I<br />
I<br />
I<br />
I<br />
I<br />
I<br />
I<br />
I<br />
I<br />
I<br />
I<br />
I<br />
I<br />
I<br />
I<br />
I<br />
I<br />
I<br />
I
I<br />
I<br />
I<br />
I<br />
I<br />
I<br />
I<br />
I<br />
I<br />
I<br />
IJ<br />
I<br />
I<br />
I<br />
I<br />
I<br />
I<br />
I<br />
I<br />
I<br />
I<br />
8 Mineral Resources<br />
Sri Lanka, for its size, is reasonably well endowed<br />
with mineral resources (Figure 8.1), and mineral exports<br />
account for about S percent of the nation's export<br />
earnings (Figure 8.2). There are abundant gems, sufficient<br />
non-metallic minerals and modest quantities of<br />
metals.<br />
The only fossil fuel consists of 50 million tons of<br />
peat, in the Muthurajawela marsh north of Colombo,<br />
whose low calorific value makes it uneconomic as a fuel.<br />
Exploration for offshore oil deposits beneath the northern<br />
continental shelf since the mid-1970s has, so far,<br />
yielded no promising results.<br />
Many minerals are not presently economical to<br />
mine. These include several nuclear raw materials in<br />
the Ratnapura District and along the southwest coast,<br />
iron ores in Puttalam and near Trincomalee, and copper-magnetite-apatite<br />
at Seruwawila, south of<br />
Trincomalee.<br />
Beach mineral sands in the northeastern, southern,<br />
and southwestern coasts form a major ceramic mineral<br />
resource: these include ilmenite and rutile, used to<br />
extract titanium and in producing light alloys; zircon,<br />
used for ceramics and many alloys; and monazite, a<br />
phosphate containing the nuclear raw material thorium.<br />
Among non-metallic minerals are sizeable deposits<br />
of graphite, clays, mica, phosphate, and limestone.<br />
High quality graphite is still mined from veins in Bogala,<br />
Kahatahaha, and Kolongaha for export, to be used for<br />
such items as pencils, lubricants, electrodes and carbon<br />
rods. Sri Lanka has no significant graphite based industries.<br />
Clays for ceramic, paper, and cement industries<br />
are abundant. A deposit of kaolin (china clay), in<br />
the suburbs of Colombo is estimated at 1 million tons.<br />
Deposits of refined kaolin and ball clay have recently<br />
been discovered with 350,000 and 500,000 metric tons.<br />
Silica sands needed for the glass industry are found in<br />
reserves of about 6 million tons.<br />
GEMSTONES<br />
181<br />
Sri Lanka has been known for over 2^500 years for<br />
gemstones unique in quality and variety, and today they<br />
are the country's most renowned and important mineral<br />
resource (Figure 83). Of the 5 percent mineral<br />
export earnings, 60 percent comes from gemstones<br />
(Figure 82).<br />
Gemstone deposits lie within a geologically narrow<br />
zone (240 by 64 square kilometers). Recent geological<br />
surveys suggest that the potential for gemstones is about<br />
50 percent higher than hitherto expected and many new<br />
gem fields have been located in the central highlands<br />
and southwestern geological formations.<br />
Gem minerals are obtained from eluviaL alluvial<br />
and residual formations. The Sabaragamuwa Province,<br />
with Ratnapura as its leading center, contains approximately<br />
80 percent of the gem mines, but gem potential<br />
is also high in the areas peripheral to its main gem fields.<br />
In their natural state, the gem minerals occur in<br />
thin layers of gravel and sand termed "illam" (Sinhala)<br />
in river beds and alluvial flood plains, as rounded pebbles<br />
and worn fragments. Most gem pits contain several<br />
layers of illam that lie above the underlying<br />
decomposed bed rock termed "Malawa".<br />
Gem Mining<br />
Most gem mining has changed little in Sri Lanka<br />
since it began. The most common method is smallscale<br />
pit mining with lateral tunnelling. Riverbed mining<br />
is also common. Large-scale surface mining, using<br />
mechanized earth moving, was begun, but is not presently<br />
carried out.<br />
Pit mining, by far the most common method, involves<br />
construction of vertical mines as deep as 30<br />
meters, with horizontal tunnels averaging about 10 meters<br />
in length. Gem gravel is removed from the illam<br />
and washed and sorted it in wicker baskets placed in
182<br />
Kocnchikad« H><br />
Gall« CC<br />
Oondra H»oa<br />
Mineral Resources<br />
Mineral Resources<br />
Miocene Limestone O 8eoch Mineral Sonds<br />
Moin Graphite Anas Cloy(8rickfTile,Ceromic)<br />
Gem Bearing Area © Cement Row Mottriol<br />
Crystalline Limestone ® Kaolin<br />
Dolomitlc _<br />
Pearl Banks<br />
Silica Sands<br />
D Mica<br />
H Vtin Quartz<br />
[ceci Corals<br />
Figure 8.1<br />
Ouartzit«<br />
• Fcldspor<br />
9' Copper-Magnetit«<br />
^ Green Marble<br />
M i ntfioço won öo<br />
km.
I<br />
I<br />
I<br />
I<br />
I<br />
i<br />
i<br />
i<br />
•<br />
Year<br />
R«. Million<br />
3OOO -<br />
2600-<br />
2000-<br />
1500-<br />
Mineral Resources 183<br />
Mineral Export<br />
S33 Gems • • Others<br />
Source :- Customs Sri Lanka, Air Lanka<br />
Ltd^ (Central Bank Annual Report 1985,<br />
1988)<br />
1985<br />
1986<br />
1987<br />
1988<br />
Value 1981-1988<br />
% of Total Export Earning<br />
V<br />
1000- jrrw<br />
mÊÈË<br />
600wm<br />
•III 1981 1982 1983 1984<br />
Year<br />
1985 1986 1987<br />
Variety<br />
Blue Sapphire<br />
Star Sapphire<br />
Ruby<br />
Star Ruby<br />
Cat's Eye<br />
Alexandrite<br />
Blue Sapphire<br />
Star Sapphire<br />
Ruby<br />
Star Ruby<br />
Cat's Eye<br />
Alexandrite<br />
Blue Sapphire<br />
Star Sapphire<br />
Ruby<br />
Star Ruby<br />
Cat's Eye<br />
Alexandrite<br />
Blue Sappire<br />
Star Sapphire<br />
Ruby<br />
Star Ruby<br />
Cat's Eye<br />
Alexandrite<br />
Figure 8.2<br />
-Ö- * ol Tot. Exp. Ear<br />
Varieties of Gem Exports<br />
Weight in carats<br />
47,260.71<br />
192,154.74<br />
1,834.15<br />
4,445.76<br />
24,486.83<br />
832.12<br />
53,917.19<br />
249,746.23<br />
1.396.83<br />
3,499.65<br />
28,371.09<br />
624.40<br />
51,191.14<br />
186,781.98<br />
1,617.20<br />
4,349.19<br />
27,978.63<br />
585,2720.00<br />
56,552.30<br />
191.431.19<br />
2,14.19<br />
5,694.23<br />
26.845.32<br />
650.16<br />
Source: State Gem Corporation<br />
Figure 8.3<br />
-4<br />
-3<br />
-2<br />
- 1<br />
1988<br />
Amount in R*.M.<br />
126.0<br />
72.5<br />
5.9<br />
19.8<br />
79.2<br />
14.4<br />
173.2<br />
91.8<br />
9.3<br />
11.2<br />
126.4<br />
19.6<br />
363.3<br />
177.0<br />
18.9<br />
17.4<br />
221.0<br />
419.9<br />
231.7<br />
25.5<br />
36.0<br />
235.4<br />
30.2
184<br />
water. The swirling motion during washing separates<br />
unwanted lighter materials from the heavier gem materials<br />
that are then collected and identified. Mechanical<br />
equipment is largely limited to the pumps required for<br />
removing water that accumulates in the gem pits. Relatively<br />
inexpensive and easily available labor has made<br />
this simple, almost primitive mining method viable for<br />
many decades.<br />
Streambed mining involves the damming of<br />
streams and small rivers by logs, sand bags and other<br />
materials. Workers use long shovels and mamoties to<br />
drag streambed material above the dam, there to separate<br />
out and store the heavy mineral fraction, which<br />
includes gemstones, for later washing and sorting.<br />
Stream banks are also subject to removal.<br />
Mineral Resources<br />
Large-scale mechanized mining was authorized by<br />
the Cabinet in 1985 on 666 hectares of state land in the<br />
Matale district, close to Wasgomuwa National Park and<br />
the Kalu Ganga. The mining plan allowed the lessee to<br />
mine separate blocks of 20 to 30 hectares carried out in<br />
long trenches of 100 meters by 20 meters, reaching a<br />
depth of 5 meters — well above groundwater levels —<br />
with separate removal and stockpiling of topsoil, subsoil,<br />
and gem bearing gravel (illam) layers. Mam would<br />
be mechanically washed with water from new reservoirs<br />
recycled through settling ponds and gems removed by<br />
a final manual sorting. Tailings ~ 60 percent of the<br />
volume of the gravel layer removed for washing - would<br />
then be placed back in the pit, followed by subsoil,<br />
topsoil, contouring and revegetation. Mechanical mining<br />
has evaded controversy over its environmental and<br />
employment impacts and has been carried out on a<br />
limited basis in Sri Lanka.<br />
The Gem Industry<br />
As highlighted by the National Export Development<br />
plan for 1983-1987, gems and jewelry ~ the latter<br />
requiring imported gold or silver — have high potential<br />
for foreign exchange and employment generation.<br />
The State Gem Corporation, established by Parliament<br />
in 1971, regulates gem trade by issuing licences to<br />
miners, gem auctioneers, traders and lapidarists. The<br />
gem trade is largely carried out by the private sector.<br />
Despite great potential for a thriving gem industry,<br />
export stagnation or decline has occurred recently,<br />
primarily due to smuggling and drops in tourism. Approximately<br />
80 percent of the value of gems exported is<br />
not accounted for through official channels. Smuggling<br />
results from several factors: high demand for foreign<br />
exchange, desires to avoid income taxes, and the ease<br />
of transporting small gemstones that might bring a<br />
profit of 500 to 1,000 percent. An added incentive for<br />
gemstone exporters to engage in smuggling is to avoid<br />
cumbersome bureaucratic procedures for legal export.<br />
Emerging Market Trends<br />
The gem industry could benefit from an expanding<br />
market coupled with rising prices. Asia has emerged as<br />
the world's largest and fastest growing market for colored<br />
gemstones, with demand strongest in Japan and<br />
Taiwan. Expanding business in many Asian countries<br />
has prompted many dealers in Europe and the United<br />
States to establish centers in Asia. In 1987 Japan replaced<br />
the United States as the world's largest importer<br />
of colored gemstones. Japan buys at higher prices than<br />
buyers from the U.S-A. or Europe. Taiwan is also<br />
emerging as a leading gem buyer for rare and expensive<br />
stones, and in South Korea, Indonesia and the Philippines<br />
the prices of most colored gemstones have shown<br />
an upward trend.<br />
With its adequate supplies the Sri Lankan gem<br />
industry can benefit from these markets if it can overcome<br />
a number of serious technical and policy problems,<br />
including environmental hazards. There appears<br />
to be a greater demand than supply for good quality<br />
stones, particularly for gemstones such as ruby, emerald,<br />
sapphire, alexandrite,- aquamarine, pink tourmaline<br />
and blue topaz. Recent discoveries of topaz have<br />
opened up further possibilities for the gem industry of<br />
Sri Lanka because the blue topaz market has recovered<br />
from a slump in the mid-1980s caused by a radiation<br />
scare. (Topaz stones receive their brilliant blue color<br />
from radiation treatment, a process not carried out in<br />
Sri Lanka.)<br />
There is a ready market in Japan for high and<br />
medium quality sapphires in all sizes, priced from 300<br />
US dollars per carat, but supplies in Sri Lanka are low.<br />
The supply of fancy (non-blue) sapphires from Sri<br />
I<br />
I<br />
I<br />
I<br />
I<br />
I<br />
I<br />
I<br />
I<br />
I<br />
I<br />
I<br />
I<br />
I<br />
I<br />
I<br />
I<br />
I<br />
I<br />
I<br />
I
I<br />
I<br />
I<br />
i<br />
i<br />
i<br />
i<br />
i<br />
i \<br />
i<br />
i i<br />
i<br />
i<br />
i<br />
i<br />
i<br />
i<br />
1<br />
O)<br />
(2)<br />
(3)<br />
(4)<br />
(5)<br />
(6)<br />
Mineral Resources 185<br />
Estimate of Average Annual Employment in the Gem,<br />
Jewelry & Lapidary Industry (1972-1984)<br />
Licensed miners<br />
Illicit miners<br />
Licensed Gem Dealers<br />
Assistants<br />
Unlicensed Gem Dealers<br />
Licensed Lapidarists<br />
Assistants<br />
Jewelry Manufacturers<br />
mainly connected with the<br />
gem industry<br />
Staff of the Gem Corporation<br />
Lanka has increased, however. Another gemstone<br />
popular in Japan is alexandrite, but finds are rare.<br />
Geuda to Sapphire -<br />
The Addition of Value<br />
If Sri Lanka can add value to its gems, earnings can<br />
rise even without more production. To realize the full<br />
potential of the gem and jewelry sector, the Sri Lanka<br />
Export Development Board has sought to reduce export<br />
of geudas in unprocessed, uncut form.<br />
The term "geuda" refers to stones in the corundum<br />
family - to which sapphires and rubies belong -- that<br />
have a smoky, milky or murky appearance and which<br />
can be heat-treated to improve color and clarity. They<br />
constitute about 30 percent of the stones in the corundum<br />
family, as do the "ottu" and silk yellow sapphires.<br />
Gemologists have observed that heat treatment can<br />
transform some geuda corundums into high quality<br />
blue sapphires, which could dramatically increase mining<br />
yield of exportable stones. Guneratne (1981) has<br />
described the variety most likely to produce good blue<br />
sapphires as those "having a very faint powder blue tint,<br />
Figure 8.4<br />
60,000<br />
40,000<br />
2,250<br />
11,250<br />
30.000<br />
370<br />
2,230<br />
2,000<br />
500<br />
Total<br />
100,000<br />
13,500<br />
30,000<br />
2,600<br />
2,000<br />
500<br />
148,600<br />
display a milky white sheen and when held against a<br />
light source give the colour of clear thin honey."<br />
The science of heat treatment of these geuda<br />
stones and high value addition has been mastered by<br />
Thais who buy them in Sri Lanka in massive quantities<br />
to be sent to Thailand for heat treatment. Implementation<br />
of the Thai-Sri Lanka Geuda Agreement in 1987<br />
sought to regulate the geuda trade. During its first year<br />
the agreement brought in 18 million US dollars, which<br />
proved to be substantial, when compared to the earnings<br />
from gem export. However, in spite of the seemingly<br />
positive trends in the geuda export, smuggling<br />
continued and the better quality stones appeared to be<br />
illegally channelled out. Geuda trade undoubtedly<br />
helped Thailand to become the 'Gem Centre of the<br />
World' particularly in the blue sapphire market, and Sri<br />
Lankan geuda stones contributed enormously. Hence<br />
the Government decided in mid-1990 to terminate the<br />
Thai Geuda Trade Agreement and plans to establish a<br />
Gem Research Institute, entrusted with the task of<br />
carrying out research in the successful local conversion<br />
of the geuda to sapphire.
186<br />
20<br />
16-<br />
10-<br />
Mineral Resources<br />
Annual Soil Extraction from Average Mine (Cubic Meters)<br />
Karavita Oalatura<br />
30<br />
Kara vita Paradia*<br />
Illegal Mln*a<br />
A=l-28B=28-56 C=56-84 D = 84+ E = Unable to Estimate<br />
Source : Field Study, Ratnapura District 1985/1986 (Jayanthi de Silva • 1987)<br />
Environmental Impacts<br />
Along with its relatively high economic return and<br />
social benefits, gem mining can cause environmental<br />
damage, depending on the type and location of the<br />
mine. Surface, pit, and stream-bed mining involve<br />
different types and amounts of waste gravel, water use,<br />
and reclamation costs.<br />
Large numbers of mines, contribute to the environmental<br />
problem of gem mining. The State Gem Corporation<br />
issues about 3,400 gemming licences each<br />
year, allowing each licence holder to dig from two to<br />
four gem pits at a time. Approximately 10,000-15,000<br />
gem pits operate legally in the Island; an equal number<br />
are illegal. Traditional gem pits are worked by six<br />
persons so approximately 60,000-90,000 persons are<br />
engaged in gem mining. Adding the illegal mines, the<br />
total number of people directly involved in gem mining<br />
is about 135,000. Figure 8.4 gives an estimate of the<br />
employment in the gem industry.<br />
A detailed study of the environmental impact of<br />
gem mining in the Ratnapura District, the main gem<br />
producing region of Sri Lanka, has revealed useful<br />
information on mining impacts and controls. Gem mining<br />
is one of the chief contributors to soil erosion and<br />
Figure 8.5<br />
sedimentation in the Ratnapura District. Among the<br />
interrelated factors are:<br />
• stream bank mining,<br />
• removal of vegetation cover for gemming,<br />
• the process of washing gem Ulam in water bodies<br />
where clay and silt particles are added to rivers,<br />
streams or canals.<br />
• deposit of sediments in rivers, streams and canals<br />
when mine waters are discharged from working<br />
mines, and<br />
• erosion of soils from unstable soil heaps (mine<br />
spoils) that are accumulated around gem pits.<br />
Estimates have been made and the quantities of<br />
soil extracted from an average gem mine in the<br />
Ratnapura District (Figure 8.5). Each mine in Karavita<br />
unearths over 56 cubic meters of soil annually. Nearly<br />
half the legal miners -- and probably most or all of the<br />
estimated 60 percent of local miners operating illegally<br />
~ leave most of their soils as heaps around the mines<br />
(Figure 8.6). Rain and floodwater carry this sand, silt<br />
and clay to nearby streams, rivers, low-lying areas, or<br />
paddy fields, causing sedimentation. Discharge of<br />
water pumped from mines adds to these impacts (Fig-<br />
I<br />
I<br />
I<br />
I<br />
I<br />
I<br />
I<br />
I<br />
I<br />
I<br />
I<br />
I<br />
I<br />
I<br />
I<br />
I<br />
I<br />
I<br />
I<br />
I<br />
I
I<br />
I<br />
Ï Mineral<br />
n<br />
Resources 187<br />
The Proportion of Excavated Soils that Remain as Soil Heaps Around Gem Pits<br />
20<br />
15<br />
10-<br />
5-<br />
15-<br />
10-<br />
No. of Minn<br />
C<br />
KaraviU<br />
• • £ • • •<br />
0 | iïl<br />
0<br />
=<br />
=<br />
=<br />
c<br />
r Paradis«<br />
Legal Mines<br />
B<br />
CO<br />
1 1 t=<br />
Galatura<br />
E<br />
15-<br />
10<br />
No. of Minn<br />
KuniU Paradis«<br />
Illegal Mines<br />
A =1-25 B =26-50 C = 51 - 75 D = 76 -100 E = River Bed/River<br />
Source : Reid Study Ratnapura District 1985/1986 (Jayanthi de Silva -1987)<br />
No. of Minn<br />
A = Directly To River<br />
D = Along Paddy Reids<br />
Figure 8.6<br />
Methods Adopted to Discharge Waters in Gem Pits<br />
Paradin<br />
Legal Mines<br />
8 = via Canal<br />
E = To Und<br />
No. of Minn<br />
20-<br />
IS-<br />
10-<br />
nKaraoiU<br />
G = River Bed Mines<br />
Source : Reid Study Ratnapura District 1985/1986 (Jayanthi de Silva • 1987)<br />
Figure 8.7<br />
Paradin<br />
Illegal Mines<br />
C = Via Drain<br />
F = To Gem Pit<br />
Calatura
188<br />
ure 8.7). The field study highlighted a number of adverse<br />
environmental effects caused by soil erosion and<br />
sedimentation during gem-mining:<br />
• deposit of sediments in streams and canals,<br />
• adverse effects on aquatic life,<br />
• deposit of sediments in fish-spawning grounds,<br />
• raising of stream beds that reduces the capacity of<br />
rivers to absorb flood waters,<br />
• reduction of irrigation efficiency in canal systems,<br />
and<br />
• water pollution.<br />
Despite the unfortunate lack of comprehensive<br />
data on these environmental and economic effects, field<br />
observations testify to the environmental degradation<br />
caused by erosion and sedimentation from past and<br />
existing mines. It is clearly visible in muddy streams,<br />
eroded banks and increased flooding.<br />
A highly visible environmental effect is the change<br />
of the landforms. Vast areas are pockmarked with craters,<br />
often filled with turbid water and collapsed and<br />
subsided terrain. Stream banks have caved in due to<br />
the construction of horizontal tunnels. Mine filling is<br />
virtually never done properly. As a result land subsidence<br />
and water pools occur in areas nearly 300 meters<br />
in diameter. Stream banks in some instances have been<br />
expanded laterally by as much 38 meters. The extent<br />
and impact of these changes on land productivity need<br />
more precise measures to assess preventive and remedial<br />
action.<br />
There is circumstantial evidence that gem mining<br />
has contributed to a resurgence of malaria in Sri<br />
Lanka. Abandoned gem pits that form stagnant pools<br />
of water are breeding grounds for the mosquito.<br />
Quantitative data on the problem are still lacking, but<br />
resurgence of malaria in the main gem mining areas of<br />
Elahera and Ratnapura does not appear coincidental.<br />
Regulation and Controls<br />
Prevention and control of these environmental impacts<br />
suffer from many impediments. Environmental<br />
regulations for the large number of legal mines are<br />
Mineral Resources<br />
inadequate and, in any event, unenforced. The State<br />
Gem Corporation's law enforcement staff of approximately<br />
25 is clearly inadequate to enforce permit and<br />
bonding requirements. So is the level of public understanding<br />
of the problem by local residents, miners and<br />
officials, despite the fact that the locality itself incurs<br />
the costs of environmental degradation.<br />
No less important is the proliferation of illegal,<br />
unpermitted, gem miners. Illicit mining continues despite<br />
enforcement provision, and there appears to be<br />
no sign of abatement. Among the major reasons for<br />
illicit gem mining are:<br />
• Licence fees of 750 rupees per pit and 1,000 rupees<br />
for each additional pit. The fee for a pit in a rice<br />
field is :L500 rupees.<br />
• The need to share profits among participants, including<br />
the land owner, water pump owner, license<br />
owner. A miner very often receives about 5 percent<br />
or less from the total earnings of the pit. Illicit<br />
miners avoid many of these payments, along with<br />
environmental fines.<br />
Among the measures that could bring about an<br />
effective and acceptable balance between gem mining<br />
and sustainable environmental management are conservation<br />
techniques to restore depleted gemming<br />
lands, incorporation of environmental factors into<br />
plans and permits for gem mining, continuous monitoring<br />
of compliance and of environmental conditions,<br />
and educating the local residents to the needs and<br />
benefits of environmental protection.<br />
The best planning and management will fail where<br />
mining is illegal, so incentives to operate illegal mines<br />
must be removed or reduced. In other countries these<br />
kinds of abuses have been addressed through streamlined<br />
permit procedures, economic bonuses for legal<br />
mines, controls over corruption, community education,<br />
and high-level involvement in enforcement. Careful<br />
analyses may be necessary to assess the problem of<br />
illegal mining, and what can practically eliminate or<br />
reduce it.<br />
Unlike traditional pit mines, large-scale open pit<br />
mining by heavy machinery disturbs large areas, but<br />
adverse impacts on soils and water can be minimized<br />
I<br />
I<br />
I<br />
I<br />
I<br />
I<br />
I<br />
I<br />
I<br />
I<br />
I<br />
I<br />
I<br />
I<br />
I<br />
I<br />
1<br />
I<br />
I<br />
I<br />
I
m<br />
o<br />
4<br />
2<br />
0<br />
Thousand MT<br />
!<br />
I<br />
1fLU<br />
1979<br />
tl<br />
1<br />
%LU<br />
19B0<br />
Mineral Resources 189<br />
Graphite Production & Sales<br />
•<br />
4* 1 f 1LJ1 Ji<br />
1981 1982Ji Ji 1983 1984<br />
1986<br />
1985<br />
YEAR<br />
• PROOUCTION S SALES<br />
Source : State Mining and Mineral Development Corporation<br />
Thousand MT<br />
30<br />
25<br />
Source :<br />
Figure 8.8<br />
Phosphate Production & Sales<br />
i<br />
J<br />
. 1987<br />
j<br />
1<br />
i i 10<br />
-i i-i i i 1Ji<br />
5%Ji<br />
-iLU 0 LU LU Ji Ji<br />
1980 1981 1982 1983 1984 1985 1986iJl19871LU 1988<br />
YEAR<br />
• PROOUCTION E3 SALES<br />
State Mining and Development Corporation<br />
Figure 8.9<br />
1988<br />
M I
190<br />
through careful planning, monitoring, and implementation.<br />
At the outset, new access roads must be constructed<br />
to prevent erosion and minimize destruction<br />
of vegetation. Mining operators must control overburden<br />
disposal and drainage to arrest soil erosion and<br />
sedimentation, and ensure that water and settling<br />
ponds minimize surface and ground water pollution<br />
and water habitat for malaria-transmitting mosquitos.<br />
Reclamation requires precise replacement of overburden<br />
layers to reduce, if not prevent, future subsidence.<br />
To facilitate adequate moisture content for tree rooting,<br />
replaced subsoil must be carefully segregated from<br />
the gravel layer. Even after the surface is properly<br />
contoured it may remain, or become, uneven and unsuited<br />
to agriculture. Revegetation requires fast-growing<br />
cover crops and tree species, monitored and cared<br />
for to assure success. Long-term rehabilitation for<br />
wildlife or other uses may also become important.<br />
Mechanized gem mining allows substantially more<br />
efficient exploitation of gems and potentially more effective<br />
enforcement of environmental requirements<br />
than traditional gem pits. On the other hand, its social<br />
impact can be more significant because it employs far<br />
fewer people and has been perceived as threatening<br />
gem miners' future employment.<br />
SAND MINING<br />
Sand that comes down in rivers is necessary to<br />
maintain coastal beaches. When a section of the beach<br />
loses sand by littoral drift and other phenomena, this<br />
loss is made good by sand transported by rivers. Hence<br />
if sand mining from the bed of the Kelani and other<br />
rivers exceeds their annual deposit, coastal beaches will<br />
not receive their necessary replenishment. It has been<br />
estimated that the total quantity of sand coming down<br />
the Kelani annually may be around 1.4 million tons,<br />
while a 1984 survey estimated the annual sand extraction<br />
at 916,000 tons.<br />
Environmental impacts<br />
Uncontrolled mining of river sand often leads to<br />
the collapse of river banks. Large-scale sand mining in<br />
the Badulla District has eroded-river banks and affected<br />
the stability of bridges. In coastal areas the<br />
deepening of the riverbed below mean sea level creates<br />
Minerat Resources<br />
conditions for an influx of salt water. In the case of the<br />
Kelani river, this salt water wedge may even reach the<br />
intake of the Colombo city water supply at Ambatale.<br />
A National Sand Study with Netherlands assistance has<br />
been proposed to ascertain the amount of sand which<br />
can be safely extracted annually, with minimal environmental<br />
impacts, covering river systems of Kalu Ganga,<br />
Kelani Ganga, Maha Oya and relevant adjacent coasts.<br />
GRAPHITE<br />
Sri Lanka has also been renowned for its graphite<br />
- the world's major source of high quality microcrystalline<br />
carbon material. The purity of Sri Lanka graphite<br />
is unparalleled at over 99 percent. The occurrence of<br />
graphite as massive veins occupying natural fissures in<br />
rocks allows relatively easy mining. Nearly 6,000 shallow<br />
pits and small mines operated during the two World<br />
Wars, and about half that number operate today, scattered<br />
throughout the country, particularly in the central<br />
and southwestern regions. The State Mining and Mineral<br />
Development Corporation (SMMDC), which<br />
controls the graphite mining industry of Sri Lanka, now<br />
depends on two main underground mines at Bogala and<br />
Kahatagaha.<br />
Graphite mining has existed for about 165 years<br />
and was once perceived as of equal importance to tea,<br />
rubber, coconut and other exports. During the last few<br />
decades, graphite exports declined and since 1983 it has<br />
dropped to sixth place among Sri Lanka's exports.<br />
Graphite exports peaked during the two World Wars<br />
at 14,000 metric tons in 1916 and 28,000 metric tons in<br />
1942, but in the last eight years production has averaged<br />
about 7,000 metric tons In 1982 traditional buyers of<br />
Sri Lankan graphite switched to other sources causing<br />
heavy losses, particularly in 1984. With the subsequent<br />
reduction in graphite prices, demand increased and<br />
net profits increased marginally.<br />
Graphite production of a mine depends heavily on<br />
the width of the vein encountered in mining. Lack of<br />
proper equipment needed for this purpose results in<br />
poor prediction of vein width and subsequent drop in<br />
production. A major reason for low production of<br />
graphite in 1988 (Figure 8.8) was the destructive subversive<br />
activities in the months of November and December.<br />
I<br />
I<br />
I<br />
I<br />
I<br />
I<br />
I<br />
I<br />
I<br />
I<br />
I<br />
I<br />
I<br />
I<br />
I<br />
I<br />
I<br />
I<br />
I i<br />
I
I<br />
I<br />
Î .<br />
j I<br />
!<br />
I<br />
I<br />
I<br />
I<br />
I<br />
I<br />
I<br />
I<br />
I<br />
Year<br />
1984<br />
1985<br />
1986<br />
1987<br />
1988<br />
1984<br />
1985<br />
1986<br />
1987<br />
1988<br />
1984<br />
1985<br />
1986<br />
1987<br />
1988<br />
Mineral Resources 191<br />
MINERAL SANDS PRODUCTION (MT) 1984 TO 1988<br />
Ilmenite<br />
97,040<br />
114,954<br />
129,907<br />
128,490<br />
74305<br />
Rutile<br />
6,467<br />
8,605<br />
8,443<br />
7,238<br />
5,255<br />
Zircon<br />
3,708<br />
4,061<br />
910<br />
Monazite HITI Ilmenite<br />
147<br />
80<br />
18<br />
MINERAL SANDS EXPORTS (MT) 1984 TO 1988<br />
130,957<br />
147,666<br />
95,298<br />
106,722<br />
91,879<br />
MINERAL SANDS EXPORTS VALUE (Rs.'OOO)<br />
52,686<br />
86,911<br />
102,098<br />
146,627<br />
145,783<br />
5,008<br />
7,734<br />
3,966<br />
3,938<br />
3,702<br />
No production of zircon and monazite from March 1986 due to lack of fresh water<br />
Source<br />
4,612<br />
8374<br />
7,249<br />
13,759<br />
34,038<br />
73,076<br />
75,531<br />
147,353<br />
3,329<br />
4,548<br />
34(Bags)<br />
: l,700(Bags)<br />
6,827<br />
10,921<br />
471<br />
10,255<br />
: State Mineral Sands Corporation and Ministry of Industries<br />
Despite high purity levels, Sri Lanka's graphite<br />
production activity is limited to sorting, grinding and<br />
screening to different particle sizes. Production of articles<br />
of value such as crucibles, carbon brushes or<br />
colloidal graphite have failed due to inadequate technical<br />
competence and lack of suitable markets.<br />
ROCK PHOSPHATE<br />
Sri Lanka imports its required fertilizers at a cost<br />
of about 40 million US dollars annually. Fifteen to<br />
Figure 8.10<br />
606<br />
397<br />
2,492<br />
1,691<br />
17,625<br />
5,207<br />
20,511<br />
9,103<br />
twenty percent are phosphates — rock phosphate and<br />
super phosphate. In 1986 26,000 metric tons of rock<br />
phosphate and 55,700 metric tons of triple super phosphate<br />
were imported. Local production of rock phosphate<br />
was 15,000 metric tons in 1986.<br />
Sri Lanka discovered a major phosphate reserve at<br />
Eppawala (see Figure 8.1) in 1971 with a firm reserve<br />
of 30 million tons of high quality phosphate rock (average<br />
of 38 percent ?2 Os) and inferred reserves of 60<br />
million tons. Figure 8.9 illustrates the production and
192<br />
1200<br />
Metric Tons<br />
Mineral Resources<br />
Production of Mineral & Mineral<br />
Products in The Cement Industry<br />
1984 1988<br />
Limestone<br />
Source : Sri Lanka Cernent Corporation<br />
sales. Despite the high potential of the phosphate deposit,<br />
optimum use has still not been obtained, mainly<br />
due to the lack of technical know-how and machinery<br />
to convert it to soluble phosphate that plants can absorb.<br />
Chemical research is now underway in Sri Lanka<br />
to address this need. Analyses of environmental impacts<br />
of phosphate mining and processing will need to<br />
proceed in conjunction with any development plan.<br />
CERAMICS<br />
The ceramic industry is the country's largest industrial<br />
concern dependent on local mineral raw materials.<br />
Ceramic raw materials include quartz, feldspar, limestone,<br />
dolomite red or ferruginous clay, zircon, ball<br />
clay, kaolin and graphite, and they are available in<br />
amounts adequate to meet ceramic requirements over<br />
the next two or three decades.<br />
Sri Lanka has an old ceramic industry where the<br />
earliest products were unglassed items made from<br />
plastic clays, such as bricks, tiles, crude earthenware<br />
Dry Clay Packed Cernent<br />
Figure 8.11<br />
and ornaments. The state-owned Ceylon Ceramics<br />
Corporation mines and processes kaolinite and operates<br />
refineries at Boralesgamuwa near Colombo, and<br />
Mitiyagoda (Galle District). The Corporation also includes<br />
four subsidiary companies: Lanka Porcelain<br />
Limited (producing 1400 tons of porcelain tableware<br />
per year for export), Lanka Wall Tiles (Pvt) Ltd and<br />
Lanka Tiles Ltd. (15,000 tons and 10,000 tons for export)<br />
and Lanka Refectories (Pvt) Ltd (1,500 tons).<br />
The Ceylon Ceramics Corporation also has one ball<br />
clay plant, one lime plant, a quartz-feldspar mine, nine<br />
tile factories (25 million tiles per annum) one ornamentalware<br />
unit and two ceramic factories (earthenware<br />
-- 3,700 to 4,000 tons (crockery); -electroporcelain<br />
~ 350 tons; and sanitaryware — 1,300<br />
tons per annum). A modern Ceramic Research and<br />
Development Centre (CRDC) has also been established<br />
by the Corporation with UNIDO assistance<br />
(Herath, 1988).<br />
A cottage industry provides much of the country's<br />
brick and roofing tile needs. About 100 small units<br />
I<br />
I<br />
I<br />
I<br />
I<br />
I<br />
I<br />
I<br />
I<br />
I<br />
I<br />
I<br />
I<br />
I<br />
I<br />
I<br />
I<br />
I<br />
I<br />
I
I<br />
I n<br />
i<br />
t<br />
i iI<br />
i i<br />
i f !<br />
I<br />
I<br />
i<br />
I<br />
ft<br />
c •••<br />
I<br />
I •<br />
i i<br />
I<br />
r<br />
produce 80 million tiles per year. Over 85 percent of<br />
Sri Lanka's brick requirement is produced by 2,000<br />
units scattered throughout the country.<br />
The state supports the cottage ceramic industry by<br />
the establishment of pottery centers, and incentives for<br />
the export of ceramicware and manufacture of ornamentalware<br />
in the Free Trade Zone. The public<br />
sector ceramic industry records revenue of around 700<br />
million rupees compared to private sector revenue of<br />
around 500 million rupees per annum. To realize further<br />
development the ceramic industry will require<br />
remedial measures. These include:<br />
• Detailed geological survey aimed at locating raw<br />
material,<br />
• Reliable estimates of individual deposits,<br />
• Further research into the nature, quality, properties<br />
and feature uses of these mineral materials,<br />
• Proper analysis of marketing aspects,<br />
• Analysis of environmental impacts of all aspects of<br />
the ceramic industry and,<br />
• Development of practical operating, monitoring<br />
and enforcement measures to ensure environmental<br />
management.<br />
MINERAL SANDS<br />
The beaches of Sri Lanka are rich in sands containing<br />
minerals such as ilmenite, rutile, monazite and zircon.<br />
At Pulmoddai, 77 kilometers north of<br />
Trincomalee, a beach place deposit along about 8 kilometers<br />
of the coast contains about 6 million tons of raw<br />
mineral sands containing 70-72 percent ilmenite, 8-10<br />
percent zircon, 8 percent rutile, 03 percent monazite<br />
and 1 percent sillimanite. Among several other concentrations<br />
of mineral sands scattered along various<br />
beaches in the country, the most significant are at<br />
Kailawela, Polkotuwa and Kudremalai point. Large<br />
mineral sand deposits may exist south of Trincomalee<br />
and off the shores of Beruwala, where a large deposit<br />
of monazite has been discovered by NARA.<br />
The production and export figures of the Ceylon<br />
Mineral Sands Corporation, which is responsible for<br />
Mineral Resources 193<br />
the exploitation of mineral sands, are shown in Figure<br />
8.10. Lack of a constant supply of fresh water has<br />
hampered production, particularly in 1986.<br />
Despite these valuable mineral sands Sri Lanka has<br />
no extraction industries that use them. Ilmenite contains<br />
50-60 percent of the oxide of titanium, and rutile<br />
has nearly 95 percent, but this material is exported in<br />
its raw state mainly to Japan and Europe.<br />
Environmental Impacts<br />
Although we have no comprehensive assessment<br />
of environmental impacts of sand mining, coastal erosion<br />
is one danger. A 27-meter shoreline recession was<br />
noted during operations of the Mineral Sands Corporation<br />
at the large extraction site at Kokilai in the<br />
mid-1970s (Second Interim Report of the Land Commission).<br />
CEMENT<br />
Sri Lanka has seen considerable growth in many<br />
new development programs. To meet high demand for<br />
cement the Ceylon Cement Corporation has two major<br />
cement factories, at Kankesanthurai in the north, and<br />
at Puttalam on the west coast. The two plants manufacture<br />
about 600,000 metric tons of portland cement per<br />
year using the dry process. A grinding plant at Galle<br />
uses limestone derived from Kankesanthurai or imported<br />
material. A joint venture between a local private<br />
firm and a Japanese company has developed a<br />
cement complex for exports at China Bay, Trincomalee.<br />
After additional facilities are installed at<br />
Kankesanthurai, cement production should reach 1<br />
million metric tons.<br />
Limestone resources are available in the Jaffna<br />
Peninsula and in a belt stretching to Puttalam, Southwest<br />
Aruwakalu, and the Dutch Bay region. Inland<br />
coral limestone, suitable for cement manufacture exists<br />
in the southern coastal areas that could, if properly<br />
managed and reclaimed, support the Galle cement<br />
plant. No living coral is needed and none is permitted<br />
to be used. Figure 8.11 shows the production OJ mineral<br />
and mineral products in the cement industry.
194<br />
Environmental Impacts<br />
At the Puttalam cement factory, environmental<br />
degradation occurs during mining of limestone and<br />
processing of cement. Significant air pollution has resulted<br />
from poor maintenance of the installed electrostatic<br />
precipitators, which were out of order for many<br />
years. Discharge of large quantities of dust into the<br />
surroundings has caused poor crop yields in nearby<br />
coconut plantations and damage to other trees and<br />
plants from the settling of dust on the leaves.<br />
FUTURE MINERAL PROSPECTS<br />
The discovery of a copper-magnetite deposit at<br />
Seruwila in the Tnncomalee area, the first base metal<br />
find in Sri Lanka, has opened up a new area for exploration.<br />
Location of these base metal ores between two<br />
major lithological zones — the Highland Series and<br />
References<br />
Bangkok Gems and Jewellery (1989) : 2. pp. 53-64.<br />
Clark, G. (1983). Sri Lanka's industrial minerals • much potential to<br />
be realised. Industrial Minerals. Oct. pp. 61-71.<br />
De Silva, J. (1987) The environmental impact of gem mining in the<br />
Ratnapura District. Report submitted to the Central Environmental<br />
Authority of Sri Lanka. 66 pp.<br />
Economic Review (1977). Publication of the Research Department<br />
of the People's Bank of Sri Lanka. Vol. 3, No. 6. pp. 1-33.<br />
Economic Review (1984). Publication of the Research Department<br />
of the People's Bank of Sri Lanka. Vol.10, No. 1. pp. 1-33.<br />
Economic Review (1988). Publication of the Research Department<br />
of the People's Bank of Sri Lanka. Vol. 14, No. 6. pp. 1-34.<br />
Guneratne, H.S. (1981). Geuda sapphires • their colouring elements<br />
and their reactions to heat. j. Gemmol., 13. pp. 58-61.<br />
Herath. J.W. (1986): Mineral based industries of Sri Lanka. Science<br />
Education Series No. IS. Natural Resources, Energy and Science<br />
Authority of Sri Lanka. 87 pp.<br />
Herath. J.W. (1988). Ceramics in Sri Lanka. Bull. Ceramic Res. and<br />
Dev. Centre, 1. pp. 1-27.<br />
Jewellery News Asia (1989). No. 57.<br />
Mineral Resources<br />
Eastern Vijayan Complex -- indicates that this boundary<br />
is a potential target area for further base metal<br />
investigations. There are also promising indications of<br />
uranium mineralization in certain areas. With the extension<br />
of maritime boundaries following the Law of<br />
the Sea convention Sri Lanka now has a vast offshore<br />
territory that can be explored for high mineral potential.<br />
Mining and quarrying contribute 3.5 percent of the<br />
GDP and account for one-tenth of total employment<br />
and one-seventh of export earnings. Lack of technology<br />
and expertise has retarded development and efficient<br />
use of valuable mineral resources, including<br />
phosphate, salt, ceramic, cement, graphite and mineral<br />
sands. Political stability, a favorable economic climate,<br />
and integrated environmental planning at every step of<br />
the way, can, however, open new possibilities for mineral<br />
development.<br />
Munasinghe, T. and Dissanayake, CB. (1980). Is the Highlandeastern<br />
Vijayan boundary in Sri Lanka a possible<br />
mineralised belt? Econ. Geol. pp.1495-1496.<br />
Sri Lanka Export Development Board, National Export Development<br />
Plan 1983-1987. Vols. 1 and 2.<br />
Sri Lanka, Ministry of Industries and Scientific Affairs. Review of<br />
Activities 1987-1988. 152 pp.<br />
Sri Lanka, Ministry of Mahaweli Development (1988). Mechanised<br />
gem mining in System F of the Mahaweli Accelerated Development<br />
Programme: Environmental impact study. 54 pp.<br />
Sri Lanka (1989). Second Interim Reoport of the Land Commission<br />
198S, Sessional Paper No. II - December 1989. Dept. of Government<br />
Printing, Colombo.<br />
Sri Lanka, Sub Committee of the Parliamentary Consultative Committee<br />
on Finance and Planning (1985). Report on the<br />
viabilityof the State Gem Corporation being run as a business<br />
venture and the viability of liberalising the gem industry.<br />
State Miningand Mineral Development Corporation (1988). Performance<br />
Report 1980-1987.<br />
Waidyanatha, W.G.B. (1988). The socio-economic impact of the<br />
geuda trade and the Thai-Lanka Geuda Agreement. J. Gem.<br />
Assoc Sri Lanka, 5. pp. 12-24.<br />
I<br />
I<br />
I<br />
I<br />
I<br />
I<br />
I<br />
I<br />
I<br />
I<br />
I<br />
I<br />
I<br />
I<br />
I<br />
I<br />
I<br />
I<br />
I<br />
I<br />
I
I<br />
1<br />
I i<br />
Mineral Resources
This pinus is among tens of thousands of hectares of forest plantations.<br />
I<br />
I<br />
I<br />
I<br />
I<br />
I<br />
I<br />
I<br />
I<br />
I<br />
I<br />
I<br />
I<br />
I<br />
I<br />
I<br />
I<br />
I<br />
I<br />
I
I<br />
9 Forest Resources<br />
Sri Lanka was once a land of rich tropical forests,<br />
nurtured by abundant radiation, high temperatures and<br />
rainfall, and long growth periods. In pre-colonial times<br />
these ecosystems provided local people with most of<br />
their daily needs. Over the last century much of this<br />
heritage has been destroyed, along with many of its<br />
material benefits. Rich forest diversity was, we now<br />
know, highly vulnerable to misuse. Deforestation has<br />
now seriously diminished timber supplies, made soils<br />
less productive, water supply more erratic, and floods<br />
more frequent and severe. Management of what is left,<br />
and reestablishment of new forests, will require concerted<br />
planning and strong political will. These actions<br />
depend on broad public understanding of the benefits<br />
of reforested watersheds, mixed farmland forests, village<br />
groves, shelterbelts, and sustainable natural forest<br />
ecosystems.<br />
Forest Cover Today<br />
Climate, the main determinant of forest distribution,<br />
does not preclude the presence of forest in any<br />
part of this island. Except in a few locations limited by<br />
soil factors, the entire land area of Sri Lanka was once<br />
covered with forests. Conditions today are very different.<br />
Along the coastal fringe, tidal mud flats had mangrove<br />
forests much more extensive than today's. Until<br />
the early part of this century the higher sandy soils also<br />
had strips of littoral woodlands, but these have now<br />
almost completely disappeared.<br />
The wet southwestern region and the central highlands<br />
have the most luxuriant plant cover. The lowland<br />
area, up to an elevation of about 900 meters (m) has a<br />
climax vegetation of Tropical Rain Forests, where the<br />
crowns of dominant trees form a closed canopy at 25 m<br />
to 30 m with émergents rising to about 45 m. These<br />
forests have a relatively sparse undergrowth but are rich<br />
in epiphytes and lianas. They gradually give way<br />
through Sub-Montane Forests, at 900 m to 1350 m, to<br />
197<br />
Wet Evergreen Montane Forests at the higher elevations.<br />
The latter have a lower canopy and a denser<br />
undergrowth. Their stems are often covered with lichens,<br />
bryophytes and other epiphytic plants.<br />
The transition zone between the Wet Zone and Dry<br />
Zone ~ the seasonally dry northern and eastern plains<br />
- has Tropical Semi-evergreen Forests with their own<br />
characteristic species as well as some common to the<br />
adjacent zones.<br />
The major part of the Dry Zone has Tropical Dry<br />
Mixed Evergreen Forests. In these the dominant species<br />
now present often do not form a closed canopy and<br />
seldom exceed 20 m in height. The extreme southeastern<br />
and northwestern regions of the island, which have<br />
very long dry periods, are covered with Tropical Thorn<br />
Forests with low trees and an undergrowth mostly of<br />
thorny shrubs.<br />
In the Dry Zone intensive felling and a form of<br />
shifting cultivation locally called chena cultivation has<br />
badly degraded the forests. During fallow periods secondary<br />
successions lead to the development of scrub or<br />
low jungle, but where successions are prevented by<br />
frequent clearing or burning the result is formation of<br />
damanas, savannah with fire resistant trees, or talawas<br />
and some diypatanas, which are dominated by coarse<br />
grasses.<br />
Some edaphically determined natural grasslands<br />
are also present in the island. These are the villus on<br />
seasonally submerged depressions in the Dry Zone, and<br />
the welpatanas in certain boggy highland areas.<br />
Plantation forests in Sri Lanka consist mostly of<br />
even-aged monocultures of teak, eucalyptus or pine. A<br />
few mixed plantations of broad-leaved tree species,<br />
such as jak and mahogany, have also been established.
198<br />
80<br />
60 -<br />
40 r<br />
20<br />
ft of Land Natural Foraat<br />
1860<br />
•<br />
1880<br />
<strong>NATURAL</strong> FORESTS<br />
Forest Resources<br />
Natural Forest Cover in Sri Lanka<br />
\<br />
1900<br />
During Sri Lanka's hydraulic civilization beginning<br />
more than 2,000 years ago, agricultural development in<br />
the Dry Zone required transformation of natural ecosystems<br />
to agro-ecosystems. Wetlands in valleys and<br />
flood plains became rice fields, and clearings on high<br />
ground became multilayered home gardens. From<br />
about A.D. 1200, invasions from India and the spread<br />
of malaria, among other causes, forced population<br />
shifts to the central highlands, where similar village<br />
settlements were established, in the valleys and lower<br />
slopes of the hills. Forest cover on the ridges, upper<br />
slopes, and hilltops remained undisturbed.<br />
During the time of the British colonial government<br />
shifting cultivation and forest exploitation for timber<br />
supply sharply increased. By 1881, the forest cover was<br />
estimated at 84 percent of the land area, and in 1900,<br />
70 percent.<br />
The first comprehensive forest survey of the country<br />
was conducted after Independence in 1956-1961.<br />
The survey found that the total area of forest was 2.9<br />
million hectares, or 44 percent of the land area. Even<br />
then over-exploitation had so spread that as much as 42<br />
percent of all natural forests were classified as non-productive.<br />
In 1982-1985 the FAO carried out a second<br />
inventory to obtain data for the Forestry Master Plan.<br />
Year<br />
1966<br />
— % of Natural Forest<br />
Figure 9.1<br />
^ .<br />
1983 1990<br />
According to this inventory Sri Lanka's forest cover was<br />
1.76 million hectares and the area of scrubland was<br />
625,000 hectares. The aggregate figure of 2.385 million<br />
hectares, or 36 percent of the land area, is often cited<br />
as the area of forest land. However, this figure includes<br />
scrub that consists mainly of early secondary growth<br />
after deforestation, and hence these areas cannot<br />
rightly be classified as forest. The aerial photographs<br />
on which the FAO survey was based were taken in 1983.<br />
Assuming that deforestation has occurred at the rate of<br />
30,000 hectares per year since then, the 1989 estimate<br />
of forest area should be 1.58 million hectares, or 24<br />
percent of the land area as natural forest (see Figure<br />
9.1).<br />
In addition to high forest and scrub, chena cultiva- •<br />
tion occupies a large area, mostly in the once forested<br />
parts of the Dry Zone. As the population expanded,<br />
more high forest came under shifting cultivation with<br />
shorter rotations. In 1956 the total area exposed to<br />
shifting cultivation was one million hectares, or 15 percent<br />
of the country's land area. Since then chena areas<br />
have been absorbed into permanent agriculture or otherwise<br />
developed, while more forests have been cleared<br />
for chena. At present, shifting cultivation covers about<br />
1.2 million hectares, or about 18 percent of the country,<br />
forest 24 percent, and scrub 9.2 percent of the country.<br />
Figure 9.2 gives more information on the natural forests,<br />
based on the 1982-1985 forest inventory.<br />
I<br />
I<br />
I<br />
I<br />
I<br />
I<br />
I<br />
I<br />
I<br />
I<br />
I<br />
I<br />
I<br />
I<br />
I<br />
I<br />
I<br />
I<br />
I<br />
I
Forest<br />
Resources 199<br />
The Natural Highforest Area of Sri Lanka -1983 Position<br />
I. All-island<br />
[ | Dry a Arid ronts<br />
ll-lgg&l Wet, Iniermediote ft Montan« zones<br />
3. Dry a arid zones<br />
2. All-island<br />
1. Zonal Distribution 2. Controlling Agency<br />
3 . & 4. Forests As A Percentage Of The Land Area.<br />
Figure 9.2.<br />
| [ Forest Deportment •<br />
K:jïA|"J wild Lite Conservation<br />
VIVKVI 11 oepariment<br />
| | Non tore«!<br />
jgggjj Forest<br />
4. Wet.intermediate Ö montane zones
200<br />
Total Dry<br />
Forest Resources<br />
Dry Zone Natural Forest Yield<br />
Data From 1956 - 1961 Inventory<br />
Low Yield ^^•^'^'^^r77ZP777>>^<br />
\ : : • • : • • : • : : :<br />
V//X/Jä^^^L Medium Yield 6.1%<br />
i :<br />
NiiiiiijF<br />
Nonproductive 434%<br />
Zone Natural Forests - 2,507,926 ha.<br />
Figure 9.3a<br />
Dry Zone Natural Forest Standing Volume<br />
Data From 1956 - 1961 Inventory<br />
Volume of Trees (m 3 /ha)<br />
80 i<br />
60<br />
40<br />
20<br />
Medium /ieio Low vieio<br />
Category<br />
Nonproductive<br />
Vol. Trees 10cm Diam Y//A Vol. Trees 30cm Diam<br />
Figure 9.3b
Forest<br />
Forest Ownership<br />
3-5-<br />
as<br />
Over 95 percent of Sri Lanka's forests have been<br />
state-owned since British times. Following the Forest<br />
Ordinance of 1885 some forests were proclaimed Reserves.<br />
Because of time-consuming legal and administrative<br />
procedures for establishing reserve forests,<br />
several more areas were set apart as Proposed Reserves,<br />
also under jurisdiction of the Forest Department.<br />
Village Forests were placed under the district<br />
Government Agents, and other Crown Forests were at<br />
various times transferred from the Forest Department<br />
to Government Agents and vice versa.<br />
In addition to these categories, National Reserves<br />
and Sanctuaries were established for protection of<br />
wildlife. There are five types of national reserves:<br />
Strict Natural Reserves, National Parks, Nature Reserves,<br />
Jungle Corridors, and Intermediate Zones (the<br />
last mentioned not to be confused with the climatic<br />
zone of the same name). These areas, categorized<br />
according to degree of protection or location, all come<br />
within the jurisdiction of the Department of Wild Life<br />
Conservation.<br />
The Forest Department must protect forest reserves<br />
and proposed reserves under provisions of the<br />
Forest Ordinance. As clearing of forests continued,<br />
illicitly and under state land settlement and agricultural<br />
Resources 201<br />
Past Position & Probable Future Scenario of the Dry Zone<br />
A-Medium-ylald<br />
8-Low-yi«ld<br />
C- Non-productiv«<br />
I9OO Ywr 2020<br />
Figure 9.4<br />
schemes, however, the Forest Department has given up<br />
large areas. Deforestation from 1956 to 1983 averaged<br />
41,500 hectares per year, largely due to shifting cultivation.<br />
Since 1970 the Forest Department has established<br />
40 biosphere reserves within the reserve forests or proposed<br />
reserves. They vary from 10 to 55,000 hectares<br />
and total 120,000 hectares. This program began as an<br />
activity under IUCN's International Biological Programme<br />
and later continued under UNESCO's Man<br />
and Biosphere Programme. Biosphere reserves have<br />
only administrative status, but the Forest Department<br />
accepted the proposal to designate selected areas<br />
within the forest reserves as biosphere reserves to help<br />
protect some natural forests from forest exploitation<br />
and clearing.<br />
In the natural forests of the Dry Zone, under the<br />
Forestry Master Plan deforestation and exploitation for<br />
timber supply will continue everywhere except in the<br />
"protected areas" under the Department of Wild Life<br />
Conservation and the biosphere reserves under the<br />
Forest Department. These areas total around 600,000<br />
hectares. However, even within these areas encroachment<br />
and illicit felling continue.
202<br />
300<br />
250 -<br />
Low Yield 46%<br />
Forest Resources<br />
Wet Zone Natural Forest Yields<br />
Data From 1956 - 1961 Inventory<br />
Medium Yield 20.9%<br />
Total Wet :_c.-9 Natural Forests » 227,850 ha.<br />
Figure 9.5a<br />
High Yield 5.2%<br />
Nonproductive 28%<br />
Wet Zone Natural Forest Standing Volume<br />
Data From 1956 - 1961 Inventory<br />
Volume of Trees (m 3 /ha)<br />
High Yield Medium Yield Low Yield Nonproductive<br />
Category<br />
HH Vol. Trees 10cm Diam Y//A Vol. Trees 30cm Diam<br />
Figure 9.5b
I<br />
r<br />
ri<br />
Forest Resources 203<br />
Mean Annual Increment of some Forest Plantation Species<br />
&of Natural Forest<br />
13<br />
12<br />
n<br />
IO<br />
a<br />
I<br />
A - Taafc In dry zon«<br />
B - Dry ion« natural torvst<br />
C - Plnm eorlbo«o k» v—t xorta<br />
D - W«t zon« natural forwt<br />
E - Eucolyptu» mtcrocory»< mouton« «on«)<br />
F - Mahogany ( jntarnwoaat«son«)<br />
Figure 9.6<br />
Expected Yields of Industrial Wood from Existing Forest Plantations<br />
Figure 9.7
204<br />
2500<br />
Forest Resources<br />
Availability & Demand of Industrial Logs<br />
(in 000 m per Year)<br />
1986-90<br />
Nat. Forest<br />
Rubber & Palmyrah<br />
1991-95 1996-2000 2001-2010<br />
Year<br />
Existing Plant<br />
Demand<br />
In the Wet Zone (low country, mid-country and<br />
montane region) the forest is estimated at 278,000<br />
hectares. In the low and mid-country and in the<br />
Mahaweli catchment the area of forest is now down to<br />
approximately 8 percent of the land area. Because of<br />
the unfavorable forest-to-land ratio in the Wet Zone,<br />
no forest alienation would be permitted under the Forestry<br />
Master Plan. However, selective felling is<br />
planned in the high yield forests at middle and low<br />
elevations.<br />
Timber Yields from Natural Forests<br />
In terms of potential industrial wood yield Sri<br />
Lanka has two main types of natural forest. Most extensive<br />
is the Dry Zone mixed evergreen forest, or<br />
Monsoon Forest. The second, far less large, is the Wet<br />
Zone evergreen forest, or Tropical Rainforest.<br />
'Dry Zone ' - Historical Trends<br />
The dry mixed evergreen forest is the typical natural<br />
vegetation of the Dry Zone which accounts for<br />
Figure 9.8<br />
Non-forest<br />
Other<br />
2011-20<br />
three-fifths of the land area of the country. Among the<br />
trees in this forest are several species of hardwoods<br />
which produce timber of the highest quality. These<br />
include Oxloroxylon swieteniaJE: satin; S: burutha),<br />
Berrya cordifolia (E: Trincomalee wood; S: halmilla),<br />
Manilkara hexandra (S: palu) and Diospyros ebenum<br />
(E: ebony). As a result of highly selective exploitation<br />
over the years these prime species, which were once<br />
plentiful, are now very rare.<br />
Large scale timber harvesting has gone on in the<br />
Dry Zone since the early 1800s. At first it consisted of<br />
selective felling of large trees of the prime species, and<br />
some of this timber was exported to Britain. Government<br />
officers were responsible for the control of timber<br />
cuts, but historical records indicate widespread illicit<br />
timbering even then.<br />
Timber export continued until it gradually tailed<br />
off after the 1960s but exploitation for local demands<br />
increased. With rapidly rising demand many previously<br />
untouched species became exploited, along with trees<br />
well below the silviculturally desirable size. Illicit felling<br />
I<br />
I<br />
I<br />
I<br />
I<br />
I<br />
I<br />
I<br />
I<br />
I<br />
I
I<br />
I H<br />
I<br />
I | "<br />
I<br />
I<br />
i<br />
t :<br />
i<br />
i<br />
continued unabated through the 1970s along with selective<br />
exploitation of natural forests by contractors engaged<br />
by the Forest Department and later by the State<br />
Timber Corporation. So did widespread clearing of<br />
Dry Zone forests for shifting cultivation (chena). In the<br />
early 1980s large areas of Dry Zone forests were<br />
opened up under land development, particularly for the<br />
Mahaweli program. Yet deforestation trends were<br />
such that these forests were likely to have rapidly disappeared<br />
even without that program.<br />
The forest inventory carried out in 1956-1961 identified<br />
23 million hectares of natural forests in the Dry<br />
Zone (including the arid regions). They fell into one of<br />
three recognized timber yield classes: medium, low,<br />
and non-productive. No high yield natural forests existed<br />
in the Dry Zone. Figure 9.3 gives data from this<br />
inventory.<br />
Two important points are not reflected in Figure<br />
93. First, at the time of the inventory, only 35-40 pej<br />
cent of the standing volume was in species normally<br />
suitable for industrial wood. Drypetes sepiaria (S:<br />
Wira), the most widespread tree species in the Dry<br />
Zone, has a poorly formed trunk only suitable as fuel<br />
and accounted for 25 percent of the standing volume.<br />
Second, nearly all the Dry Zone species used for industrial<br />
wood are slow to grow. As a result the annual<br />
increment of utilizable wood was found to be very low.<br />
The 1956-1961 inventory states that the Forest Department<br />
estimated the annual increment to be as low as 0.2<br />
cubic meters per hectare.<br />
The next major forest inventory was carried out by<br />
the FAO in 1982-1985. (Five complete districts and<br />
parts of two others in the north of the country were<br />
unable to be covered by field sampling, so data from<br />
the rest of the Dry Zone were extrapolated to these<br />
areas.) Significant highlights of this inventory:<br />
• The loss of forest cover in the Dry Zone since 1956<br />
averaged 38,100 hectares per year.<br />
• No medium yield-forests were identified in the Dry<br />
Zone (see Figure 9.3). Medium-yield forests existing<br />
in 1956 had been so exploited as to move them<br />
to the low-yield or nonproductive category. Some<br />
medium-yield forests may have been cleared altogether.<br />
Forest Resources 205<br />
• Average standing volume per hectare of trees of all<br />
species over 30 cm diameter at breast height (dbh)<br />
increased nearly 50 percent (from 26.1 to 38.8 cubic<br />
meters) in the low-yield forests, and by nearly 140<br />
percent (from 7.9 to 19.1 cubic meters) in the<br />
non-productive forests.<br />
The yield data represent the average for all the<br />
forests in each yield class. It is not possible to draw<br />
precise conclusions regarding the increase in standing<br />
volume because in the interim period many forests,<br />
owing to exploitation and clearing, moved from their<br />
original yield class to a lower category, and some forests<br />
were cleared altogether. Nevertheless, because increases<br />
also occurred in Wet Zone forests, there was<br />
apparently a net accretion of wood in some of the<br />
forests. Hence, even in lowest quality forests, recovery<br />
is apparently possible under the right conditions and<br />
where soils are conserved, even after heavy exploitation.<br />
Dry 2k>ne' - Future Trends<br />
The Forestry Master Plan (FMP) deals with the<br />
Dry Zone natural forests on the basis of likely deforestation<br />
rates in the next few decades. Leaving out the<br />
areas under the Department of Wild Life Conservation<br />
designated as protection forests, it presents two alternative<br />
scenarios:<br />
(a) deforestation continuing at 30,000 hectares per<br />
year until 2020, when all Dry Zone forests outside the<br />
protection areas would be cleared, and (b) deforestation<br />
curtailed to 10,000 hectares per year.<br />
The Plan estimates the volume of wood that would<br />
become available in the two cases. It proposes that<br />
forests should be cleared for timber at either one rate<br />
or the other in order to pre-empt clearing by illicit<br />
fellers. Supplies are also expected to come from what<br />
is called "selective felling" in the areas still remaining in<br />
forest. Surprisingly, in each scenario the yield forecast<br />
of industrial wood from 1986-2020 is identical. Under<br />
either rate, in two to three decades all Dry Zone natural<br />
forests outside the protection areas, comprising nearly<br />
all Dry Zone forests now under the Forest Department<br />
(900,000 hectares), will be totally exploited and degraded<br />
to scrubland (see Figure 9.4).
206<br />
A more efficient, environmentally sustainable policy<br />
alternative exists for managing Dry Zone forests,<br />
however. The FAO inventory of 1982-1985, from which<br />
the Master Plan draws its data, states that deforestation<br />
is likely to decrease after completion of clearings under<br />
the Mahaweli development scheme. It provides evidence<br />
of significant increases in standing volume in the<br />
low yield and nonproductive forests in the period following<br />
the earlier inventory. It recommends that adequate<br />
areas of over-cut natural Dry Zone forests be set<br />
apart for recovery. As a result, if these forests are<br />
adequately protected — a critical management problem<br />
- they can enhance ecological stability in the Dry Zone,<br />
and, several decades from now, provide indigenous Dry<br />
Zone timbers on a sustained yield basis.<br />
'Wet Zone? - Historical Trends<br />
Natural forests of the Wet Zone typically have a<br />
much higher standing volume than Dry Zone forests.<br />
Untilthe 1940s many species remained unharvested,<br />
but thereafter, with Dipterocarpus zeylanicus (S:hora)<br />
accepted for production of railway sleepers (or ties),<br />
and with light hardwoods required for veneer, many<br />
new Wet Zone species entered the market.<br />
Figure 9.5 gives some data on the natural forests of<br />
the Wet Zone according to the 1956-1961 inventory.<br />
For several reasons, data on natural forests of the<br />
Wet Zone (including the wet montane zone) in the<br />
FAO inventory of 1982-1985 are difficult to collate with<br />
those of the earlier inventory. For example, the "montane<br />
forests" of the earlier inventory comprise a relatively<br />
small area of stunted forests found at the highest<br />
elevations, while the upcountry region of the later inventory<br />
appears to have a much lower elevation limit.<br />
Again, the intermediate zone forests are separated<br />
from the Wet Zone forests in the earlier inventory, but<br />
combined in the subsequent inventory. However, taking<br />
the Wet Zone, montane zone and the intermediate<br />
zone together, the later inventory indicates a loss of<br />
forest cover of 3,400 hectares per year since 1956.<br />
Wet Zone' - Future Trends<br />
The 1982-1985 inventory concludes that total forest<br />
area in the wet and intermediate zones (including the<br />
wet montane region) comprises 278,000 hectares of<br />
Forest Resources<br />
which 120,000 hectares lies in the low and midcountry<br />
and 158,000 hectares in the upcountry. Of the total<br />
area, the Forestry Master Plan apportioned 159,000<br />
hectares for protection and 119,000 hectares for timber<br />
supply. The 119,000 hectares are further divided into<br />
47,500 hectares with adequate stocking for sustained<br />
yield management, 37,500 hectares with poor stocking<br />
where no selective cutting is recommended in the near<br />
term, and 34,000 hectares where the stocking is so low<br />
that no cuttings should occur until the year 2020.<br />
The Wet Zone low and mid-country natural forests<br />
(120,000 hectares) represent ecosystems with high levels<br />
of biodiversity and endemism. These forests have<br />
been subjected to heavy overcutting and consequent<br />
degradation, and there are now strong appeals from<br />
scientists, NGOs and the informed public to set aside<br />
for conservation a good part of the 47,500 hectares<br />
earmarked for selective felling. "Selective felling" has<br />
itself often meant heavy overcutting in accessible forests.<br />
The total area of well-stocked and sparselystocked<br />
Wet Zone forests taken together, may, according<br />
to some experts, total only 35,000 hectares - just<br />
over 40 percent of the Master Plan estimates (85,000<br />
hectares). If further analysis supports this conclusion,<br />
the Plan's proposals for felling will need revision.<br />
Well-stocked forests are estimated to yield' 28<br />
cubic meters per hectare of industrial wood and 55-117<br />
cubic meters fuelwood. Each year the Plan proposes<br />
to harvest 1,580 hectares or a thirtieth of the wellstocked<br />
area -- that is, a 30-year felling cycle. Intermediate<br />
felling, halfway through the felling cycle, is also<br />
proposed. The question remains: Can these levels of<br />
exploitation sustain good quality Wet Zone natural<br />
forest, or will the remaining forest be lost to future<br />
generations?<br />
Given widespread concern about exploitation of<br />
Wet Zone natural forests in the low and mid elevations,<br />
the Government has decided to re-examine the management<br />
plans as related to the preservation of biological<br />
diversity, conservation of soil and water, and the<br />
environmental impact of proposed felling rates and<br />
intensity.<br />
I<br />
I<br />
I<br />
I<br />
I<br />
I<br />
I<br />
I<br />
I<br />
I<br />
I<br />
I<br />
I<br />
I<br />
I<br />
I<br />
I<br />
I<br />
I<br />
I
Forest Resources 207<br />
Forest Plantations for Shelter<br />
Afforestation in the Uva Basin shows how forestry can improve environmental and<br />
social conditions. The Uva Basin lies in tha central highlands at an average elevation of<br />
about 1,200 meters bounded on the south and west by the mountainous central massif<br />
that rises to 2,400 meters. In the north and eastfthe Basin slopes down to the lowland<br />
plains of the Dry Zone. Near the cêateçoÙherËasiaus th&town of Welimada. . ,'<br />
The Uva Basin comprises undulating country devoid of natural forests except in<br />
small, sheltered pockets. Dry montane grasslands, drypatanas, cover much of the area<br />
where no tea has been planted. When the island comes under the influence of the<br />
southwest monsoon, from May to August, rain falls oh the western slopes of the central<br />
hills, leaving the now-rainless monsoon winds, to sweep across the Uva Basin. These<br />
desiccating winds frequently reach gale force, and the harsh conditions have made much<br />
of the area desolate and uninhabited.<br />
Afforestation of the patanas began in the late 1930s. Eucalyptus grandis; E.<br />
microcorys and E. robusta were raised in compact blocks on the crests of ridges and<br />
hilltops. When successful the plantations served as windbreaks and greatly improved<br />
living conditions. Hamlets soon sprang up nearby.<br />
Encouraged by these results, in 1954 the Forest Department selected two severely<br />
windswept, desolate areas, PaJugama and Harasbadde, to raise shelter belts. Palugama<br />
produced spectacular results. Its gently undulating land was hospitable to shelter belts<br />
planted in a lattice pattern — primary belts (20 meters wide) at right angles to the wind<br />
direction, and secondary belts (10 meters) at right angles to the primary belts. Distance<br />
between the shelter belts in both directions was 115 meters. Belts consisted of an outer<br />
TOW of Acacia mollissima, followed by alternate rows ofEucalyptus grandis and Cupressus<br />
macrocarpa. Although the Cupressus remained stunted, the other two species grew well,<br />
and the belts acquired a pyramidal shape in profile.<br />
Within five years the shelter belts began to ameliorate windy conditions. Within ten<br />
years, after more growth and continued improvement in the environment, population of<br />
the area began to grow. The name of the village, Palugama, meaning 'desolate village'<br />
was no longer considered apt and it was changed to Keppetipola, after a famous Sinhala<br />
Chiefl
208<br />
FOREST PLANTATIONS<br />
Historical Development<br />
Reforestation in Sri Lanka has a long, important<br />
history. The government of Ceylon perceived that the<br />
exploitation of natural forests could frustrate sustained<br />
production of timber a century ago. This prompted the<br />
forest officers at the time to raise forest plantations,<br />
although at first on a very limited scale. Teak (Tectona<br />
grandis) an exotic species to Sri Lanka, was perhaps the<br />
first species to be raised as a forest plantation. This was<br />
done at different sites, mainly in the Dry Zone. Another<br />
exotic species, Swietenia macrophylla, the broadleaf<br />
mahogany, was also planted towards the end of the<br />
last century in the intermediate zone lowlands around<br />
Kurunegala. From then until the 1950s plantation trials<br />
were carried out with numerous species, and those that<br />
showed promise were planted on a management scale.<br />
Most trials were carried out in the montane zone to<br />
meet fuelwood demand of households, the tea industry<br />
and the railway. Eucalyptus species received the greatest<br />
attention. Although originally raised to produce<br />
fuelwood, the wood of some eucalyptus species was<br />
later found suitable for industrial use. In the 1950s<br />
eucalyptus species were introduced to the lowlands of<br />
the Wet and Dry Zones.<br />
In the early forestation activities in the montane<br />
zone, besides the various species of eucalyptus, other<br />
exotic hardwood species like Cedrella spp. Tristania<br />
conferta. Acacia melanoxylon and Acacia mollissima<br />
were planted. Several softwood species were also tried<br />
and, of these, Pinus panda, P. caribaea and Cupressus<br />
macrocarpa were extended to management scale planting.<br />
In the 1960s Pinus trials reached the lowlands, and<br />
in the 1970s appropriate varieties of Pinus caribaea<br />
began to be planted extensively in the low and midcountry<br />
Wet Zone and the montane intermediate zone.<br />
Meanwhile, from the late 1950s onwards, extensive<br />
planting with teak in particular was carried out annually<br />
in the Dry Zone. Forestation in the Dry Zone was<br />
carried out under the Co-operative Reforestation<br />
Scheme, the counterpart to the Burmese Taungya system.<br />
It came to an end in the late 1970s (See Box ).<br />
Recently, in the Wet and Dry Zone lowlands,<br />
planting trials with several hitherto untested species<br />
Forest Resources<br />
have been carried out, and two species of Acacia that<br />
yielded good results are now included in the forestation<br />
program.imbcr and Fuelwood Production<br />
Timber and Fuelwood Production<br />
Dry Zone natural forests are poorly stocked and<br />
most of the valuable species grow slowly. Until recently,<br />
forestation favored teak. Although the teak<br />
plantations fall into the lower classes of the Indian yield<br />
tables, its growth has been outstanding in relative terms;<br />
the average Mean Annual Increment (MAI) exceeded<br />
that of the industrial wood species in Dry Zone natural<br />
forests by 30 times (see Figure 9.6).<br />
The natural forest of the Wet Zone has a MAI<br />
higher than its Dry Zone counterpart. Notwithstanding<br />
this, and despite the fact that the species is raised only<br />
in impoverished sites of the Wet Zone, Pinus caribaea<br />
has an average MAI almost 15 times that of the usable<br />
species in the natural forest.<br />
The Forestry Master Plan concludes that the total<br />
area of productive plantation forests (1982-1985 inventory)<br />
is 97,650 hectares. Of this, 77,000 hectares consists<br />
of industrial wood plantations, comprising teak<br />
(54.4 percent), Pinus (24.1 percent), industrial wood<br />
species of eucalyptus (11.4 percent), and others (10.1<br />
percent). Expected yields from these plantations up to<br />
the year 2015 are shown in Figure 9.7.<br />
Although the Forest Department regularly conducts<br />
forestation it often neglects silvicultural operations<br />
needed to reach maximum levels of productivity.<br />
Thinnings, especially early non-commercial thinnings,<br />
rarely occur. As a result the expected increment rates<br />
(Figure 9.6) will not be realized. The proposed investment<br />
program in the forestry sector has been designed<br />
to correct the understaffing and lack of adequate financial<br />
resources that largely cause this situation.<br />
The Forestry Master Plan recommends forestation<br />
(with industrial wood species) at 2,130 hectares per<br />
year to 1995, and 4,260 hectares per year thereafter.<br />
Because plantations will be the main source of industrial<br />
wood in the future, this rate of forestation may not<br />
build adequate wood reserves for the next century.<br />
More important than increasing the area under forest-<br />
I<br />
I<br />
I<br />
I<br />
I<br />
I<br />
I<br />
I<br />
I<br />
I<br />
I<br />
I<br />
I<br />
I<br />
I<br />
I<br />
I<br />
I<br />
I<br />
I<br />
I
!<br />
i<br />
H<br />
P<br />
ation, however, are regular, dependable silvicultural<br />
operations.<br />
To meet future fuelwood deficits, the Forestry<br />
Master Plan recommends raising block fuelwood plantations<br />
(2,700 hectares per year) and farmers' woodlots<br />
(progressively increased from 700 hectares to 4,500<br />
hectares per year). Block fuelwood plantations are to<br />
be raised by the industries requiring the fuel. In addition,<br />
the Forest Department could also raise fuelwood<br />
plantations in areas where deficits arc likely. This will<br />
be necessary, for example, where farmers' woodlot<br />
schemes fall behind schedule.<br />
Ecological Considerations<br />
Many ecologists and environmentalists object to<br />
raising monoculture plantations especially of non-indigenous<br />
species. Ecologically, a mixture of species is<br />
preferable to monoculture. The resulting diversity has<br />
substantial long term benefits. Yet forest plantations<br />
must meet basic needs for industrial wood and fuel,<br />
while providing adequate safeguards for conserving soil<br />
and water.<br />
Forestation requires cost effectiveness. The suitability<br />
of a species to a site, the quality of the wood it<br />
produces, the establishment costs, and the wood increment<br />
rate must all be considered. Plantations produce<br />
several times more timber than natural forests and are<br />
often the only way to relieve pressure to exploit natural<br />
forests. Sri Lanka has raised tens of thousands of hectares<br />
of forest plantations, and reduced hundreds of<br />
thousands of hectares of natural forests to scrub<br />
through deforestation and overexploitation. Objections<br />
to forest plantations of exotics must recognize how<br />
plantations can help conserve natural forests.<br />
Pinus caribaea, a cause of much controversy, is<br />
planted in degraded Wet Zone sites of grass and scrub.<br />
It has succeeded after years of failed afforestation trials<br />
with other species. Pinus caribaea has shown phenomenal<br />
rates of growth. With proper management and<br />
supported by silvicultural trials it should be possible to<br />
interplant with broad leaf species when the pine is<br />
thinned.<br />
Yet there is an urgent need to strengthen research<br />
on the biology and silviculture of indigenous species in<br />
Forest Resources 209<br />
order to identify the endemics, as well as exotics, that<br />
are ecologically preferable to species now used in forestation.<br />
The volume of research now conducted is far<br />
from adequate but until more ecologically acceptable<br />
species are found, forestation programs must continue<br />
with the species now in use.<br />
TIMBER AND FUELWOOD<br />
DEMAND AND SUPPLY<br />
Industrial Wood - Past Trends<br />
Industrial wood is used in Sri Lanka primarily for<br />
building construction, packaging, railway sleepers,<br />
telegraph and electricity poles, furniture, and matches.<br />
Newsprint and wood pulp for writing paper are largely<br />
imported.<br />
Although nearly all the forests are state owned,<br />
industrial wood from state forests provides only a fraction<br />
of what is supplied and consumed within the country.<br />
The 1956-1961 forest inventory estimated that the<br />
country consumed 855,000 cubic meters of timber and<br />
fuelwood. In 1985, consumption of industrial wood was<br />
estimated at 980,000 cubic meters, with 960,000 cubic<br />
meters supplied locally and the balance imported. Of<br />
the local total, natural forests supplied about 44 percent<br />
and forest plantations about 8 percent with the balance<br />
from rubber wood, coconut, palmyrah wood, and miscellaneous<br />
other non-forest species (see Figure 9.8).<br />
Industrial Wood - Future Trends<br />
Forecasts of industrial wood demand and availability<br />
for the next 20 years (Figure 9.4) suggest an annual<br />
surplus if timber from rubber, coconut, and palmyrah<br />
are included. Small quantities of these species are now<br />
used for timber but further research and development<br />
is required to improve the quality of the wood and the<br />
technology of use. In the light of declines in coconut<br />
and rubber plantations over the past four decades,<br />
pricing and other policies will be necessary to promote<br />
use of these species.<br />
If harvests in the natural forests of the Dry and Wet<br />
Zones are reduced by conservation programs seeking<br />
sustained yields, what can be done to ensure adequate<br />
supply of timber? One option for compensation is to
210<br />
Forest Resources<br />
The Forestry Development Program<br />
When the Forestry Master Plan was released in 1986 ecologists and non-governmental scientific and<br />
environmental organizations soon criticized its proposal for continued exploitation of remaining natural<br />
forests. Over-exploitation had been so severe, they argued, that of the remaining 1.2 million hectares of<br />
natural forests managed by the Forest Department, only 47,500 hectares existed in the Wet Zone. The<br />
Dry Zone had no areas where stocking was sufficiently high to allow sustained timber production.<br />
In response the Forest Department created an Environmental Division, invited forestry consultants<br />
to re-examine the fellingproposals, and commissioned studies on the biodiversity of the Wet Zone natural<br />
forests. Pending the outcome of these studies (still in progress as of October 1990), the Department<br />
suspended all forest felling. Similar studies are proposed for natural forests in the Dry Zone, where natural<br />
areas may be set apart as permanent reserves under long-term management.<br />
Under the forestry development program for the next five years (mid-1990 to 1995) the Forest<br />
Department plans systematic thinning of 60,000 hectares of plantations and to raise new plantations of<br />
industrial wood and fuelwood species. A special reforestation program will address the erodible upland<br />
areas in the Mahaweli catchment, where the forest cover is down to 8 percent of the land area, funded by<br />
British ODA. The development program will emphasize tree planting through a Participatory Forestry<br />
Project to develop silvi-pastoral and agroforestry systems mainly for the large, areas of deforested, unused<br />
land in the Dry Zone. '<br />
To remedy the serious lack of skilled manpower the Forest Department will substantially increase<br />
recruitment of forest officers and accelerate training. It will also strengthen research units in the Forest<br />
Department and the State Timber Corporation. Support for the forestry development program is<br />
expected through aid grants and loans from the World Bank, British ODA, FINNIDA, UNDP, and ADB.<br />
Assuming sustained political will, generous inputs from the government, and supplement financial,<br />
support from foreign agencies, by the end of the five-year period the forestry sector should be able to carry<br />
out sustainable forest management that conserves Sri Lanka's natural forests for future generations.<br />
increase the use of non-forest species. Other measures<br />
include greater economy in the- use of timber and substitution<br />
of other materials wherever possible. Recently,<br />
for example, the government decided to use<br />
concrete instead of wood for railway sleepers; once<br />
implemented this will significantly reduce industrial<br />
wood demand.' Likewise, wood could be totally replaced<br />
by concrete for electricity and telegraph poles.<br />
The National Engineering Research and Development<br />
Centre has demonstrated that a low-cost house can be<br />
constructed without the use of timber. Technological<br />
improvements in sawmiDing could reduce the huge<br />
waste that now occurs when converting logs into sawn<br />
timber. To make a difference, these and other measures<br />
will need to be adopted quickly. Greater emphasis<br />
will also be necessary on raising forest plantations of<br />
industrial wood species and silvicultural'operations in<br />
the plantations that increase yields.<br />
Fuelwood - Past Trends<br />
Biomass fuel is the source of heat for most house-<br />
hold cooking in Sri Lanka, and the vast majority of rural<br />
households gather this fuel themselves. From surveys<br />
we know that only about 25 percent comes from the high<br />
forest. We also know that the slow, steady trend in the<br />
1950s and 1960s from fuelwood to commercial energy<br />
(mainly kerosene) for domestic cooking was reversed<br />
in the late 1970s in response to the fuel crisis. (For<br />
details of consumption, sources, etc, see Chapter 5.)
Forest<br />
Fuelwood - Future Trends<br />
The proportion of biomass fuel coming from high<br />
forest is, in future, likely to increase. Fuelwood will<br />
continue to be available over much of the Dry Zone<br />
area for several years to come, owing to the presence of<br />
large areas of degraded forest. However, in the large<br />
settlement areas of the Dry Zone, shortages have already<br />
occurred. Transport of fuelwood over long distances<br />
will make costs prohibitive. The proposal to<br />
raise farmers' wood lots for fuelwood, poles, utility<br />
timber and so forth, as recommended in the Forestry<br />
Master Plan, would help solve this problem. So would<br />
action of the Forest Department to raise fuelwood<br />
plantations in strategic areas to provide supplies to<br />
sales outlets in the towns.<br />
Biomass fuel supplies could also drop in the Wet<br />
Zone. If, as expected, more rubber wood is diverted for<br />
use as sawlogs, supplies of fuelwood from this source<br />
will drop, and scarcity will develop in Colombo and the<br />
other southwest coastal towns. In addition, any reduction<br />
in the cutting area, or cutting rates, in Wet Zone<br />
natural forests will also produce lower fuelwood yields<br />
than forecast in the Master Plan. Increased planting of<br />
fuelwood species, use of improved fuelwood cookers,<br />
transport of fuelwood from surplus areas, and use of<br />
alternative fuels are possible responses. (For further<br />
information on biomass fuel, refer to Chapter 5.)<br />
KEY ISSUES<br />
Severe deforestation and degradation of natural<br />
forests have afflicted Sri Lanka for decades. Because<br />
natural forests originally covered most of the island,<br />
virtually any development invariably causes some forest<br />
clearing, but deforestation has been far more extensive<br />
than development has required, and much of the clearing<br />
has been illicit. Over the past four decades, deforestation<br />
has slashed natural forests by 50 percent.<br />
Forest degradation, while often less obvious, has<br />
relentlessly followed exploitation to meet growing demands<br />
for industrial wood. Nearly all the natural forest<br />
that remains is non-productive or low in yield. And as<br />
with clearing, forest degradation has often been illegal.<br />
Why have these trends developed?<br />
Resources 211<br />
Public concern about deforestation and environmental<br />
degradation has never been higher in Sri Lanka,<br />
as elsewhere in the world. Sri Lanka has laws to protect<br />
forests, most importantly the Forest Ordinance, the<br />
Fauna and Flora Protection Ordinance, and the recently<br />
enacted National Wilderness Act. Yet the absence<br />
of firm and clear forest policy to mobilize public<br />
support and enforce forest laws has contributed to<br />
forest management failures.<br />
Articulation of sustainable forest management policies<br />
requires difficult economic choices in the short<br />
term. To achieve effective policy reform the economic<br />
and social values of natural forests, and the pending<br />
threats to national welfare, need far deeper and<br />
broader understanding.<br />
For example, the forest sector has been said to<br />
contribute only 1.7 percent of the GDP, but these figures<br />
grossly undervalue the multitude of direct and<br />
indirect services that forests provide to people and the<br />
economy. Forests regulate stream flows, stabilize steep<br />
land, control soil erosion, reduce flood intensities, prevent<br />
land desiccation, and protect agricultural land and<br />
human settlement. These economic values can be measured<br />
in Sri Lanka, as they have been elsewhere.<br />
Natural forest products — berries, fruit, nuts, game,<br />
and other products — serve local economic needs even<br />
if they never reach urban or foreign markets. Medicinal<br />
substances, horticultural plants, and flowers have accounted<br />
for over 100 million US dollars in annual exports<br />
from Indonesia, and substantial, if so far<br />
uncalculated, economic value to Sri Lankans. (See box<br />
on Sinharaja.)<br />
About 90 percent of the endemic flowering plants<br />
of Sri Lanka, and most of its endemic fauna, can only<br />
be found in the severely depleted natural forests of the<br />
southwest Wet Zone. Aside from ethical considerations,<br />
the pharmaceutical and other long-term direct<br />
economic values of these resources have barely begun<br />
to be recognized.<br />
Minimum Area Under Forest<br />
What is the minimum area that Sri Lanka should<br />
retain under natural forest? To attempt an answer we<br />
may assume that, following current trends, within a few
212<br />
decades, forest plantations and non-forest sources will<br />
meet, and need to meet, most industrial wood requirements.<br />
Arguments for retaining natural forests, therefore,<br />
largely depend on other values. Because of<br />
differences in climate, topography, population densities,<br />
land-use practices, and genetic diversity, minimum<br />
areas retained under forest must be determined separately<br />
for the dry, and wet, intermediate, and montane<br />
zones.<br />
The Dry Zone. This region supports rigorous agricultural<br />
development. Rice fields scattered over the<br />
vast Dry Zone plains produce most of Sri Lanka's rice.<br />
Yet the natural forests protect farmers and the farmlands<br />
by reducing reservoir siltation; improving and<br />
regulating streamflow, reducing the harsh effects of<br />
strong, desiccating winds, and serving as barriers to the<br />
spread of pests and diseases of crops.<br />
The Forestry Master Plan has designated 900,000<br />
hectares of Dry Zone natural forests for total exploitation,<br />
leaving only the protection areas (wildlife parks,<br />
sanctuaries, biosphere reserves, and so forth) intact.<br />
The rationale: deforestation will inevitably continue, so<br />
state exploitation is better than illicit felling.<br />
Past trends need not shape the future, however,<br />
and rational policy for Dry Zone natural forests can<br />
more beneficially derive from a number of interacting<br />
facts:<br />
• Forest clearing for agriculture will drop sharply as<br />
the Mahaweli program nears completion, creating<br />
new needs and opportunities for planned management<br />
of natural forests.<br />
• Unplanned and illicit felling of Dry Zone forests<br />
has converted hundreds of thousands of hectares<br />
into unproductive scrub and wasteland. Cost-effective<br />
rehabilitation can make this land valuable<br />
again.<br />
• Protected areas in the Dry Zone occur mostly as<br />
large blocks in the driest part of the zone. They do<br />
not represent all the ecologically important natural<br />
areas within the 900,000 hectares now under Forest<br />
Department jurisdiction.<br />
Forest Resources<br />
• All the remaining Dry Zone natural forests are low<br />
yield or nonproductive. They do not now provide<br />
Sri Lanka with valuable timber products.<br />
• Unexplored opportunities exist for true multiple<br />
use of forests for timber, wildlife, and village use.<br />
Under these circumstances, a reasonable longterm<br />
economic and environmental policy would designate<br />
at least 500,000 hectares of the Forest<br />
Department's 900,000 hectares as permanent reserve<br />
forests. These reserves can be kept free of timber<br />
felling for several decades. Eventually, however,<br />
through protection and enrichment planting, they can<br />
be managed economically to provide a modest indigenous<br />
timber supply on a sustained basis. The proposed<br />
area of permanent reserves, together with areas under<br />
the Department of Wild Life Conservation, will account<br />
for 25 percent of the Dry Zone.<br />
77ie Wet Zone. In the wet southwest region of the<br />
island, the forest-to-land ratio is widely recognized as<br />
critically low. Policy debate centers around two questions:<br />
are forest areas recommended for complete protection<br />
adequate to preserve the rich genetic diversity<br />
of this region, and are selective felling proposals appropriate<br />
for the high quality natural forest that remains.<br />
The Forest Department has commissioned studies to<br />
address these questions with new facts and analyses.<br />
Timber and Fuelwood Supplies<br />
Reduced felling in the natural forests will also<br />
reduce annual output of industrial wood. How then can<br />
the demand for timber be met?<br />
No single action will suffice, but a combination of<br />
policies can balance supply and demand. Much can be<br />
done to rationalize utilization practices and manage the<br />
growth in demand by reducing waste and developing<br />
timber substitutes, as discussed above. Suitable pricing<br />
policies and other regulatory measures should contribute<br />
to a reduction in the wood demand from natural<br />
forests. Proposals in the Master Plan for raising industrial<br />
wood plantations and ensuring proper silvicultural<br />
maintenance of the plantations should be implemented.<br />
Increased forestation can also build up adequate reserves<br />
of industrial wood for the future.<br />
I<br />
I<br />
I<br />
I<br />
I<br />
I<br />
I<br />
I<br />
I<br />
I<br />
I<br />
I<br />
I
I<br />
I Forest<br />
I<br />
Curtailing the Master Plan's felling regime is unlikely<br />
to reduce overall biomass fuel supply in the next<br />
few years because adequate resources are available<br />
outside the high forests. However, new fuelwood plantations<br />
located in strategic areas may be necessary to<br />
meet long-term requirements.<br />
Forest Plantations<br />
Because forest plantations yield far more per unit<br />
area than natural forests, plantations will provide most<br />
industrial wood supplies. Silvicultural maintenance of<br />
the existing plantations will be essential to reach optimum<br />
productivity. New forest plantations as recommended<br />
by the Master Plan will also be required.<br />
Continuing silvicultural trials should address potential<br />
problems by developing management practices and<br />
finding suitable species mixes that mitigate any ecological<br />
imbalances.<br />
Social Forestry<br />
The Forest Department has recently included social<br />
forestry in its management and research program.<br />
Interaction between villagers and natural and plantation<br />
forests has become recognized worldwide as an<br />
essential part of forest management. Increasingly,<br />
References<br />
Abeywiclcrema. B.A. (1990). Integrated conservation for human<br />
survival. Paper presented at the Symposium on Ecology and<br />
Landscape Management in Sri Lanka. Natural Resources,<br />
Energy and Science Authority, Colombo.<br />
Andrew. J.R.T. (1961). A forest inventory of Ceylon. Forest Department,<br />
Colombo.<br />
FAO (1989). Preinvestment survey on forest industries development<br />
- Ceylon - Final Report. Vol. Ill - Forest Industries. FAO,<br />
Rome.<br />
FAO (1986). A national forest inventory of Sri Lanka 1982-85.<br />
Forest Department, Colombo.<br />
Geiser, W. and Sommer. M. (1983). Up-to-date information on Sri<br />
Lanka's forest cover. Loris 16. pp. 66-69.<br />
Resources 213<br />
planners will need to understand how forest systems<br />
meet social needs, and how these long-term economic<br />
values can be identified and translated into development<br />
decisions.Traditional knowledge of people on<br />
tree growth in specific locations must be obtained and<br />
used. Forest programs that give local populations a<br />
stake in the forest produce will make them more effective<br />
custodians of the forests.<br />
Research<br />
Forest research can no longer be narrowly confined<br />
to the dimensions of traditional forestry. To meet<br />
the requirements of Sri Lanka's increasing population<br />
multi-disciplinary research must include ecological<br />
studies of plantation species, alternative agro-forestry<br />
systems for the vast and unirrigable dry regions, methods<br />
to reduce wastage of timber and. biomass, and<br />
practical measures to improve silvicultural practices.<br />
Public education and professional training will be necessary<br />
to ensure that research findings translate into<br />
practical, on-the-ground results.<br />
A major research need centers around the question<br />
of how to improve the productivity of forest lands<br />
through far more cost-effective measures than have<br />
been used heretofore.<br />
Ministry of Land. Irrigation & Mahaweli Development (1990).<br />
Forest sector development project. Forest Planning Unit, Ministry<br />
of Lands. Irrigation & Mahaweli Development, Colombo.<br />
Poyry, Joako (1986). Forestry master plan for Sri I^nka. Joako<br />
Poyry International Oy, Helsinki.<br />
Wijesinghe, L.C.A. de S. (1989). Biomass fuel and its utilization in<br />
Sri Lanka. RERIC International Energy Journal. Vol. 10,<br />
No.l, pp. 67-80.<br />
Wijesinghe, L.C.A. de S.; Gunatilleke, I.A.U.N.; Jayawardcna,<br />
S.D.G.; Kotagama. S.W.; and Gunatilleke, C.V.S. (1989). Biological<br />
conservation in Sri Lanka - a national status report.<br />
Natural Resources, Energy andSciencc Authority, Colombo.
Wild elephants, estimated at about 3,000, are the greatest living symbol of Sri Lanka's diverse biological<br />
resources.<br />
I<br />
I<br />
I<br />
I<br />
I<br />
I<br />
I<br />
I<br />
I<br />
I<br />
I<br />
I<br />
I<br />
I<br />
I<br />
I<br />
I<br />
I<br />
I<br />
I<br />
I
I<br />
I<br />
I<br />
p<br />
I<br />
i<br />
I<br />
! :<br />
i<br />
! '<br />
I<br />
:<br />
I •<br />
i<br />
I<br />
I<br />
I<br />
I<br />
I<br />
I<br />
I<br />
I<br />
10 Biological Diversity<br />
Sri Lanka's biological diversity has sustained<br />
human society for countless centuries in myriad ways.<br />
Forests, grasslands, wetlands and coastal and marine<br />
habitats, and the species they support have provided<br />
fuelwood, timber, fish medicinal herbs, crop plants and<br />
animals for domestication. They have helped regulate<br />
the climate, recycle nutrients, protect soil and water,<br />
control pests and diseases and provided habitats and<br />
breeding grounds essential for fish and wildlife that<br />
enable human survival.<br />
Ecological<br />
Process<br />
Ecosystem Role in watershed,<br />
Diversity soil and coastal<br />
protection, buff-<br />
eringenvironment- al changes, main-<br />
tenance of produc-<br />
tivity etc.<br />
Genetic Role of individual<br />
Diversity plants and animals<br />
in maintenance of<br />
ecological processes<br />
such as nutrient<br />
recycling, forest<br />
regeneration etc.<br />
Raw materials for<br />
evolution required<br />
for survival and<br />
adaptation of<br />
species.<br />
215<br />
Biological diversity refers to the immeasurable va-<br />
riety of what life contains. Each species has its different<br />
races and breeds and differences among individuals.<br />
Species join to form diverse communities and ecosys-<br />
tems. A country's biological wealth is collectively the<br />
product of millions of years of evolution and the result<br />
of thousands of years of cultivation and domestication.<br />
Biological diversity is therefore of great value and it is<br />
more important than the material or cultural wealth of<br />
a country.<br />
Contributions of Biological Diversity<br />
Agriculture<br />
Provides stability<br />
to agricultural<br />
system.<br />
Habitats for wild<br />
pollinators and<br />
pest enemies<br />
At species level<br />
provides diversity<br />
of food types<br />
and other useful<br />
products to man.<br />
Strains & breeds<br />
for enhancement<br />
of breeding<br />
programs, pest<br />
and disease<br />
resistance etc.<br />
Harvested<br />
Products<br />
Habitat for useful<br />
species. Coastal &<br />
marine ecosystems<br />
have supported<br />
important fisher-<br />
ies. Forests have<br />
produced energy<br />
and timber<br />
Provides timber,<br />
fuelwood, fibre,<br />
fish, medicinal<br />
plants & other<br />
products such as<br />
rattan, weniwel<br />
etc.<br />
Figure 10.1<br />
Cultural<br />
Values<br />
Sacred mountains<br />
such as Adam's<br />
Peak, Sinharaja,<br />
Ritigala. Sacred<br />
rivers e.g.<br />
Menik Ganga<br />
Plants and animals<br />
used for cultural<br />
rituals, incense.<br />
intoxicants etc.<br />
Breeds of rice<br />
used for ceremonies.<br />
Others of cultural<br />
value are elephant<br />
(perahera), lotus etc.<br />
Recreation<br />
and Tourism<br />
Visitors to National<br />
Parks and Protected<br />
areas (100,000<br />
visitors to Yala<br />
annually)<br />
Visitors to National<br />
Zoological Gardens,<br />
Museum and Plant'<br />
Genetic Resource<br />
Center
216<br />
Sri Lanka, like countries around the globe, is depleting<br />
many of these resources at rates that have made<br />
many of them essentially non-renewable. Unlike truly<br />
non-renewable resources such as minerals that can be<br />
so exploited as to become scarce and uneconomic, we<br />
have, at accelerating rates, caused species to vanish<br />
altogether, or become dangerously vulnerable to that<br />
fate. Among the most significant causes of this growing<br />
problem: forest clearing and burning, shifting cultivation,<br />
wetland damming and filling, timber logging, coral<br />
reef destruction, cultivation of monocultures in crops,<br />
plantations, and forests, over harvesting of plants and<br />
animal^ careless introduction of exotic species, indiscriminate<br />
use of pesticides, and pollution of our aquatic<br />
ecosystems. These and other activities diminish Sri<br />
Lanka's biological resources.<br />
Importance of Biological Diversity<br />
Why should we care? Sri Lanka's economy largely<br />
depends on agriculture, plantation crops, fisheries and<br />
other activities whose productivity closely connects<br />
with healthy biological systems. Natural forests support<br />
agriculture by influencing local climate, regulating<br />
water supplies, and protecting soils. They supply fuelwood<br />
and timber. Ecosystems of wetlands and coral<br />
reefs provide the habitats for fish, crustaceans and<br />
molluscs harvested by the fishery industry, they protect<br />
coasts from erosion.<br />
At the micro level, genetic material in domesticated<br />
crop plants, trees, livestock, aquatic animals and<br />
small organisms constitutes essential biological diversity<br />
that we also use. It is the basis of breeding programs<br />
for continued improvement in yields, nutritional quality,<br />
flavor, durability, pest and disease resistance and<br />
other tangible benefits.<br />
Other plant and animal products gathered from<br />
the wild or in cultivation or domestication, such as<br />
medicinal plants, fruits and nuts, vegetables, fibre,<br />
leather, spices, rattan and bamboo, meet daily needs of<br />
millions of Sri Lankans, and support thousands of<br />
small, village-based industries. By maintaining diverse<br />
wild varieties of crop plants we establish insurance<br />
against disease and disasters and provide the genetic<br />
Biological Diversity<br />
material for science-based efforts to improve crops and<br />
agricultural productivity.<br />
Yet only a fraction of the country's plants and<br />
animals have been mobilized to support human survival.<br />
The majority of wild species now unused or<br />
barely used are potential sources of food, fiber or medicines,<br />
and sources of future genetic material needed to<br />
sustain, diversify and improve agriculture, forestry, and<br />
fisheries.<br />
Around the world, natural areas, zoological gardens,<br />
botanic gardens and other monuments to biological<br />
diversity have become increasingly important for<br />
recreation and relaxation as urban areas expand and<br />
grow. The variety of species and ecosystems'provides<br />
rich scenic and recreational experiences that have become<br />
increasingly appreciated as the world becomes<br />
ever more crowded.<br />
Figure 10.1 gives examples of the ways in which<br />
biological diversity contributes to research and education,<br />
cultural heritage, recreation and tourism, the development<br />
of new and existing plant and animal<br />
domesticates and the supply of harvested resources to<br />
Sri Lanka.<br />
<strong>SRI</strong> <strong>LANKA</strong>'S BIODIVERSITY<br />
Wild Resources<br />
Despite its importance, we know remarkably little<br />
about Sri Lanka's biological diversity. Ecosystem types<br />
and variations have been relatively well studied, but the<br />
total diversity of living organisms and interrelationships<br />
among them at a community or ecosystem level are<br />
poorly recognized or understood.<br />
The diverse terrain and climatic variation within<br />
the small land area has resulted in an interesting array<br />
of ecosystems. The country has two basic eco-zones<br />
divided by a central mountainous region which intercepts<br />
the monsoonal winds, thereby creating an everwet<br />
southwestern quarter and a rain shadow in the<br />
remaining area. The far northwest and southeast,<br />
which escapes the monsoons, has a climate bordering<br />
I<br />
I<br />
I<br />
I<br />
I<br />
I<br />
I<br />
I<br />
I<br />
I<br />
I<br />
I<br />
I<br />
I<br />
I<br />
I<br />
I<br />
I<br />
I<br />
I
Forests<br />
Grasslands<br />
Coastal and Marine<br />
Inland Wetlands<br />
Biological Diversity 217<br />
Ecosystem types and variations in Sri Lanka<br />
Tropical wet evergreen forests (lowland rain forests)<br />
Tropical moist semi-evergreen forests<br />
Tropical dry mixed evergreen forests<br />
Tropical thorn forests<br />
Riverine forests (gallery forests)<br />
Tropical lower montane forests<br />
Tropical upper montane forests<br />
Villus<br />
Savannahs (Damana, Talawa)<br />
Wet patanas (wet montane grasslands)<br />
Dry patanas (dry montane grasslands)<br />
Mangroves<br />
Salt marshes<br />
Sand dunes and beach<br />
Mudflats<br />
Seagrass beds<br />
Coral reefs<br />
Flood plains<br />
Swamp forests<br />
Streams and rivers<br />
Ponds<br />
on arid conditions. Within this broad differentiation is<br />
a multitude of ecosystem varieties. Forests are the<br />
predominant vegetation, varying from ever-wet rainforest<br />
-- both lowland and montane -- to dry evergreen and<br />
thorn forest. Grasslands and a complex network of<br />
wetlands, freshwater, coastal and marine ecosystems<br />
are interspersed with the forests. Ecosystem types are<br />
listed in Figure 10.2.<br />
The most conspicuous groups, such as the flowering<br />
plants, ferns and vertebrate animals, are the only<br />
ones relatively well studied. Collectively they probably<br />
account for only a very small percentage of the island's<br />
Figure 10.2<br />
total species. The lower forms of flora and fauna such<br />
as the algae, mosses, liverworts, lichens and invertebrates<br />
are very poorly known. Even less known are<br />
microorganisms such as viruses and bacteria (Figure<br />
10.3).<br />
Yet even among the flowering plants and vertebrate<br />
fauna it appears likely that many species remain<br />
undiscovered. Biologically rich places like Knuckles,<br />
Peak Wilderness and Horton Plains have yet to be<br />
subjected to intensive study. Systematic inventories in<br />
recent years in Sinharaja, Hiniduma and Ritigala<br />
haveled to the discovery of many new species which
218<br />
Biological Diversity<br />
Composition of Flora and Fauna<br />
Group Number of described<br />
Flora<br />
Algae<br />
Fungi<br />
Lichens (Thelotremataceae)<br />
Mosses<br />
Liverworts<br />
Ferns & Fern Allies<br />
Gymnosperms<br />
Angiosperms<br />
Fauna<br />
Land snails<br />
Spiders<br />
Mosquitoes<br />
Blister Beetles (Terrestrial)<br />
Fish<br />
Amphibians<br />
Reptiles<br />
Birds (Residents)<br />
Mammals<br />
Compiled from multiple sources<br />
* inadequate studies<br />
Species<br />
896*<br />
1,920*<br />
110<br />
575<br />
190<br />
314<br />
1<br />
3,100<br />
266<br />
400<br />
Figure 10.3<br />
131<br />
15<br />
59<br />
37<br />
139<br />
237<br />
86<br />
Percentage<br />
Endemism<br />
NA<br />
NA<br />
35<br />
NA<br />
NA<br />
18<br />
00<br />
27<br />
NA<br />
NA<br />
13<br />
20<br />
27<br />
51<br />
50<br />
08<br />
14
I<br />
I<br />
I ;<br />
I<br />
I j<br />
I<br />
I<br />
I<br />
I<br />
I<br />
I<br />
I<br />
I<br />
Biological Diversity 219<br />
Biological Diversity Of Asian Countries<br />
( Ranked According To Average Number Of Species /10,000 Sq Kms)<br />
Mammals<br />
Birds<br />
Flowering Plants<br />
10 12 14 18<br />
100 200 300 400 600 600<br />
Sri Lanka<br />
Malay» la<br />
Philippin««<br />
Vietnam<br />
Thailand -<br />
lndon««ia -<br />
Myanmar -<br />
Figure 10.4<br />
India -<br />
China -<br />
3rl Lanka<br />
Ban«lad««h<br />
Malayaia<br />
Myanmar<br />
tndonaala<br />
India<br />
China ina -<br />
Amphibians<br />
Reptiles<br />
10 IS<br />
Population Densities<br />
zoo 400 «oo 800 1000<br />
20
220<br />
Biological Diversity<br />
Distribution of Endemic Flowering Plants of Sri Lanka<br />
Source: Peeris 1975<br />
Sourca: Kotagama 1989<br />
Figure 10.5<br />
Distribution of Endemic Vertebrates<br />
of Sri Lanka (Diagrammatic Sketch)<br />
Wet Low<br />
ƒ Country<br />
XL<br />
"f \<br />
><br />
Dry<br />
40% \ Montane<br />
51%<br />
/^—1<br />
Figure 10.6<br />
70% \<br />
isiandwide<br />
7%
I<br />
Ii •<br />
i •<br />
I<br />
I I<br />
Ii<br />
r<br />
1. coastal and marine belt<br />
4. eastern intermediate lowlands<br />
7. southern lowlands hills<br />
10. Midmountains<br />
Biological Diversity 221<br />
Floristic Regions of Sri Lanka<br />
( Ashton and Gunatilleke, 1987)<br />
2. dry and arid lowlands 3. northern and intermediate lowlands<br />
5. northern wet lowlands 6. Sinharaja and Ratnapura<br />
8. wet zone freshwater bodies 9. foothills of Adam's Peak and Ambagamuwa<br />
11. Kandy and upper Mahaweli 12. Knuckles<br />
13. Central mountains, Ramboda-Nuwara Biya 14. Adam's Peak 15. Horton Plains<br />
Figure 10.7
222<br />
were hitherto unknown to science. The recently revised<br />
classification of plants and animals of Sri Lanka have<br />
also resulted in the identification and documentation of<br />
new species.<br />
Sri Lanka has greater biodiversity per unit area<br />
than any other country in Asia. (Figure 10.4.) It is one<br />
of eleven areas in the tropics identified by the Committee<br />
on Research Priorities in Tropical Biology (NAS,<br />
1980) as demanding special attention because of its<br />
high levels of biological diversity, endemism and its<br />
vulnerability to habitat destruction.<br />
Sri Lankan flora represents the following floristic<br />
elements (Abeywickrama, 1955): Sri Lankan, Indo-Sri<br />
Lankan, Himalayan, Malayan, African, and pantropic<br />
and cosmopolitan. The fauna represents Indo-Sri Lankan,<br />
Malaysian, African and Sri Lankan elements. Although<br />
the predominant named forms of Sri Lankan<br />
plants and animals are present in peninsular India, we<br />
have evidence of high concentration of diversity and<br />
endemicity. Around 30 percent of the angtosperm<br />
flora, 18 percent of the ferns, and 16 percent of the<br />
terrestrial vertebrates are endemic to the island. Most<br />
of this unique diversity concentrates to an extraordinary<br />
degree in the humid southwestern lowlands and<br />
central mountains (Figures 103 and 10.6).<br />
Floristic regions have been delineated for the island<br />
(Figure 10.7). Within the wet lowland and high<br />
elevational montane forests itself there are several distinct<br />
local areas of high diversity and endemicity.<br />
Within the moist low country restricted distributions<br />
are unusually common; the foothills of Adam's Peak,<br />
which run as a narrow band, are exceptionally rich in<br />
highly local elements. This is the wettest and the least<br />
seasonal part of the country. Another area of exceptional<br />
endemicity is the narrow belt, approximately 30<br />
kilometers wide, encompassing the hills of Bentota and<br />
Gin Ganga basin in the south. This area still includes a<br />
few isolated forests.<br />
A similar geographic distribution characterizes the<br />
endemic vertebrate fauna, particularly fish, birds, amphibians<br />
and reptiles. The Kalu Ganga and Gin Ganga<br />
river basins located in the lowland Wet Zone are particularly<br />
important habitat for endemic fish species.<br />
(Senanayake 1980 and Evans 1981.) Thirteen of the 16<br />
Biological Diversity<br />
or 17 endemic fish species are found in these river<br />
basins.<br />
Despite these concentrations of biodiversity in the<br />
wet lowlands and central mountains, only a few locations<br />
have been studied enough to establish fairly comprehensive<br />
lists of flowering plants and, in some cases,<br />
the vertebrate fauna. Species richness has been compared<br />
among six sites in Sri Lanka, using species/individual<br />
curves to compare species richness (Gunatilleke<br />
and Ashton, 1987). The three wet lowland sites<br />
(Gilimale, Kanneliya and Kottawa) show high species<br />
richness when compared to the intermediate climatic<br />
zone (Barigoda andMoneragala) and the dry lowlands<br />
(Ritigala). Further studies (Gunatilleke, Gunatilleke<br />
and Sumithraarachchi, 1987) show high representation<br />
of endemics among the woody vegetation of the wet<br />
lowlands (Figure 10.8).<br />
Vertical variation of diversity can also be observed<br />
within these lowland rainforests. Endemic species are<br />
relatively concentrated in the canopy and sub-canopy<br />
layers of the forest (de Zoysa et al., 1987) (Figure 10.9).<br />
Comparatively few studies have been conducted on<br />
the distribution of vertebrate fauna. The only known<br />
comprehensive work for any specific location is for the<br />
Sinharaja forest (Figure 10.10).<br />
Cultivated Resources<br />
Thousands of years of settled agriculture have produced<br />
a storehouse of cultivated biological resources<br />
of crop plants, fruit trees, spices and livestock, and a<br />
century ago, in the plantation sector, numerous local<br />
new cultivars developed.<br />
Sri Lanka has a rich treasure of rice genes. Several<br />
thousand years of selection and cultivation, augmented<br />
by traditional farming practices and the country's<br />
ecoedaphic variability have produced a wide variety of<br />
crop cultivars. Among the 120,000 cultivars in the entire<br />
world, this small island has recorded 2,800 varieties<br />
so far — vastly disproportionate to its size. These rice<br />
varieties show great adaptability to a wide range of soil<br />
conditions. Upland varieties show drought tolerance,<br />
and those grown in coastal and river floodplain areas<br />
can tolerate submergence and flash floods. Some can<br />
tolerate low temperatures of the highlands, while others<br />
I<br />
I<br />
I<br />
I<br />
I<br />
I<br />
I<br />
I<br />
I<br />
I<br />
I<br />
I<br />
I<br />
I<br />
I<br />
I<br />
I<br />
I<br />
I<br />
I<br />
I,
Kottawa<br />
Kanneliya<br />
Source: Gunatilleke et al. 1987<br />
Biological Diversity 223<br />
Endemicity Among Woody Species<br />
in Wet Lowland Sites<br />
20 40 60 80 100<br />
No. of Species<br />
I Endemic Species<br />
Figure 10.8<br />
The Diversity of Flora in Sinharaja<br />
on a Single Undisturbed Forest Location<br />
Canopy Trees<br />
Understorey Trees<br />
Gap Species<br />
Treelets & Shrubs<br />
Lianas<br />
Herbs, Sedges, Ferns<br />
Source: Pe Zoysa et al. 198S<br />
m<br />
20 40 60<br />
No. of Species<br />
Figure 10.9<br />
Endemic Species<br />
120 140 160<br />
80 100
224 Biological Diversity<br />
100<br />
80-<br />
60-<br />
40-<br />
20-<br />
Vertebrate Species in Sinharaja<br />
% of Species/Endemics in Sri Lanka<br />
Fish Amphibia Reptiles Snakes Birds Mammals<br />
Source: March for Conservation, 1990<br />
t=3 Species HI Endemics<br />
- Bars indicate percentage of Sri Lankan species and endemics in Sinharaja<br />
- Figures above bars indicate numbers of species counted<br />
Dry Lowlands 50.54»<br />
Figure 10.10<br />
Forest Cover in Different<br />
Bioclimatic Zones<br />
Source : Qunatilleko & Qunatllleke 1983<br />
Figure 10.11<br />
21.97*<br />
1.45%<br />
Wet Lowianos 14.48%<br />
termedlate 2.91%<br />
1.54*<br />
Montane 7in<br />
- Separate segments indicate natural forest areas
Out of Danger<br />
1*<br />
Biological Diversity 225<br />
Status of Woody Endemics in Selected<br />
Wet Lowland Sites<br />
Vulnerable<br />
34%<br />
Source: Gunatllleke & Gunatlllek» 1990<br />
have broad-based resistance to serious pests and tolerance<br />
to iron toxicity. There are several grain types,<br />
some with medicinal properties and fragrance and others<br />
that are used for cultural ritual.<br />
Besides rice, Sri Lankan cereals include millets,<br />
sorghum and maize. The type of millets grown from<br />
ancient times are finger millet Eleusine coracana, foxtail<br />
millet Setaria italica, common millet P asp alum<br />
miliaceum and koda millet Paspalum scrobiculatum.<br />
Unlike rice, these cereals have undergone little selection<br />
by the farmers.<br />
Legumes constitute an important source of protein<br />
for most Sri Lankans. Some variability exists among<br />
pigeon pea Cajanus cajan. Wild relatives of pigeon pea<br />
such as Atylosia, Rhynchosia, Viscosa and Dunbaria<br />
have been recorded in the country. Winged bean<br />
Psophocarpus tetragonolobus show much variability in<br />
seed color, pod size, and flower color.<br />
Among the horticultural crops, several varieties of<br />
banana Musaspp. are under cultivation in the different<br />
agro-ecological regions of the country. M. acuminata<br />
and M. balbisiana the wild progenies of cultivated bananas<br />
are both present in Sri Lanka. Other fruit crops,<br />
such as citrus, mango, avocado, and jak exhibit much<br />
Figure 10.12<br />
Endangered<br />
i, 23%<br />
Insufficiently Known<br />
5%<br />
variability. Numerous types of vegetables, both temperate<br />
and tropical species are also cultivated throughout<br />
the country, and curcubits, tomatoes and eggplants<br />
exhibit much genetic diversity.<br />
Sri Lanka has an estimated 170 species of plants of<br />
ornamental value, of which 74 species are endemic.<br />
Dendrobium and Vanda species and foliage plants<br />
thrive in natural forest habitats. Among the root and<br />
tuber crops, much variability exists among cassava,<br />
Dioscorea, aroids and innala Solenostemos<br />
rotundifolius.<br />
Spices have made Sri Lanka famous. Considerable<br />
genetic diversity occurs among pepper, cardamom,<br />
betel and chilli. About 500 known local selections of<br />
pepper Piper and about 10 wild species have been<br />
identified. Ten wild races of cardamom have been<br />
collected from the Sinharaja and adjoining forests.<br />
Plantation crops have been the mainstay of the<br />
economy, particularly coconut, tea, and rubber -- the<br />
latter two having been introduced within the past two<br />
centuries. Tea is now grown on over 250,000 hectares.<br />
The germplasm originally introduced from Assam has<br />
undergone selection through breeding programs, and<br />
the selected genotypes are being clonally conserved in
226<br />
-<br />
Faunal Groups<br />
Insects -•<br />
Crustaceans -j|<br />
Amphibians -fl<br />
Biological Diversity<br />
Fishes -•<br />
Molluscs -••i<br />
; ! : :<br />
Reptiles -fl<br />
Diras -•<br />
Mammals -M<br />
0<br />
Source: Kotogama 1989<br />
Threatened Faunal Species<br />
^^^—^M^TTTTl I m m<br />
^^^^TTTTI INI I Ti<br />
various breeding stations and tea estates in the country.<br />
Selection procedures and vegetative propagation have<br />
together produced a series of clones of high yield, resistance<br />
to pests, disease, and drought, and high rates of<br />
fermentation. The total number of clones among rubber<br />
is at present around 132. A variety of hybrids of<br />
coconut have also been developed here.<br />
There are wild species of buffalo, cattle, fish and<br />
fowl, but, with the notable exception of marine fisheries,<br />
the country relies heavily on imported strains to meet<br />
domestic demands. Apart from the Sinhala cattle that<br />
are endemic to the country, foreign breeds (Ayrshire,<br />
Herefords, Sindhi, etc.) have been introduced over the<br />
last four decades. Although little hybridization has<br />
been carried out on goats and pigs, some improvement<br />
has been made with cattle. Among poultry some importation<br />
of selected breeds and hybridization has been<br />
accomplished. The local poultry breeds are fast disappearing<br />
due to imported gennplasm, despite the fact<br />
that the genes of local varieties have resistance to tropical<br />
diseases.<br />
•B ! ; : ; |<br />
i i i i i -<br />
20 40 60 80 100 120<br />
Total No. of Threatened Species<br />
M ENDEMIC SPECIES<br />
Figure 10.13<br />
STATUS AND TRENDS<br />
Loss of Ecosystem Diversity<br />
No discussion of biological diversity can ignore the<br />
steady diminution of natural forests and other ecosystems<br />
in Sri Lanka. Natural ecosystem diversity has<br />
declined and we have no evidence to suggest a change<br />
or deceleration of this trend. The dry floodplains are<br />
irrigated lands of the lowlands which have been subjected<br />
to extensive deforestation and settled agriculture<br />
since the third century B.C. They have been modified<br />
with the construction of thousands of irrigation tanks<br />
and channels. Deforestation in the Wet Zone began in<br />
the thirteenth and fourteenth centuries with the establishment<br />
of the Kingdoms of Gampola and<br />
Dambadeniya. Subsequently in the colonial era, plantation<br />
crops such as coffee, then tea and rubber, replaced<br />
natural forests in the wet lowlands and montane<br />
areas, while coconut expanded into the wet coastal<br />
lowlands. However, the dry lowlands — cradle of Sri<br />
Lanka's ancient civilization — reverted to forest with the<br />
abandonment of the irrigation systems beginning about<br />
I<br />
I<br />
I<br />
I<br />
I<br />
I<br />
I<br />
I<br />
I<br />
I<br />
I<br />
I<br />
I<br />
I<br />
I<br />
I<br />
I<br />
I<br />
I<br />
I<br />
I
I<br />
I Biological<br />
I<br />
1<br />
P<br />
800 years ago. In the last 50 years major new irrigation<br />
projects have penetrated the dry lowlands once again.<br />
As the Forestry chapter describes, natural forest<br />
cover for the island is down from about 70 percent at<br />
the beginning of the century to less than 25 percent<br />
today. The FAO reported in 1981 that Sri Lanka's<br />
annual rate of deforestation of 3.5 percent was the<br />
highest in Asia, excepting only Nepal.<br />
Recent estimates of forest cover in the different<br />
bioclimatic zones (FigurelO.ll) indicate that, with the<br />
exception of the dry lowlands, the proportion of forests<br />
in the other climatic zones are critically low. Areas that<br />
contain the highest proportion of endemics and species<br />
have small areas of forests and natural habitat.<br />
A key factor in maintaining biological diversity, and<br />
a way to measure its vulnerability, is the size of the<br />
conservation area. Most forests in the high diversity<br />
zones of the wet lowlands and montane highlands are<br />
fragmented and over-exploited. With the exception of<br />
a few relatively large forest patches in the Wet Zone,<br />
the rest have been broken down into small patches.<br />
The 160 square kilometers of forests in the Matara<br />
district occur as 30 patches, each 50-1000 hectares.<br />
Relatively undisturbed forests in these two zones are<br />
small and restricted to inaccessible hill ridges and cover<br />
less than 25,000 hectares.<br />
The implications of this trend toward isolation of<br />
critical habitats are serious because the Wet Zone,<br />
which covers 23.7 percent of Sri Lanka's land area,<br />
contains 54.7 percent of the current population of the<br />
country, at a mean density of 583 persons/sq. km. This<br />
density is well above the national average of 244 persons/sq.<br />
km. The few forest patches of the Wet Zone<br />
have become highly vulnerable to population pressures.<br />
The total extent of Wet Zone forest in the country<br />
is at present around 150,000 hectares, down from<br />
250,000 hectares in 1956. All remaining forests and<br />
other natural habitats in the wet lowlands and montane<br />
highlands have become increasingly valuable, and vulnerable,<br />
as critical resources to conserve the island's<br />
unique plant and animal species.<br />
Other critical habitats such as coral reefs (Coastal<br />
Chapter) and wetlands (Coastal and Inland Aquatic<br />
Diversity 227<br />
chapters) are also severely threatened, although few<br />
quantitative data are available on changes in area or<br />
quality of coastal and inland aquatic habitat. Along<br />
with adverse effects on fisheries and coastal erosion<br />
protection, removal of coral for production of lime has<br />
diminished biological diversity. Inland marsh forests of<br />
the wet lowlands, have almost completely disappeared.<br />
Loss of Genetic Diversity<br />
In addition to habitat destruction — from loss of<br />
forests and numerous agricultural, settlement, and economic<br />
development activities ~ biological diversity suffers<br />
from selective exploitation of species, particularly<br />
plants. Selective removal of desirable species has resulted<br />
in changes in floristic and faunistic composition<br />
of the forest and a steady depletion of populations of<br />
the exploited species.<br />
Many species, once plentiful, are now found in<br />
smaller numbers and some are considered to be threatened.<br />
Without quick action to conserve their habitats<br />
they will become seriouly endangered, their genetic<br />
variety reduced, and their long-term survival in doubt.<br />
Others have been exploited to such an extent that they<br />
clearly verge on extinction. The Comb duck<br />
Sarkidiomis melanotus which used to breed in the<br />
Giant's Tank and Senanayake Samudra has completely<br />
disappeared from Sri Lanka. Concerns about elephants<br />
grow. At the begining of the nineteenth century Sri<br />
Lanka had an estimated 12,000 elephants (McKay,<br />
1973). They roamed the Dry and Wet Zones and at the<br />
higher elevations. Elephant killing for sport and more<br />
recent habitat destruction and killing to defend crops<br />
has greatly reduced the population, now largely restricted<br />
to the Dry Zone and estimated at around 3,000<br />
animals. Selective poaching of elephants for trophies<br />
and ivory has almost eliminated the genetic trait for tusk<br />
formation in the Sri Lankan wild elephant population.<br />
Today, only 5 percent of the wild elephants in the<br />
country possess tusks -- a substantially lower percentage<br />
than in the average asiatic elephant population.<br />
Selective removal has endangered some of the<br />
island's most valuable timber trees. Calamander<br />
Diospyros quaesita, a fine variegated timber tree, is rare<br />
today, and is only present in a few restricted locations.
228<br />
Satinwood Chloroxylon swietenia, ebony Diospyros<br />
ebentim and other valuable timber species like nadun<br />
Pericopsis mooniana are now rare, although abundant<br />
in the last century. Diospyros oppositifolia is now confined<br />
to small stands at Hinidum Kanda and Sinharaja<br />
while the madara tree Cleistanthus collinus seems to<br />
have been exploited to extinction.<br />
Many species of medicinal and ornamental plants<br />
have also been overexploited. Some of the species endangered<br />
as a result are the orchids Dendrobium<br />
maccarthiae, Dendrobium heterocarpum, Ipsea spedosa<br />
andRIiynchostylis retusa. Sumithraarachchi (1986), has<br />
identified that of 170 species of orchids found in the<br />
island, 99 can be considered rare, 7 vulnerable, and 13<br />
species likely to be extinct. Medicinal plants such as<br />
ekaweriya Rauvolfia serpentina, Saraca asoca, godakadura<br />
Strychnos nux-vomica, rodanti Capparis moonii,<br />
malitha Woodfordia fruticosa and a host of others have<br />
become rare in the wild. Numerous plant species recorded<br />
on the island by earlier botanists have not been<br />
collected or observed subsequently, some for more than<br />
a hundred years, because of selective removal or the<br />
destruction and disturbance of their habitats.<br />
Nearly 16 percent of the flowering plants and 28<br />
percent of the ferns and fern allies are considered<br />
threatened (Abeywickrama, 1987). So are twelve of the<br />
endemic genera. About 480 species of flowering plants<br />
and 90 species of ferns and fern allies belong to this<br />
threatened category. Included are 228 endemic and 252<br />
non-endemic species amongst the flowering plants, and<br />
30 endemic and 60 non-endemic species amongst the<br />
fern and fern allies.<br />
Some specific information is also available on the<br />
status of threatened species in the wet lowland sites<br />
(Figure 10.12). Over 94 percent of the woody endemics<br />
in these sites are threatened. Only 1-2 percent of the<br />
lowland woody endemics are believed to be found in<br />
large enough numbers to be considered out of danger.<br />
Another group of plants — the commercially important<br />
rattan species - are severely threatened. Of the 10<br />
species, 7 have restricted distribution, 3 are endangered<br />
and 3 more vulnerable. If trends affecting these species<br />
continue, most of those considered threatened will become<br />
extinct within a decade so. Some species may<br />
already be extinct; about 50 or more plant species have<br />
Biological Diversity<br />
not been collected for over a century, including the<br />
endemics Cyathula ceylanica, Elliphanthus unifoliatus-<br />
Ceropegia elegans, Blumea angustifolia, Anaphalis<br />
fruticosa and Calamus pachystemonus. Many more<br />
species, formerly common and widely distributed, have<br />
over the last few decades become rare or restricted to<br />
a few locations. One such species Vatica obscura, the<br />
only member of the Dipterocarpaceae family found<br />
outside the Wet Zone, occurred until very recently in<br />
gregarious masses in riverine forests of the eastern<br />
province. It has not been collected in the last ten years.<br />
As an oceanic island Sri Lanka has a high percentage<br />
of endemic species that have evolved because of<br />
isolation, but they are particularly vulnerable. When<br />
their natural habitats are destroyed they are unable to<br />
recolonize the degraded soils. Over 200 naturalized<br />
aliens (Abeywickrama, 1955) include some of the most<br />
troublesome weeds. They have successfully established<br />
themselves, most often at the expense of the natural<br />
flora. Amongst fauna, the endemics represent a highly<br />
vulnerable group. Figure 10.13 lists the status of faunal<br />
species studied so far (Kotagama, 1990).<br />
Among the major impacts on biological diversity<br />
the single most important in recent years was the Accelerated<br />
Mahaweli Development project, which replaced<br />
about 200,000 hectares of natural wildlife<br />
habitat with agriculture, settlement and related developments.<br />
Elephants were most affected; about half the<br />
elephant population in this region (500 animals) were<br />
expected to be displaced. Other significant causes not<br />
quantified as yet: chemical pollution of air, land and<br />
water by various agricultural and industrial activities.<br />
Some mosses and liverworts, earlier common as epiphytes<br />
have disappeared or become less common in<br />
and around Colombo. Similarly Schizaea digitata has<br />
disappeared in most areas.<br />
Genetic depredation occurs from more purposeful<br />
human action intended to increase food production.<br />
Modern agriculture in Sri Lanka, particularly rice, relies<br />
increasingly on a few imported seed varieties with<br />
a narrow genetic base, displacing the traditional crop<br />
varieties. Present indigenous rice varieties under cultivation<br />
have dwindled to about five percent of total<br />
paddy acreage. The spread of genetically uniform varieties,<br />
while helping tó achieve high yields, also makes<br />
I<br />
I<br />
I<br />
I<br />
I<br />
I<br />
I<br />
I<br />
I<br />
I<br />
I<br />
I<br />
I<br />
I<br />
I<br />
I<br />
I<br />
I<br />
I<br />
I
I<br />
I<br />
I<br />
I<br />
I<br />
I<br />
I<br />
I<br />
I<br />
I i<br />
I 1<br />
I<br />
I<br />
I<br />
I<br />
I<br />
I<br />
I<br />
1<br />
crops more vulnerable to pests and diseases. As the<br />
gene stock becomes less diverse we also reduce options<br />
for new crop breeding programs. Further, current efforts<br />
to develop new agricultural lands through irrigation<br />
schemes threaten the natural habitat of wild crop<br />
genetic resources, as is happening to valuable wild rice<br />
species found mainly in abandoned tank beds. Ironically,<br />
this development is occurring while innovative<br />
genetic engineering techniques are being pursued to<br />
transfer the rice traits of wild crop species to cultivated<br />
species.<br />
TRENDS IN PROTECTED AREA<br />
MANAGEMENT<br />
One of the world's first wildlife sanctuaries dates<br />
back to the reign of King Devanampiyatissa, when Buddhism<br />
was first introduced in the third century B.C.<br />
Later, in the twelfth century A.D. King Kirti-Nissanka-<br />
Malla prohibited the killing of animals within a radius<br />
of 35 kilometers of his kingdom of Anuradhapura. Subsequent<br />
Sri. Lankan rulers protected large tracts of<br />
forests as reserves, for example Udawattekelle Reserve<br />
and Sinharaja Forest.<br />
In modern times, however, with the enactment of<br />
the Forest Ordinance in 1907, wildlife was given legal<br />
provision through the establishment of sanctuaries -<br />
first at Yala, and then at Wilpattu. In 1938 Sri Lanka<br />
established five categories of protected areas, under the<br />
Fauna and Flora Protection Ordinance: Strict Natural<br />
Reserves, National Parks, Nature Reserves, Jungle Corridors<br />
and Intermediate Zones. All are administered<br />
by the Department of Wildlife Conservation. Simultaneously,<br />
the Forest Ordinance established two categories<br />
of reserves: Forest Reserves and Proposed<br />
Reserves. Most recently, in 1987, Parliament's National<br />
Wilderness Act added National Wilderness Areas to<br />
the protected list. The total extent of land area under<br />
some sort of protection currently is a over 15,000 square<br />
kilometers, of which around 10 percent is in the Wet<br />
Zone and the balance in the Dry and Intermediate<br />
Zones (Figure 10.14). (See Forestry Chapter.)<br />
Designation of protected areas does not necessarily<br />
mean that protection is effective. Anecdotal evidence<br />
indicates that illegal and unmanaged logging, hunting,<br />
Biological Diversity 229<br />
gathering, farming and livestock grazing are common<br />
in most of the protected areas. In the Wet Zone alone,<br />
for example, approximately 20 percent of the forest<br />
reserves have either disappeared completely or have<br />
been reduced to small isolated patches.<br />
Although about 23 percent of the country is under<br />
some sort of protection, only 12 percent is devoted to<br />
complete protection (National Reserves and Sanctuaries<br />
under the Fauna and Flora Ordinance and National<br />
Wilderness Areas under the National Wilderness Act).<br />
Yet, this represents a significant commitment to the<br />
preservation of biological diversity. Sri Lanka is one of<br />
only five countries in the world that has over 10 percent<br />
of land area allocated for strict conservation.<br />
Since the first national parks were established in<br />
1938, some 60 or more protected areas have been set<br />
aside exclusively for conservation, covering some 7,500<br />
square kilometers. Numbers and size of the protected<br />
areas have steadily increased, particularly in the last<br />
two decades (Figure 10.15). Although there are over<br />
60 protected areas in the country, about 40 percent are<br />
less than 1,000 hectares — nearly all "biological islands"<br />
amongst agriculture and other developments.<br />
Can they maintain their biological diversity? Limited<br />
research to date suggests that in the tropics the<br />
minimum viable breeding population of 500 trees of<br />
low-density species require between 6-1,000 hectares<br />
for their conservation (Whitmore, 1984). The minimum<br />
critical size required to conserve the elephants is<br />
at least 100,000 hectares of contiguous forest. Only two<br />
reserves in Sri Lanka meet this requirement.<br />
Despite overall statistics, most protected areas<br />
exist in the Dry Zone. In the biologically rich Wet Zone<br />
only 2.6 percent of the land area (400 square kilometers)<br />
is under complete protection. Of the 18 reserves<br />
in this zone, only five are over 1,000 hectares, and only<br />
one is
230 Biological Diversity<br />
SINHARAJA<br />
Sinharaja» âvast legendary forest of impenetrable mystery, is becoming something very different, and<br />
very tangible: a model for optimal and sustainable use of a species-rich tropical rain forest The Sinharaja<br />
forest is now the sole lowland rain forest in Sri Lanka big enough to have a reasonable chance to conserve<br />
the uniquely diverse wildlife of the lowland and midland Wet Zone. As a group of forests, including the<br />
Sinharaja Reserve and the forest reserves surrounding it. — Morapitiya, Runakanda, Panagala, and<br />
Dclgoda—it covers 4737O hectares.<br />
The fauna and flora of the Wet Zone forests of Sri Lanka, now reduced to less than 10 percent of their<br />
original extent, are the richest, by far, in all South Asia. The nearest true aseasonal rain forests are in<br />
Madagascar and Sumatra. More than 70 percent of the species are found nowhere else. Sinharaja is of<br />
outstanding value for the conservation of these plants and animals.<br />
Very little of it is truly in the lowlands, and that part has either been selectively logged or degraded<br />
by chena agriculture in the past. Although the eastern end reaches almost L500 meters at the Handapan<br />
Ella Plains, most of Sinharaja is at middle altitudes, between 500 and 1,000 meters. Many lowland species<br />
reach up to these altitudes and mingle with the true hill species, and unlike the Far East rain forests, in<br />
the Wet Zone of Sri Lanka mid-elevation flora is intrinsically richer in species than in the lowlands.<br />
• Thereason for this condition may be that Sri Lanka is geologically part of peninsular India, long known<br />
to have; once been attached to a former great Antarctic continent, named Gondwanaland. An island of<br />
continental dimensions comprising India^ Sri Lanka, and a sunken extension, broke off some 80 million<br />
years ago. It moved north, across what was then the eastern extension of the Pacific Ocean. The island<br />
hit landfall some 40 million years later, and it has continued moving inexorably northwards, slipping<br />
beneath the Asian plate, as the rumpled carpet of the Himalayas bears testimony. The island continent<br />
broke loose after modern land plants, many modern insects, but only the marsupials among mammafo had<br />
evolved. It was large enough, and was separated for long enough, to allow the evolution of distinct forms<br />
of life, rather like a minor Australia;<br />
What were these forms, and do any still exist? We know from the fossil record that the climate of<br />
Antarctica at the time of embarkation must, have been warm and moist - similar to the mid-elevation<br />
climate of Sinharaja. But apart front attAgamid lizard, and the remarkably elegant small tree Hortonia,<br />
there is little obvious evidence of Sri Lanka's ancient past The presumably primitive Gondwanan land<br />
animalswereeliniinatedbythe more advanced continental Asian fàunawhen the continents collided. The<br />
island continent had to pass north through the doldrums, óver whose quiet waters no rain falls. Rain<br />
forests in sucîtseasonal regions are confined to the most constantly humid zone, which: us within the cloud<br />
base on the'mountain slopes, usually starting at about 800 meters. The modern Lankan flora could<br />
therefore be descended from such a time: .<br />
Botanical research reveals that more of Gondwana remains in Sri Lanka than first meets the eye. The<br />
tree tamily parexcellence of moist mountain forests is thé Fagaceae; the oaks. Though there are more<br />
species of oak in the Himalayas than anywhere else o» earth, not a single Fagaceae exists in South Asia.<br />
Acorns, which have little dormancy and are only dispersedmcfdentaDy by animals thafrcollect them to eat,<br />
have apparently failed, even after 40-milIioîatyears, to cross south of the Gangetic Plain: In the moist<br />
fastne» of Sinharaja, and elsewhere ut the Wet Zone-of Sri Lanka particularly at mid-elevations,<br />
~ extraordmarilyprimittve membersofanotherfamüy, theDtptefocarpaceae, remain-conserved. Currently
I<br />
I<br />
I<br />
Biological Diversity<br />
dipterocarps are best known in the Far East, where they supply over half the hardwoods on international<br />
markets. Their ancestors survive in the hills of Sri Lanka. In Sinharaja the dipterocarps, reprecented by<br />
many species in the two endemic groups Stemonoporus, and Shorea section Doona, reign supreme. The<br />
serried crowns of the majestic yakahalu, Shorea gardneri, once mantled the hills throughout the Wet Zone.<br />
Now, thanks to tea plantations and other development, the last stands are confined to Sinharaja and the<br />
Peak Wilderness, still conveying there an eerie memory of the ancient Gondwana forest. Sinharaja<br />
therefore serves as a genetic repository for some of Asia's most important economic plant groups.<br />
These unique Lankan Shorea trees, some ten species in alL serve as examples of the other crucial<br />
contemporary value of Sinharaja. Their seeds, rich in vegetable oils» have traditionally been a major food<br />
for the rural poor, particularly during times of scarcity. Their timber, however, is the leading source of<br />
plywood for tea chests. Sinharaja has therefore become the stage for urgently needed pioneer research<br />
which seeks to reconcile modern commercial priorities with: the traditional uses which have served rural<br />
communities for centuries. The Wet Zone of Sri Lanka is ideal for such research. On one hand the forest<br />
is unique in its biodiversity. On the other the T -anlran people, who over history have become concentrated<br />
in the wet lowlands of the southwest, still retain a sustainable system of land and forest use of extraordinary<br />
sophistication and intensity — the historical precursor of the celebrated agriculture and home garden<br />
systems found from Indianized Asia eastwards to Bali and the Philippines.<br />
Sri Lanka is a nation of smallholders. In the past, every family- owned its own irrigable land above<br />
which, on the lower slopes, was their, artificial forest in which useful forest plants were grown and in whose<br />
shade their homes were built Further above, extended the great forest, property of the king, in which<br />
villagers by right could harvest fruit, medicinals, cord, fish and game, fuel and occasionally construction<br />
timber. Although the country is poor, its quality of life has been unusually good in large measure because<br />
of this ancient pact with the land. But forest logging has put this balance in jeopardy. Unlike traditional<br />
uses, logging is a destructive form of harvesting, and the villagers are only minor beneficiaries. Nevertheless,<br />
many of the plants valuable to villagers prosper in well managed regenerating forests following<br />
logging.<br />
A group of Lankan researchers have seen the unique opportunities to reconcile traditional rights of<br />
the rural population with modern requirements of the state that Sinharaja and its neighboring villages<br />
present Social and biological scientists are working together in the .forest, developing a common<br />
methodology to address an interdisciplinary challenge. They are documenting the biological resources of<br />
the forest and monitoring the productivity in nature to determine how the resources can best be<br />
manipulated to yield in perpetuity, without loss of species. Social scientists are for the first time detailing<br />
traditional uses and the methods of harvesting and quantities used; economists are beginning to calculate<br />
the manifold values of the forest in terms of the rural economy, the national economy including timber,<br />
water, soil, and tourist values, and also the global value of Sinharaja's irreplaceable genetic resources.<br />
Rising interest in Sinharaja among scientists has-bees matched by th© Lanka» public* thanks in<br />
particular to an articulate and effective private group, the March fovConservationk WUh the participation:;<br />
of the scientific: and conservation communities, and help, frontthft Worid Cbnservatiott: Unionj a.<br />
conservation master plan for Sinharaja has been prepared ta reconcile th&interests ofaQ Lankans in its*.,<br />
natural wealth, while also ensuring its protection in<br />
231
232.<br />
Other W R (WZ)<br />
4.3*<br />
Other N F (WZ)<br />
1.4*<br />
Biological Diversity<br />
Distribution of Protected Areas<br />
by Major Categories<br />
National Parks (WZ)<br />
0.2*<br />
Other W R (DZ)<br />
14%<br />
Forest Reserves (DZ)<br />
37 7*<br />
dens, a single zoological garden and a number of medicinal<br />
plant gardens. The Botanic Gardens at Peradeniya,<br />
established in 1822, contain 10,000 flowering<br />
plants belonging to 1,179 different species (Gunatilleke<br />
and Wijesundera, 1982), including about 14 percent of<br />
the local endemic flowering plants. The Botanic Gardens<br />
are a last refuge for at least five endemic plants<br />
that have not been found in the wild during this century.<br />
INSTITUTIONAL CONSTRAINTS<br />
AND NEEDS<br />
Sri Lanka's great wealth and diversity of biological<br />
resources has the support of laws and protected area<br />
coverage. Yet all the best evidence shows that here, as<br />
elsewhere in the world, biological resources are being<br />
depleted at unprecedented rates. The values of biological<br />
diversity are among the least appreciated, and, in<br />
economic terms, poorly valued natural resources. No<br />
single step will suffice to include these values in our<br />
thinking and decisions about how to proceed with economic<br />
development. A number of policy initiatives and<br />
Nat<br />
ional Parks (DZ)<br />
28.3*<br />
Nan Wiiaerness(WZ)<br />
0.8%<br />
Crown Forests (DZ)<br />
7.5*<br />
Forest Reserves (WZ)<br />
5.8%<br />
W R - Wildlife Reserves N F • National Forests<br />
WZ - Wet Zone DZ - Dry Zone<br />
- Separate segments indicate Wet Zone<br />
Figure 10.14<br />
improved institutional efforts will be necessary, as discussed<br />
below.<br />
Knowledge Base and Analytical Capability<br />
Lack of information and analysis constrains sustainable<br />
use of biological resources. Current data collection<br />
and monitoring neglect the needs of policy<br />
makers and resource managers to measure conditions,<br />
trends, and values of the resources. We lack information<br />
to help us measure management performance and<br />
to hold institutions accountable for their actions in<br />
protected areas and in planning and implementing environmentally<br />
significant development projects.<br />
In response, scientific studies must document the<br />
extent, species composition, and ecological dynamics<br />
of the biological systems to determine trends in biological<br />
productivity, resilience, and current and potential<br />
economic and social values. Such data should provide<br />
bases for more realistic computation of how people<br />
benefit from conserving biological resources, and how<br />
conservation promotes economic efficiency as well as<br />
intergenerational equity.<br />
I<br />
I<br />
I<br />
I<br />
I<br />
I<br />
I<br />
I<br />
I<br />
I<br />
l!<br />
I<br />
I<br />
I<br />
I<br />
I<br />
I<br />
I<br />
I
II<br />
I<br />
I<br />
6 -<br />
Extent in Sq km (Thousands)<br />
Biological Diversity 233<br />
Trends in Establishment of<br />
Protected Areas<br />
1938 1947 1066 1972 1983 1990<br />
Providing Economic Incentives<br />
Although biological resources are of immense economic<br />
value, their conservation is only possible if their<br />
economic values are appreciated by local communities.<br />
Yet local communities often lack opportunities and<br />
incentives to participate in the sustainable use of biological<br />
resources.<br />
Local rights to collection of non-timber forest<br />
products and other natural products can provide the<br />
basis for sustainable community management and increased<br />
local incomes. The promotion of low resource<br />
impact, high revenue ecotourism can provide economic<br />
incentives for local people to protect biological diversity.<br />
Expanding Awareness<br />
A fundamental barrier to conservation of biological<br />
diversity is the fact that people who earn immediate<br />
benefits from exploiting these resources do not pay the<br />
social and economic costs of the resource's depletion.<br />
Methods can be developed to quantify the direct<br />
and indirect values of biological and genetic resources.<br />
These values can be translated into meaningful terms<br />
National I'.uks Other Protected Ares<br />
Figure 10.15<br />
at the local community level. At the national level the<br />
inclusion of biological resources as a capital stock in<br />
national income accounts, provides opportunity for<br />
doing so.<br />
Promotion of Cross-sectoral Collaboration<br />
Numerous government agencies manage biologi-<br />
cal resources in Sri Lanka, including all the agencies<br />
concerned with land and water. Wetlands fall within<br />
the jurisdiction of at least ten or more state agencies.<br />
Genetic resources of cultivated crops and livestock fall<br />
within the purview of many other agencies and minis-<br />
tries. Responsibilities for biological resources, al-<br />
though clearest for forests and wildlife preserves,<br />
remain highly fragmented.<br />
Many of these problems can be solved if agencies<br />
share information, establish common objectives, and<br />
arrive at common définitions of problems and solu-<br />
tions. Program coordination and development of ade-<br />
quate staff, budgets and other resources can follow<br />
these critical initial actions.
234 Biological Diversity<br />
Strengthening Protected Area Management<br />
Protected areas remain the most valuable tool for<br />
preservation of species and ecosystems. Although expanding<br />
protected area coverage remains important,<br />
the immediate challenge is to improve the management<br />
of existing areas.<br />
Additional staff training, facilities for basic<br />
monitoring, and incorporation of local people in<br />
management and low-impact tourism are among the<br />
critical needs that can be addressed through proposals<br />
to donor agencies.<br />
Policy Shifts<br />
Government policies are a direct cause of depletion<br />
of biological resources, here as elsewhere, often<br />
despite good intentions. Policies on land tenure, soil<br />
conservation, agricultural development, forest<br />
management, and many other less obvious subjects<br />
directly or indirectly affect sustainable biological diversity.<br />
Opportunities can be explored to increase incentives<br />
for landowners to protect long-term biological<br />
resources. For example, removal of subsidies for pesticides<br />
and agricultural chemicals can help reduce<br />
overuse of fertilizers that pollute soil and aquatic systems.<br />
Water quality standards for streams, estuaries<br />
References<br />
Abeywickrama, B.A. (1955). The origin and affinities of the flora of<br />
Ceylon. Proc. Ceylon Association for the Advancement of<br />
Science Sessions, pp. 99-121.<br />
Abeywickrama, B.A. (1987). The threatened plants of Sri Lanka.<br />
UNESCO - Man & the Biosphere National Committee for Sri<br />
Lanka. Publication No. 16. Natural Resources, Energy and<br />
Science Authority of Sri Lanka.<br />
Ashton, P.S. and Gunatilleke, CV.S. (1987). New light on the plant<br />
geography of Ceylon. I • Historical Plant Geography. Journal<br />
of Biogeography, Vol. 14. pp. 249-285.<br />
De Zoysa, N.D.; Gunatilleke, C.V.S.; and Gunatilleke, I.A.U.N.<br />
(1985). Comparative vegetation studies in undisturbed and<br />
selectively logged sites in Siriharaja. Proc. 41st Annual Sessions<br />
of Sri Lanka Association for Advancement of Science,<br />
Mimeograph.<br />
and other waters can be established that are backed up<br />
by combined penalties and incentives for polluters.<br />
Long-term tenure, or full ownership, may also create<br />
promising incentives. Short-term tenure rights can discourage<br />
long-term investments in natural resource<br />
management in favor of short-term payoffs.<br />
Incorporating Values into<br />
Economic Planning<br />
Environmental impact assessment is one of the<br />
most valuable tools for incorporating biological diversity<br />
and environmental considerations into economic<br />
development planning and implementation. Its use requires<br />
skills largely lacking within the public and private<br />
sector.<br />
Training, both short- and long-term, can help<br />
government agency and private sector staff to analyze<br />
development proposals and alternatives. It can focus<br />
on promoting broad understanding of events and impacts<br />
causing significant environmental changes, how<br />
impacts can be measured, in economic as well as environmental<br />
and social terms, and how to grapple with<br />
data gaps concerning biological resources. Agency<br />
heads can be made more familiar with the value of<br />
natural resource analyses and the importance of effective<br />
monitoring and implementation.<br />
Evans, D. (1981). Threatened freshwater fish of Sri Lanka. Extract<br />
from Red Data Book (Pisces). IUCN Conservation Monitoring<br />
Centre, Cambridge.<br />
Gunatilleke, CV.S.; Gunatilleke, I.A.U.N.; and Sumithrarachchi, B.<br />
(1987). The woody endemic species of the wet lowlands of Sri<br />
Lanka and their conservation in botanic gardens. Botanic<br />
Gardens and the World Conservation Strategy, eds D. Bamwell,<br />
O. Hamman, V. Heywood and M. Synge. Academic Press,<br />
London, pp. 183-196.<br />
Gunatilleke, CV.S. and Wijesundara, D.S.A. (1982). Ex-situ conservation<br />
of woody plant species in Sri Lanka. Phyta, Journal of<br />
the Botanical Society of the University of Peradeniya, Vol. 2,<br />
No. 1.<br />
Gunatilleke, LA.U.N. and Gunatilleke, CV.S. (1990). Fioristic richness<br />
in Sri Lanka. Conservation Biology, Vol. 4. No. 1. pp.<br />
21-3L<br />
I<br />
I<br />
I<br />
I<br />
I<br />
I<br />
I<br />
I<br />
I<br />
I<br />
I<br />
I<br />
I<br />
I<br />
I<br />
I<br />
I<br />
I<br />
I<br />
I<br />
I
I<br />
I<br />
I<br />
I<br />
I<br />
I<br />
I<br />
I<br />
I<br />
I<br />
i<br />
i<br />
I<br />
i<br />
I<br />
i<br />
Kotagama. S.W. (1989). Animal diversity in tropical forests. Proc. of<br />
regional training workshop on the ecology and conservation of<br />
the tropical humid forests of the Indomalayan realm. Natural<br />
Resources, Energy and Science Authority of Sri Lanka, pp.<br />
151-167.<br />
McKay, CM. (1973). Behavior and ecology of the Asiatic elephant<br />
in south-eastern Ceylon. Smithsonian Contribution to Zoology,<br />
No. 125.<br />
NAS (1980). Research priorities in tropical biology. Committee on<br />
Research Priorities in Tropical Biology. National Academy of<br />
Sciences, Washington D.C. 116 pp.<br />
Biological Diversity 235<br />
Pceris. C.V.S. (1975). The ecology of endemic tree species of Sri<br />
Lanka in relation to their conservation. Ph.D. Thesis, University<br />
of Aberdeen. U./JC<br />
Senanayake, F.R. (1980). Biogeography and ecology of the inland<br />
fishes of Sri Lanka. Ph.D. dissertation, University of California,<br />
Davis, California.<br />
Sumithraarachchi, B. (1986). A report on steps taken to conserve<br />
orchidaceae in Sri Lanka. Phyta, Journal of the Botanical Society<br />
of the University of Peradeniya, Vol. 3, No. 1. pp. 26-41.<br />
Whitmore,T.C. (1984). Tropical rainforests of the Far East. Oxford<br />
. University Press.
236<br />
A typical fishing harbor along the west coast, where fishing is predominant during the northeast monsoon<br />
(from December to March)<br />
I<br />
I<br />
I<br />
I<br />
I<br />
I<br />
I<br />
I<br />
I<br />
I<br />
I<br />
I<br />
I<br />
I<br />
I<br />
I<br />
I<br />
I<br />
I<br />
I<br />
I
I<br />
I<br />
I<br />
I<br />
I<br />
I<br />
I<br />
I<br />
I<br />
P<br />
I<br />
T<br />
11 Coastal and Marine Resources<br />
Sri Lanka's coastline circles along about 1,585 kilometers<br />
of sandy beaches, extensive lagoons and estuaries,<br />
mangroves, coastal marshes and dunes. Seaward<br />
of the coastline lie reefs of coral or sandstone and<br />
shallow beds of coastal and estuarinc scagrass. Beneath<br />
and beyond extends the continental shelf. Except<br />
in the north, where it links Sri Lanka and India, this<br />
237<br />
submerged plateau reaches outward to 20 kilometers,<br />
before it falls away through the continental slope to the<br />
deep seafloor. The continental shelf covers 26,000<br />
square kilometers, or nearly half the land area of Sri<br />
Lanka. Sri Lanka's Exclusive Economic Zone covers<br />
an even larger area: over 230,000 square kilometers of<br />
the ocean. (See Figure 11.1)<br />
Coastal and Maritime Jurisdication of Sri Lanka<br />
INDIA .-g<br />
CAPECOMORIN ^/ ''Wt ^^r<br />
/<br />
( INDIA S<br />
\<br />
\<br />
\<br />
/<br />
ocf>«/w<br />
^ ^ ^ ^<br />
fXCtt/S/Vf<br />
ECONOMIC ZONE<br />
Figure 11.1<br />
y<br />
•\<br />
\<br />
\<br />
\<br />
\<br />
\<br />
\<br />
\<br />
\<br />
\<br />
\<br />
\<br />
'\<br />
i i<br />
L<br />
/?
238<br />
Coastal Resources<br />
SIGNIFICANCE <strong>OF</strong> THE COASTAL REGION<br />
• It contains 34 percent of the country's total population and represents 24 percent of the land area.<br />
• It contains the country's principal city of Colombo, the largest six of the twelve Municipal Councils<br />
and 19 of the 39 Urban Councils* .<br />
• Its marine fishery supplied97 percent of total fish production— during 1987-1988 two-thirds of the<br />
animal protein consumed. ^-><br />
•- Its exports of fish and aquatic products earned 576 millioitrupees in 1987 and 825 million rupees in<br />
• , 1 9 8 8 . . . - - :••'.. •;.•• • • ' •'•:'.• , , ; • • • • • • •'• ' ? - : • • • • ' > • • : \ ; ^ • • : • > > - . : ' : • - • • •<br />
• Sun, sand and surf of its sea beaches are Sri Lanka's major tourist attractions that also offer<br />
recreational opportunities for her people.<br />
• Its natural coastal habitats — coral reefs, estuaries and lagoons, mangroves, tidal flats (salt marshes),<br />
and barrier.beaches — are immensely productive, essential fornational growth and richreservoirs of<br />
genetic resources. • " ^-^^.^^t^S^i^vv-^;" '' ' :<br />
• It hosts over 80 percent of the industrial units located in and around Colombo alone, and several other<br />
major units elsewhere, many of which are highly polluting^ .<br />
ECONOMIC AND SOCIAL<br />
SIGNIFICANCE<br />
Over the past five centuries, following foreign occupation,<br />
the country's development has been closely<br />
linked to maritime affairs. Expanding international<br />
trade and commerce accelerated population shifts to<br />
the coasts. Since Independence (1948), coastal settlements<br />
grew in size and economic importance, particularly<br />
in the south, southwest and west. By 1981 the<br />
census recorded 5.04 million people, or 34 percent of<br />
the total population, living in coastal Assistant Government<br />
Agent (AGA) divisions, of whom 45 percent lived<br />
in urban areas. Fishing, tourism, industry, and agriculture<br />
sustain the growing economy of the coastal region,<br />
defined as the AGA Divisions with maritime boundaries<br />
(see box).<br />
Fishing is the predominant coastal economic activity<br />
in the eastern and northeastern coasts during the<br />
southwest monsoon (from April to August) and in the<br />
southern and western coasts during the northeast monsoon<br />
(from December to March). The marine fishery<br />
industry provides full employment to about 80,000 persons,<br />
part-time employment to about 10,000 more, and<br />
indirect employment to another 5,000, contributing<br />
about 1.9 percent to the GDP in 1988. Marine fisheries<br />
contribute most (65 percent) of the animal protein and<br />
13 percent of the total protein consumed by Sri Lankans.<br />
Export of Gsh and aquatic products drew an<br />
average 616 million rupees in foreign exchange in 1980-<br />
1987, or U8 percent of Sri Lanka's total non-traditional<br />
export earnings. Total export earnings in 1988 were 825<br />
million rupees.<br />
I<br />
I<br />
I<br />
I<br />
I<br />
I<br />
I<br />
I<br />
I<br />
I<br />
I<br />
I<br />
I<br />
I<br />
I<br />
I<br />
I<br />
I<br />
I<br />
I
I<br />
i<br />
I !<br />
I<br />
I<br />
I<br />
Ten Fishery harbors serve large fishing vessels<br />
with most traditional vessels and smaller Fiberglass<br />
boats using beach landings close to fishing villages.<br />
Fishermen also use beaches to fish, mend nets, repair<br />
boats and build temporary dwelling units.<br />
Coastal agriculture contributed 17 percent to total<br />
agricultural GDP in 1988. Paddy accounted for 70<br />
percent, coconut 26 percent, and rubber 2 percent of<br />
the coastal agricultural GDP. About 55,900 hectares of<br />
coconut are currently cultivated in the coastal region<br />
defined by the coastal AGA divisions. Small areas of<br />
tea are found in the coastal divisions of Galle, Matara,<br />
Colombo and Kalutara regions, and cinnamon is grown<br />
in the coastal divisions of Galle, Matara and Kalutara<br />
districts.<br />
Tourism in Sri Lanka has primarily focused on its<br />
scenic sandy beaches and coastal estuaries and lagoons.<br />
About 85 percent of tourist revenue comes from facilities<br />
in coastal areas, supplemented by the diversity of<br />
attractions in the interior cultural triangle. Today over<br />
75 percent of graded hotels and over 80 percent of the<br />
hotel rooms are located along the coast.<br />
Once among the fastest growing sectors, tourism<br />
declined steeply during civil unrest in 1983-1989. It<br />
peaked in 1982, with an estimated 407,230 arrivals and<br />
revenues of 3,050 million rupees, but then came a sharp<br />
decline in arrivals and revenue until a sharp upward<br />
trend developed in 1990 (see Figure 11.2). Both high<br />
and low projections of tourism to 2000 anticipate over<br />
1 million annual arrivals.<br />
Pleasure travel accounts for about 92 percent of<br />
the total arrivals in Sri Lanka. Business and official<br />
travel accounts for about 6 percent, while arrivals for<br />
other purposes such as social, religious, cultural and<br />
educational account for the balance.<br />
Wildlife resources add to coastal tourist potential.<br />
Two large National Parks, Wilpattu and Ruhuna (better<br />
known as Yala), border the coast. Wilpattu, closed<br />
in recent years, extends over about 30 kilometers along<br />
the northwest coast, and Yala borders the southern<br />
coast for over 50 kilometers. Several lagoons and<br />
coastal wetlands serve as bird sanctuaries. A marine<br />
sanctuary was declared in Hikkaduwa in 1979, although<br />
without enforcement or sanctuary management.<br />
Coastal Resources 239<br />
PRESENT CONDITIONS<br />
The extent and variety of coastal habitats that provide<br />
such important economic and environmental values<br />
are displayed in Figure 113. All of these values are<br />
being diminished by various actions that have become<br />
significantly more serious over the past twenty years.<br />
Coastal erosion has threatened coastal investments,<br />
and pollution and competition for resources have degraded<br />
coastal systems in ways that jeopardize longterm<br />
tourist, fishery, and other sustainable economic<br />
and environmental values. Demographic and development<br />
trends highlight needs for increased attention to<br />
each of these problems and their cumulative effects.<br />
Coastal Erosion. Erosion (see Chapter on Land<br />
Resources) endangers Sri Lanka's beaches and adjoining<br />
coastal land. Wind, waves and currents constantly<br />
pound the coasts, diminishing beaches and eroding<br />
bluffs. Effects vary from place to place, but they are<br />
aggravated by sand mining, coral mining, removal of<br />
vegetation and poorly sited or designed buildings, harbors<br />
and coast protection structures. Since 1981 the<br />
government has carried out major coastal erosion protection<br />
programs with foreign donor support.<br />
Sand Mining. Mining of sand from beaches and<br />
especially river mouths is causing increasingly serious<br />
coastal erosion and salt water intrusion, despite permit<br />
controls exercised by the Coast Conservation Department.<br />
A CCD study found that some 500,000 cubes<br />
(1,415,000 cu. ft.) of sand were mined in the coastal<br />
stretch from Puttalam to Dondra Head in 1984 - nearly<br />
all (97 percent) from rivers, and nearly two-thirds of it<br />
from the Kelani Ganga and Maha Oya. Mining provides<br />
jobs, at generally high wages, for about 1,900 sand<br />
miners and support for about 6,000 individuals. It also<br />
seriously cuts sand supplies that maintain beaches and<br />
shorelines, protect property and roads along the rivers,<br />
and prevent intrusion of salt water into the ever-deepening<br />
rivers. Damage to flood protection bunds in and<br />
near the Kelani Ganga has been attributed to excessive<br />
sand mining near the bunds.<br />
Habitat Degradation and Overexploitation of Resources.<br />
Coastal habitats are under enormous pressure<br />
because many are small and especially vulnerable<br />
to degradation. Puttalam Lagoon, for example, is Sri
240<br />
150 -<br />
100-<br />
50-<br />
Coastal Resources<br />
Tourist Arrivals and Earnings<br />
$ Millions Arrivals Thousands<br />
I I I I \ 1 I i I I I ! I I i I I I I I I T I I<br />
75767778798081828384858687888990 9192939495969798 2000<br />
Year<br />
—+— Tourist Arrivals -&~<br />
Earnings US $<br />
H - High Projection L * L °w Projection<br />
Source : P. Seneviratne. Coastal 2000 Report<br />
Lanka's largest estuary, but it is only about 20 kilometers<br />
long and 2 kilometers at its widest point, covering<br />
36,426 hectares. The low tides along our coasts (about<br />
75 centimeters) restrict most mangroves to narrow belts<br />
along the lower reaches of rivers and narrow edges of<br />
lagoons and estuaries, so there are no large mangrove<br />
forests. Those that exist have become severely reduced<br />
by overuse, abuse, and conversion to other uses.<br />
Coral reefs have similarly become badly degraded and<br />
their productive habitat diminished.<br />
Coastal Pollution. Major sources are oil pollution<br />
from shipping and fishing craft, discharge of industrial<br />
effluents, sewage and domestic waste. Five miles off<br />
the southern and southwestern coasts a major international<br />
shipping route carries estimated annual traffic of<br />
over 5,000 tankers, posing risks of an accidental oil spill.<br />
Cleaning of fuel tanks in and around ports causes minor<br />
discharges that may account for frequent tar balls on<br />
southwest beaches.<br />
Figure 11.2<br />
H<br />
500<br />
400<br />
300<br />
200<br />
100<br />
Fecal pollution of beaches and coastal waters (for<br />
example, at Hikkaduwa) comes from temporary housing<br />
settlements near the beach or hotels that illegally<br />
discharge raw sewage. Pesticides and fertilizer from<br />
agriculture and inland industrial activities also cause<br />
coastal pollution.<br />
Coastal and inland industries contribute chemical,<br />
heavy metal, and organic pollutants. Major sources of<br />
industrial pollution include the Valachchenai paper<br />
factory, which sends quantities of waste into the<br />
Batticaloa Lagoon, and the Embilipitiya paper factory,<br />
which similarly pollutes the Walawe Ganga estuary.<br />
The Lady Catherine Industrial Estate sends large quantities<br />
of industrial waste into the Lunawa Lagoon. The<br />
lake opens to the sea but sand bars frequently block its<br />
mouth. Once a flourishing fishing lagoon, now it is a<br />
mosquito-ridden stagnant body of water. At the Kelani<br />
Ganga estuary pollutants come from a large number of<br />
tanneries and other industrial plants. Industrial water<br />
I<br />
I<br />
I<br />
I<br />
I<br />
I<br />
I<br />
I<br />
I<br />
I<br />
I<br />
I<br />
I<br />
I<br />
I<br />
I<br />
I<br />
I<br />
I<br />
I
I<br />
I i<br />
!<br />
I !<br />
i i<br />
I ><br />
I<br />
District<br />
Colombo<br />
Gampaha<br />
Puttalam<br />
KJIinochchi<br />
Jaffna<br />
Mullaitivu<br />
Trincomalee<br />
Batticaloa<br />
Ampara<br />
Hambantota<br />
Matara<br />
Galle<br />
Kalutara<br />
TOTAL EXTENT<br />
Source: CCD Internal Report No. 13: Report on the preparation coastal habitats, 1986<br />
OCA -,<br />
£OU<br />
200 -<br />
150-<br />
100-<br />
50 -<br />
r» -<br />
Coastal Resources 241<br />
Extent of Coastal Habitats by District in Hectares<br />
Mangroves<br />
39<br />
313<br />
3,210<br />
770<br />
2,276<br />
428<br />
2,043<br />
1,303<br />
100<br />
576<br />
7<br />
238<br />
12<br />
12189<br />
Thousands<br />
^ ^<br />
U i i<br />
77 78<br />
Salt<br />
Marshes<br />
497<br />
3,461<br />
4.975<br />
4,963<br />
517<br />
1,401<br />
2.196<br />
127<br />
318<br />
-<br />
185<br />
23819<br />
•<br />
Dunes<br />
-<br />
2,689<br />
509<br />
2,145<br />
-<br />
-<br />
-<br />
357<br />
444<br />
-<br />
-<br />
4<br />
7606<br />
Figure 11.3<br />
Beaches<br />
Barriers<br />
And Spits<br />
112<br />
207<br />
2,772<br />
420<br />
1.103<br />
864<br />
671<br />
1,489<br />
1,398<br />
1.099<br />
191<br />
485<br />
77<br />
11800<br />
Fish Production 1977 -<br />
of Metric Tons<br />
79 80 81<br />
CH Coastal<br />
Source: Fisheries Development Plan,<br />
Ministry of Fisheries and Aquatic<br />
Resources<br />
i t i<br />
82 83 84<br />
Year<br />
•• Offshore S<br />
Figure 11.4<br />
Lagoons<br />
And Basins<br />
Estuaries<br />
3.442<br />
39,119<br />
11.917<br />
45,525<br />
9,233<br />
18,317<br />
136,822<br />
7,235<br />
4,488<br />
-<br />
1,144<br />
87<br />
158017<br />
1988<br />
Other<br />
Water<br />
Bodies<br />
412<br />
205<br />
3,428<br />
1,256<br />
1,862<br />
570<br />
2,180<br />
365<br />
1,171<br />
1,526<br />
234<br />
783<br />
476<br />
18839<br />
85 86 87 88<br />
242<br />
000 MT<br />
350-<br />
300-<br />
250-<br />
aoo-<br />
150-<br />
100-<br />
50-<br />
0-<br />
90<br />
91<br />
Coastal Resources<br />
Estimated Demand &<br />
Targets (1990 -<br />
CD Coûtai S3 Offahora<br />
Sourea : National Flahaflaa Davalopmanl<br />
Plan 18S0 - 1884<br />
pollution occurring inland from the coastal zone is now<br />
subject to permit regulation by the Central Environmental<br />
Authority.<br />
Marine Fishery Resources<br />
Resources and Production. For management purposes<br />
marine fish resources are classified as coastal<br />
(within 40 kilometers of the coast), offshore (40-100<br />
kilometers), and deep sea (beyond 100 kilometers).<br />
Today the coastal fisheries provide nearly all (97<br />
percent) of the marine fish production, employment<br />
(90 percent) and foreign exchange earnings (nearly 100<br />
percent). As shown in Figure 11.4 peak production<br />
since 1977 occurred in 1983 with a harvest of 184,049<br />
tons. Production declined thereafter, primarily because<br />
of civil unrest in the two major fisheries in the<br />
north and east.<br />
The last data available — the Fridtjof Nansen Fishery<br />
Survey in 1978-1980 ~ indicates that areas of highest<br />
fish concentrations are found inside or close to the<br />
continental slope. Highest fish densities occur from<br />
Negombo to Galle, the banks off Hambantota and from<br />
Trincomalee to Mullaitivu. The survey estimated that<br />
annual sustainable yield of coastal fisheries is 250,000<br />
tons—about two-thirds of it pelagic species and the rest<br />
demersal and semidemersal species. The most avail-<br />
92<br />
Ysar<br />
Figure 11.5<br />
Production<br />
1994)<br />
93 94<br />
• OMP 3*a -"- Oamand Lina<br />
able small pelagic fish are sardines, Indian mackerel,<br />
and herrings. Large pelagics include the Spanish<br />
mackerel, tuna, barracudas or pompanos. Demersal<br />
species include prawns, silverbellies, moonfish, ribbonfish<br />
and large demersals such as breams, groupers and<br />
snappers.<br />
By 1988 traditional fishing boats still dominated the<br />
fleet of 28,000, but 46 percent were mechanized. As in<br />
many other tropical fisheries, many species are caught<br />
in a single fishery using a variety of gear. Abojut 80<br />
percent of total coastal production comes from the gill<br />
net fishery, using both mechanized and nonmechanized<br />
craft. The once dominant beach seine fishery that contributed<br />
three-fourths of the total production in the<br />
1940s has declined to about 11 percent, as other methods<br />
have become more efficient.<br />
Projected Demand and Production Targets. The<br />
government's Fisheries Development Plan seeks to improve<br />
nutrition through increased fish production. At<br />
present per capita fish consumption of 17.52 kilograms,<br />
demand for fish is projected to increase 9 percent from<br />
1990-1994. The Ministry of Fisheries proposes to meet<br />
these demands and reduce projected imports with a<br />
25 percent increase in fish production, primarily from<br />
coastal fisheries (Figure 11.5).<br />
I<br />
I<br />
I<br />
I<br />
I<br />
I<br />
I<br />
I<br />
I<br />
I<br />
I<br />
I<br />
I<br />
I<br />
I<br />
I<br />
I<br />
I<br />
I<br />
I<br />
I
I<br />
2500<br />
2000-<br />
1500-<br />
Value in Millions of Rupees<br />
Coastal Resources 243<br />
Imports & Exports of Fish<br />
& Aquatic Products<br />
85 86 87 88 90 91 92 93 94<br />
Year<br />
Value Exports<br />
Source : NationI Fisheries Oeveiopment<br />
Plan 1990 - 1994<br />
300<br />
MT<br />
Value Imports Export Targets<br />
Figure 11.6<br />
Trends in the Trade of Ornamental Fish<br />
Volume (MT) Value (Rs.M)<br />
Rs. M 100<br />
81 82 83 84 85 86 87 88<br />
Year<br />
Source : Ministry of Fisheries and<br />
Aquatic Resources<br />
Figure 11.7<br />
L 80<br />
-60<br />
-40<br />
-20
244 Coastal Resources<br />
KANOAKULIYA ,<br />
(NEAR SHORE CORAL<br />
REEF)<br />
KANOAKULIYA<br />
ISAHO SHORE REEF)<br />
KANOAKULIYA-<br />
(SAHO SHORE REEF)<br />
TALAWILA—<br />
ICORAL REEF)<br />
TALAWILA-<br />
IS AND SHORE REEF)<br />
WELLAWATTA<br />
ISANO SHORE REEF)<br />
AMBALANGOOA<br />
(GRANITE ANO SANO<br />
SHORE REEF)<br />
AKURALA<br />
I NEAR SHORE CORAL<br />
REEF)<br />
HIKKAOUWA-<br />
INEAR SHORE CORAL<br />
REEF)<br />
SOURCE: H AHA<br />
BONAVISTA<br />
(NEAR SHORE CORAL<br />
REEF) /<br />
UNAWATUNA<br />
(NEAR SHORE CORAL REEF)<br />
Condition of Coral Reefs<br />
WELIGAMA f POLHENA<br />
(NEAR SHORE CORAL / (NEAR SHORE CORAL<br />
REEF) I REEF)<br />
LEdlND<br />
V. LIVE CORAL<br />
V. DEAD CORAL<br />
V. S<strong>OF</strong>T CORAL<br />
I I V. SANO/SÜBSTRAT<br />
•Littl«8
Chllow<br />
Lagoon<br />
Neçombo 4 2<br />
Lagoon<br />
KaluKra 39<br />
Logoon<br />
Madampm 37<br />
•y<br />
Thondoimannar<br />
Lagoon<br />
Raigama Lak» Lak» ,<br />
Wllgamo Bay 3'*' 33<br />
Coastal Resources 245<br />
3 NonthiKadal<br />
4 Nayaru Lagoon<br />
Figure 11.9<br />
Basin Estuaries and Lagoons<br />
5 Kokklloi Lagoon<br />
Kuchchanli<br />
7 Ptriyokorochehi<br />
8 Sinnakaraehetii<br />
UppuvHI<br />
•Koddlyar Bay<br />
12 wakontal<br />
13 Ullaekall» .<br />
Lagoon<br />
14 Up pur Lagoon<br />
15 Vandttoos Bay<br />
16 Batticaloa<br />
Lagoon<br />
17 y<br />
Kalapuwa<br />
18 Thirukkovil<br />
I Kalapuwa<br />
19 Komar»<br />
Kalapuwa<br />
Arugam Bay<br />
•21 Okandawara<br />
Bay<br />
22 Palutupan Mahaltvoyo<br />
'23 Bundala Lmiaya<br />
v>« Embilikola Lnoya<br />
: \ "2<br />
Dondra Kalapuwa 'R*kawa Kalapuwa<br />
5 MalaloLavoya<br />
\ 26 KoholankoloLtvaya<br />
\ \ -ï* 27 Mono Ltvaya<br />
31 30 29 ^Karagan L»voyo<br />
' \ %unama Koiapuwa<br />
Ttalamiriyo Kalapuwa<br />
Kahanda Kalapuwa
246<br />
Current Status of Marine Resources. It has been<br />
over ten years since Sri Lanka has assessed its fish stock.<br />
Lack of data and inability to assess trends with accuracy<br />
seriously affect fishery planning and management.<br />
NARA's research has pointed to opportunities for expanded<br />
fisheries, particularly in the deep sea, and<br />
resource constraints, particularly closer in.<br />
Large Pelagics<br />
• Large pelagics (skipjack tuna, yellowfin tuna, bill<br />
fish, shark, seerfish etc.) in the coastal region are<br />
already exploited at an optimal level. However,<br />
small tunas (kawakawa and frigate tunas) that<br />
mainly inhabit the continental shelf area are not yet<br />
exploited to the maximum sustainable yield.<br />
• The fishery for large pelagics in the offshore/deepsea<br />
area can be expanded. The stock of these<br />
highly migratory species appears healthy, based on<br />
the increasing catch, especially from the purse<br />
seine fishery in the southwest Indian Ocean.<br />
• From exploratory tuna fishing in offshore/deepsea<br />
areas use of multiple gear has resulted in high catch<br />
rates, particularly in the south, with the most profitable<br />
fishing zone 48-160 kilometers off shore.<br />
Small Peiagics<br />
• Sardine stocks (Amblygastersimt ) on the west coast<br />
are exploited at an optimal level and no increased<br />
effort should be permitted, meaning no more<br />
boats, in the small meshed gillnet fishery.<br />
• In contrast, sardine stocks in the south and southwest<br />
are not exploited at the maximum level. Fishermen<br />
can be encouraged to use the small meshed<br />
gill nets for sardines in this area.<br />
• The purse seine fishery in the southwest appears to<br />
be maintained at the correct level. The purse<br />
seines operating in this area have not diminished<br />
the sardine stock, the main species caught in this<br />
fishery. But because purse seines are far more<br />
efficient than gill nets, close monitoring is essential.<br />
Coastal Resources<br />
Crustaceans<br />
• Lobster production in the south declined by nearly<br />
50 percent, from 200 metric tons in 1986 to 110<br />
metric tons in 1988, indicating serious overexploitation.<br />
About 25 percent of the lobsters<br />
landed are under-sized, and more than 50 percent<br />
of those caught during August-September are eggbearing.<br />
Trammel nets (Disco nets) cause considerable<br />
damage to the lobster resources and NARA<br />
has recommended that they be prohibited in the<br />
lobster fishery.<br />
• Prawns on the west coast are exploited at an optimal<br />
leveL The Maximum Sustained Yield for<br />
Negombo is about 152.6 tons and the number of<br />
boat days is 21,200. The present level of prawn<br />
catch in the Kalpitiya Lagoon mouth area is also<br />
sustainable.<br />
Foreign Trade in Fisheries and Aquatic Products.<br />
Sri Lanka's foreign trade in fisheries and fishery products<br />
is relatively insignificant. Exports consist of<br />
prawns, lobsters, crabs, ornamental fish, shark fins, all<br />
of which come from the marine sector. Imports consist<br />
of canned, dried, and maldive fish. Trends in exports<br />
and trade balance (Figure 11.6) show an increasing<br />
trend in the value of exports and imports but the trade<br />
balance has remained adverse. The Fisheries Development<br />
Plan 1990-1994 seeks a trade surplus by increasing<br />
exports of fish and fishery products (Figure 11.6).<br />
Ornamental Fishery Resources. The international<br />
aquarium trade has boosted Sri Lanka's ornamental<br />
fishery exports (Figure 11.7). Ornamental fish<br />
exports rate third highest in terms of volume and value<br />
of fishery exports (behind prawns and lobsters).<br />
Nearly 70 percent of the aquarium fish exported are<br />
brackishwater or marine species. Of the marine species<br />
exported approximately 80 percent are fin fish<br />
while the balance are invertebrates — corals, bi-valves,<br />
holothurians, echinoderms, and so forth. A few large<br />
traders dominate; a list completed in 1984 indicated<br />
that of the 26 exporters, 3 who dealt primarily with<br />
marine species shared nearly 80 percent of the export<br />
trade.<br />
Approximately 139 species of marine fish are exported.<br />
Included are 29 species of butterfly fish, 13<br />
I<br />
I<br />
I
I<br />
i !<br />
Coastal Resources 247<br />
Coral Mining<br />
For years coral reefs along Sri Lanka's southwestern coasts have been subject to large-scale destruction<br />
from mining of coral for the lime required in the building industry. Activity is particularly intense in<br />
Akurala, Seenigama, Kahawa, Warallana and Totagamuwa, between Talpe and Ahangama, Mirissa and<br />
Madihe, and in the Rekawa village. Coral reef destruction also occurs in certain areas along the east coast.<br />
Mining reduces coral reef barriers against wave erosion, destroys habitat of a large numbers of marine<br />
fauna and flora, including economically important fish species, and can eliminate potential for sustainable<br />
tourism.<br />
Mining for coral also occurs inland, where large deposits can be found along the southwestern coastal<br />
belt. A survey carried out in 1984 by the CCD from Ambalangoda to Dikwella revealed that 18,000 tons<br />
of coral are collected annually to supply the lime industry. Of this, 30 percent is from mining the reef, 12<br />
percent is coral debris and 58 percent is obtained from inland deposits&xdo-economic aspects<br />
A direct benefit from co'ral mining is its generation of employment in mining, collection, transportation,<br />
operation of lime kilns, and the gathering of fuel wood. A survey carried out by the CCD in 1990<br />
from Ambalangoda to Hambantota revealed that nearly 2,000 persons were dependent on inland and<br />
offshore coral mining and related activities. Over 400 lime kilns exist in the area, of which 178 are located<br />
within the coastal zone under the Coast Conservation Act — 300 meters inland of the coastline. The<br />
majority (90 percent) of the people are aware that coral mining is prohibited by law, but they continue<br />
because they have no other means of income or because they do not believe in or care about its adverse<br />
environment impacts.<br />
Lime production is the main source of income of the people in the Rekawa village, where about 80<br />
percent of the families are directly or indirectly involved. This, however, is a recent phenomenon. Since<br />
1970, severe drought resulted in the decline of agricultural activities and fanners turned to lime production<br />
instead. Subsequently, due to declining fishery productivity of the Rekawa Lagoon, large numbers of<br />
fishermen also joined the industry.<br />
Legal and Enforcement Aspects<br />
The Coast Conservation Amendment Act of 1988 imposed severe restrictions on the removal,<br />
possession, storing and processing of coral and the operation of lime kilns within the Act's 'Coastal Zone.'<br />
Enforcement was immediately hindered because of the socio-economic distress caused to many families<br />
who depend on these activities for their livelihood.<br />
Unsuccessful efforts have been made for several years to discourage coral mining. Coral miners have<br />
not yet been persuaded to take up other less lucrative employment, for the CCD lacked the mandate or<br />
the resources to provide employment alternatives. Among the agencies that can help do so the coral<br />
miners' problem has had low priority. Moreover, to enforce the reef protection provisions, the CCD has<br />
to rely on local police action. Faced with the favorable returns from reef mining, available at least in the<br />
short term, CCD has been unable to obtain the necessary cooperation for enforcement from local political<br />
and administrative leaders.<br />
In 1990 fresh efforts were launched to provide alternate employment, with the active involvement of<br />
the Southern Provincial Council and stringent enforcement by the police authorities. Several families in<br />
the Rathgama electorate have already been provided with alternate land and facilities for employment.<br />
At the same time police action has intensified against those breaking the reef. Court action has been<br />
initiated against several operating lime kilns. Yet the problem is far from being solved.<br />
Certain donor agencies have indicated that urgent action is necessary to stop further destruction of<br />
coral reefs if funding is to continue for CCD programs, especially for construction_of coast protection<br />
structures. Opposition pp to coral mining g exists within the local rammnnity ty not involved in it, , due to increased<br />
environmental awareness. These voices h have helped h provoke interest by the provincial administration ii in<br />
halting coral mining. They have become a growing factor favoring CCD's efforts to stop further reef<br />
degradation. • : "r -'" ~ ' '.'''' 'I "' .
248<br />
species of wrasses, 11 species of triggerfish, 10 species<br />
of angelfish and 9 species of surgeonfish.<br />
Ornamental fish collection often occurs near coral,<br />
although fishing in estuaries for some species has increased<br />
during the past few years. Shallow reefs are<br />
fished by skin divers, while deeper areas are exploited<br />
by scuba divers. Collecting is seasonal and dependent<br />
on the monsoons. Fishing occurs in the west and southwest<br />
during November to March or April and in the east<br />
and northeast from May to October. Many collectors<br />
and exporters report that coral reef fish collected for<br />
the aquarium trade are less abundant now than in<br />
previous years, but accurate data must await better<br />
monitoring of reef fish population. From collectors'<br />
reports population of many species is significantly depleted<br />
on a seasonal basis, while other species are being<br />
gradually depleted year by year.<br />
Certain species of reef fish collected for the aquarium<br />
trade have a localized distribution and/or are uncommon<br />
or rare. We do not yet know whether this is a<br />
natural feature of these species or over-exploitation has<br />
caused low density. At least 29 species, including 13<br />
species of butterfly fish, are recorded by collectors as<br />
rare or uncommon. Heavy exploitation could cause<br />
depletion or local extinction.<br />
Coral Reefs<br />
Coral reefs, Sri Lanka's most conspicuous shallow<br />
water marine habitat, are spectacular for the color and<br />
diversity of species they support. At present 171 species<br />
of stony coral have been recorded in the three<br />
major xeef types: coral reefs, sandstone reefs, and boulder<br />
reefs.<br />
Description and Location. Coral reefs are found<br />
mainly as fringing reefs, except for reefs found on the<br />
continental shelf off the northwestern coast, including<br />
the Bar Reef, Vankalai Reefs and Arippu Reef. Fringing<br />
reefs occur around the Jaffna peninsula and adjacent<br />
islands, Kandakuliya southwards to Thalawila, and<br />
from Akurala to Tangalle, excluding Dodanduwa and<br />
Gintota, where the influx of fresh water precludes the<br />
growth of corals. On the eastern coast they extend<br />
southwards to Kalmunai, and in the southeast coral<br />
Coastal Resources<br />
reefs are found on the offshore ridges of Great and I<br />
Little Basses.<br />
Functions and Values. Coral reefs are systems, not<br />
objects — shallow tropical water ecosystems that rank<br />
among the world's most biologically productive and<br />
diverse natural resources. Coral reefs, like tropical<br />
seagrass beds, have primary productivity rates far<br />
greater than terrestrial ecosystems. The open ocean<br />
near coral reefs provides most of the catch for the<br />
demersal fisheries industry and huge quantities of fish<br />
and invertebrates for the marine aquarium trade. Reef<br />
organisms provide medicinally important compounds<br />
and collectively, as reefs, act as natural breakwaters<br />
that reduce coastal erosion. Coral reefs offer us unsurpassed<br />
recreational, educational and research opportunities.<br />
Degradation Trends and Causes. The coral reefs<br />
are being steadily destroyed and degraded, although<br />
surveys conducted by the National Aquatic Resources<br />
Agency indicate their condition, measured as a percentage<br />
of live coral cover, varies significantly by area.<br />
Figure 11.8 displays the high percentages of dead coral<br />
in some locations — about 80 percent at Polhena, nearly<br />
50 percent at Weligama, and about 25 percent at<br />
Hikkaduwa and Akurala. Most of this damage has<br />
occurred over the past ten to fifteen years. Estimates<br />
of coral condition and losses on the east coast have not<br />
been obtained due to civil strife; we only have continuing<br />
anecdotal evidence of loss.<br />
What are the major threats to coral? Reef mining<br />
for manufacturing lime used by the building industry is<br />
the single most destructive action. It has been particularly<br />
intense in the tourist and fishing areas. Large scale<br />
coral mining was also reported on the east coast during<br />
the late 1980s. Efforts to stop the destruction have been<br />
discussed for years, but action has been limited. (See<br />
box oh coral mining.)<br />
Physically damaging fishing methods that also destroy<br />
coral include fishing with explosives, Trammel<br />
nets to catch reef fish and spiny lobsters, and the practice<br />
of breaking coral to net tropical fish. The list of<br />
damaging causes gets longer still: careless glass bottom<br />
boats and anchor chains, clearing of coral reefs for boat<br />
passage, trampling of coral at low tide, souvenir collec-<br />
I<br />
I<br />
I<br />
I<br />
I<br />
I<br />
I<br />
I<br />
I<br />
I<br />
I<br />
I<br />
I<br />
I<br />
I<br />
I<br />
I<br />
I<br />
I<br />
I
I<br />
I<br />
I<br />
I<br />
I<br />
I<br />
I<br />
I<br />
I<br />
j<br />
I<br />
I<br />
I<br />
I<br />
I<br />
I(<br />
I<br />
I<br />
I<br />
I<br />
I<br />
I<br />
tion and sale of coral specimens, and extraction of coral<br />
sand for aquariums or fishes for export.<br />
Coral also dies from less visible causes, including<br />
water pollution from deposition of coconut husks<br />
within reef lagoons.<br />
Coastal Wetlands<br />
Description and location. Coastal wetlands include<br />
the estuaries, lagoons, seagrass beds, mangroves,<br />
and salt marshes that surround Sri Lanka and are supremely<br />
important to the nation at large and to its<br />
coastal inhabitants for food, economic life, and countless<br />
intangible benefits. Each system is under stress<br />
from multiple causes.<br />
Estuaries are partially enclosed bodies of water<br />
having free connections with the ocean and within<br />
which the seawater is measurably diluted with fresh<br />
water from terrestrial runoff. In Sri Lanka estuaries are<br />
either basin estuaries, where rivers discharge into relatively<br />
shallow basins connected with the sea (Puttalam,<br />
Chilaw and Negombo Lagoons), or riverine estuaries,<br />
where rivers discharge directly into the sea through<br />
relatively narrow channels (Kelani, Kalu and Nilwala<br />
Ganga estuaries).<br />
Lagoons are also brackish coastal water bodies, but<br />
they are either permanently separate from the sea or<br />
they connect with the sea only during part of the year.<br />
In fact, many water bodies in Sri Lanka often called<br />
lagoons are really estuaries, including the Negombo<br />
Lagoon, Jaffna Lagoon, Batticaloa Lagoon, Puttalam<br />
Lagoon. True lagoons include Mündel Lake, Bolgoda<br />
Lake, Koggala Lagoon, Mawella Lagoon, Kalametiya<br />
Lagoon, Rekawa Lagoon, Lunawa Lagoon.<br />
Many estuaries and lagoons, shown in Figure 11.9,<br />
are closely linked with the major urban centers along<br />
the coast. As in countless other countries, population<br />
and urban growth around estuaries requires multiple<br />
and demanding estuarine capabilities.<br />
Seagrass beds are composed of rooted, seed-bearing<br />
marine plants (halophytes) occurring in shallow,<br />
sheltered nearshore coastal waters and as underwater<br />
meadows in estuaries and lagoons. Seagrasses and the<br />
associated epiphytes and abundant detritus comprise<br />
Coastal Resources<br />
powerfully productive habitat that supports great communities<br />
of commercially important fish. Although locations<br />
have „ot been precisely mapped, seagrass beds<br />
abound along the coast, most extensively from the<br />
Dutch Bay to the western end of Jaffna peninsula. At<br />
Mannar seagrass beds extend northwestwards towards<br />
Rameswaram Island in India. Seagrass beds prosper in<br />
many basin estuaries and lagoons - Puttalam Lagoon,<br />
Negombo Lagoon, Mawella Lagoon, Koggala Lagoon,<br />
Kokilai Lagoon, Batticaloa Lagoon, and Jaffna Lagoon.<br />
Twelve species of seagrasses have been recorded.<br />
Mangroves are salt tolerant, woody, seed-bearing<br />
plants, occurring along sheltered intertidal coastlines<br />
and in association with estuaries and lagoons. They<br />
range in size from small shrubs to tall trees. Yet mangroves<br />
are limited b Sri Lanka, estimated from 6,000<br />
hectares to 13,000 hectares, depending on measurement<br />
standards and methods. In 1968, mangrove cover<br />
was estimated at only 4,000 hectares, but recent remote<br />
sensing surveys indicate more extensive coverage, making<br />
trend analysis difficult. Mangrove cover in the<br />
Puttalam Lagoon, Dutch Bay, and Portugal Bay complex<br />
alone is now estimated at 3385 hectares. According<br />
to land use maps of the Survey Department the areal<br />
extent of mangroves in six districts are:<br />
District<br />
Colombo (west cost)<br />
Amparai (east coast)<br />
Gampaha (west coast)<br />
Extent (ha)<br />
9<br />
54<br />
723<br />
Trincomalee (northeast coast) 1,020<br />
Batticaloa (east coast)<br />
Puttalam (west coast)<br />
1,520<br />
2,970<br />
Total 6,2%<br />
The extent of the mangroves in the Jaffna Peninsula has<br />
not been estimated recently but the peninsula has extensive<br />
coverage.<br />
Sri Lanka's low tide, which rarely exceeds 75 centimeters,<br />
limits the island's mangrove range; mangroves<br />
occur as a narrow intertidal belt and extend less than a
250<br />
kilometer landwards from the mean low water tidal<br />
level. Mangroves are discontinuously distributed along<br />
the coastline and absent altogether along exposed<br />
shorelines affected by high wave energy. Mostly they<br />
occur within embayments and along estuaries and lagoons.<br />
Of the 55 species of mangroves recorded worldwide,<br />
23 species have been recorded in Sri Lanka.<br />
These species, only a few of which are trees, fall into<br />
two broad categories — true mangroves und mangrove<br />
associates.<br />
Salt marsh vegetation consists of herbaceous, salt<br />
tolerant plants growing in tidal flats or areas periodically<br />
inundated by seawater. In Sri Lanka they occur<br />
mainly in the north, northwest, northeast, and southeast<br />
where the dry season is prolonged. In the north salt<br />
marshes occur mainly on exposed tidal Hats and in the<br />
south mainly in the shelter of sand dunes. Salt marsh<br />
vegetation in most areas occurs as sparse, short growth<br />
interspersed with scrub mangroves.<br />
Functions and Values. Each coastal wetland system<br />
functions in ways that provide tangible economic<br />
values to coastal residents.<br />
Estuaries and lagoons, which serve as nutrient<br />
traps and highly productive water bodies, are amongst<br />
the most economically valuable habitats. They support<br />
fishing and employment of thousands of coastal residents.<br />
In 1977 for example, 1,684 fisherman depended<br />
on the fishery of the Negombo Lagoon; in 1983 the<br />
number increased to more than 2,000. Estuaries and<br />
lagoons provide seed fish and shrimp for the aquaculture<br />
industry, and ornamental fisheries that provide<br />
important employment in Negombo Lagoon, Bolgoda<br />
Lake and Trincomalee Bay.<br />
Their other uses explain why their biological systems<br />
have become so vulnerable to degradation. On<br />
one hand estuaries and lagoons are harbors and anchorages<br />
(Negombo Lagoon, Chilaw Lagoon), disposal<br />
sites for sewage (Kelani estuary, Negombo Lagoon,<br />
Lunawa Lagoon) and industrial effluent (Negombo<br />
Lagoon, Kelani estuary, Valaichchenai estuary). On<br />
the other hand they invite recreation (Negombo Lagoon,<br />
Bentota estuary and Bolgoda Lake) that requires<br />
clean water. Estuaries supply sand that significantly<br />
Coastal Resources<br />
helps stabilize beaches, but they also supply sand for<br />
mining (Maha Oya estuary, Kelani estuary, Kaluganga<br />
estuary) that can disrupt the beaches over time.<br />
Seagrass beds also support highly productive fisheries.<br />
Most marine fish caught come from nearshore<br />
coastal waters along the northwestern and northeastern<br />
coasts where seagrass beds abound. Among other<br />
functions and values: seagrasses bind sediment and<br />
stabilize the bottom against erosion, provide habitats<br />
for the endangered dugong and the protected sea turtle,<br />
and provide food to several marine organisms.<br />
Some species such as parrot fish feed directly on the<br />
seagrass leaves, while peneid shrimp feed on the grass<br />
detritus. Certain juvenile fish feed upon epiphytes.<br />
One commercially important species in the estuaries<br />
and lagoon fisheries — Etroplus suratensis — is found<br />
mainly among seagrass beds.<br />
Mangroves are widely harvested for subsistence<br />
and commercial scale operations. Some species —<br />
Rliizophora, Bruguiere, Avicennia — are commonly used<br />
as firewood. People around the Puttalam Lagoon prefer<br />
the charcoal of Rliizophora for its high heat and low<br />
smoke. But supplies are threatened; organized extraction<br />
of firewood for domestic use (Jaffna, Puttalam),<br />
and firing of bakeries (Puttalam), kilns (Batticaloa) and<br />
illicit distilleries (Chilaw) cannot be sustained at present<br />
levels.<br />
Other valuable economic uses of mangrove species<br />
make a long list. Poles cut from Rliizophora, Bniguiera<br />
and Avicennia help in construction of temporary housing,<br />
while plaited leaves olNypa are used to thatch roofs<br />
in certain areas. In the Bentota area, Cerebra manghas<br />
is used to make masks. Fodder, for cattle and goats<br />
comes from Rliizophora and Avicennia, especially during<br />
drought periods, and leaves of Avicennia are sometimes<br />
used as manure. Ripe fruits of Sonneratia<br />
caseolaris are eaten and at times used to make a beverage.<br />
Tender leaves of Acrostichum are consumed as a<br />
vegetable. Poles and posts of several species are used<br />
for construction of fish traps, while Avicennia branches<br />
are heavily exploited in the Negombo lagoon for the<br />
construction of brush piles (jnas-athu). Tannin obtained<br />
from the bark of Rliizophora mucronata and<br />
cerips tagal is still widely used to tan fishing nets and<br />
sails of the traditional fishing craft. Mangrove timber<br />
I<br />
I<br />
I<br />
I<br />
I<br />
I<br />
I<br />
I<br />
I<br />
I<br />
I<br />
I<br />
I<br />
I<br />
I<br />
I<br />
I<br />
I<br />
I<br />
I<br />
I
I<br />
[<br />
I<br />
I<br />
I<br />
i<br />
ii<br />
I<br />
I<br />
I<br />
I<br />
I<br />
is sometimes used to construct the outriggers of traditional<br />
craft.<br />
The economic value of these mangrove uses,<br />
clearly high, has not been accurately estimated. We<br />
have not yet reckoned the future costs incurred by<br />
coastal residents if unsustainable abuses cause mangrove<br />
stocks to decline.<br />
Salt marshes have their own distinct functions and<br />
values. In Mannar and Puttalam they are sites for<br />
collection of milkfish fry (Qianos chanos) for brackish<br />
water aquaculture. Like inland wetlands, they also<br />
function as bird habitat and as discharge areas that<br />
absorb storm water runoff. Livestock grazing and hunting<br />
of water fowl are carried out on a limited scale in<br />
Sri Lanka's salt marshes.<br />
Degradation Trends and Causes. Although quantitative<br />
measures of degradation trends are spotty, we<br />
know the nature and causes of the problem.<br />
Several estuaries and lagoons have gradually decreased<br />
in size. In Negombo Lagoon, for example, the<br />
effective water area has diminished by 791 hectares,<br />
between 1956 and 1981. The delta area at the<br />
Attanagalu Oya inlet has almost doubled during this<br />
period, indicating high rates of siltation. Apart from<br />
natural siltation and sedimentation, human activities<br />
responsible for this trend include landfilling to increase<br />
land holdings, encroachment planting of mangroves to<br />
stabilize temporary shoals, and garbage disposal. New<br />
piers, jetties, and bridges restrict the water flow and<br />
promote further siltation. The Lunawa Lagoon and the<br />
Kalametiya-Lunawa Lagoon have also decreased considerably<br />
in size from these kinds of activities.<br />
Estuaries and lagoons seriously affected by pollution<br />
include the Negombo Lagoon, Kelani estuary,<br />
Lunawa Lagoon, Walawe estuary and the Batticaloa<br />
Lagoon. In the Walawe Ganga estuary and the<br />
Batticaloa Lagoon major contamination comes from<br />
the two state-owned paper factories. Other areas receive<br />
industrial effluent, domestic/municipal waste and<br />
sewage, and, as in Negombo Lagoon, oil from fishing<br />
craft, boat repair yards, and fuel supply stations along<br />
the banks. Certain southern lagoons are experiencing<br />
increased nutrient contents due to the rolling of coir,<br />
Coastal Resources<br />
251<br />
which leads to the release of nutrients such as nitrogen<br />
and phosphorus, causing low levels of dissolved oxygen.<br />
Sand bars restrict water flow, nutrient exchange,<br />
and navigation. Sand bar formation can be caused by<br />
natural factors such as sediment transport patterns and<br />
rainfall patterns, but several human activities contribute<br />
to and aggravate the problem. Several recent river<br />
basin development/diversion schemes have caused restricted<br />
and altered flow patterns that have helped form<br />
sand bars. Obstructions to navigation have occurred in<br />
Chilaw Lagoon, Negombo Lagoon, and the Panadura-<br />
Bolgoda estuary.<br />
Desalinization has adversely affected several lagoons<br />
and estuaries. The salinity of the Kalametiya-<br />
Lunawa Lagoons dropped considerably when the<br />
excess water fresh water from the Uda Walawe reservoir<br />
was diverted into the lagoon in 19S0 and significantly<br />
affected the prawn fishery of the lagoon.<br />
Reduced fishery potential at Nanthikada has resulted<br />
from change in the salinity regime and inadequate recruitment<br />
from the coastal waters.<br />
Conditions and trends in use of the limited mangrove<br />
resources have not been measured nationally, but<br />
local data highlight worrisome trends. For example,<br />
mangrove cover in the area from Thambalagam Bay<br />
(Trincomalee) to Valaichchenai (Batticaloa) has declined<br />
by 25 percent.<br />
Conversion of mangrove areas to other uses is the<br />
greatest threat. Partial harvesting of mangroves for<br />
activities described above can be carried out at locally<br />
sustainable levels, but conversion of mangrove areas by<br />
clearing vegetation and changing topography and soil<br />
conditions causes permanent damage.<br />
Mangrove areas are also reclaimed for housing and<br />
urban expansion, especially near populated urban centers.<br />
In Negombo, for example, about 50 hectares of<br />
mangroves were clearfelled for a national housing proj -<br />
ect in 1984.<br />
Impoundment of mangrove areas for aquaculture<br />
ponds commenced in the early 1980s and since then the<br />
number and scale of aquaculture projects has increased.<br />
Over 600 hectares of coastal land between<br />
Chilaw and Puttalam (around the Chilaw Lagoon,
252<br />
Dutch Canal, Mundal Lake and Puttalam Lagoon)<br />
have been developed for aquaculture, but the areas of<br />
mangroves lost are not known. Construction of ponds<br />
can require dearfelling of mangroves and building of<br />
small dykes with sluice gates to retain water. Mangroves<br />
in the areas surrounding the ponds may be<br />
destroyed as well because of major changes in drainage,<br />
frequency of tidal inundation, and nutrient flow, as well<br />
as easier access to mangroves by villagers.<br />
Land reclamation for coastal coconut and paddy<br />
cultivation is the major conversion problem. The narrow<br />
canals dug to drain seawater kill mangroves and<br />
reduce productive fisheries in surrounding coastal<br />
areas. Canals also adversely change the freshwater<br />
regimes of mangroves that lie seaward of the reclaimed<br />
areas.<br />
Beaches and Dunes<br />
Description and Location. Over three-fourths of<br />
the Sri Lanka coastline is beach-fringed, covering an<br />
estimated 11,800 hectares. Most beaches are sandy but<br />
they vary greatly in width and slope. Some barrier<br />
beaches lie across lagoons or marshes and isolate them<br />
from the sea. Elsewhere incipient barrier beaches form<br />
spits that are free at one end, such as the shoals that<br />
build up at the mouths of the Maha Oya, Negombo and<br />
Kaluganga estuaries. Barrier beaches predominate<br />
along the southwestern and southern coasts, with spits<br />
more common in the west and east.<br />
Spits shift position regularly and change the location<br />
of estuaries' inlets. The inlet of Batticaloa Lagoon<br />
has shifted northward, and the Kaluganga spit<br />
illustrates exceptional instability. Some extensive spits,<br />
as at Kalpitiya, have been stabilized by the efforts of a<br />
relatively large population.<br />
Dunes are windblown accumulations of sand that<br />
remain unstable unless covered by vegetation. Prominent<br />
sand dunes lie along the northeastern, northwestern<br />
and southeastern coasts. Extensive dune systems<br />
have developed between Mullaitivu and Point Pedro,<br />
between Elephant Pass and Chavakachcheri, across<br />
Mannar Island, between Ambakandawila and<br />
Kalpitiya, and between Kirinde and Sangamukande<br />
Point.<br />
Coastal Resources<br />
Functions and Values. Distinctive communities of<br />
plants inhabit the beach/dune systems. This vegetation<br />
promotes accretion, binds the sediment, provides moderate<br />
protection against coastal erosion, and helps bar<br />
the transport of sand by wind.<br />
Besides attracting tourists (Negombo, Beruwela-<br />
Bentota, Hikkaduwa, Unawatuna, Pasikudah, and<br />
Nilaveli areas), beaches also act as natural barriers to<br />
coast erosion. They provide nesting grounds for the<br />
five spedes of turtles found in Sri Lanka — Olive Ridely,<br />
hawksbilL loggerhead, green, and leàtherback). Sea<br />
turtle nesting beaches have been identified at Kosgoda,<br />
Mirissa, Kottegoda, Tangalle, Kalametiya, Bundala,<br />
Kirinde and Palatupana. Fishing communities traditionally<br />
use beaches for beach landing of fishing craft,<br />
drying of fish, drying and mending of nets and housing.<br />
A significant economic use of certain beaches<br />
(Lunawa, Panadura) is sand mining and the mining of<br />
beach sands containing heavy minerals such as ilmenite<br />
and monazite (Pulmoddai) for export. (See Mineral<br />
Resources chapter.)<br />
Degradation Trends and Causes. Although<br />
beaches are receding in most parts of the island, impacts<br />
of coast erosion are most severe in the west and<br />
southwest (see Chapter on Land Resources). There<br />
population and development most often aggravate natural<br />
erosion by poorly planned construction, devegetation,<br />
and sand mining. These pressures also diminish<br />
other habitat and social functions and values of beaches<br />
and dunes.<br />
MINERAL <strong>RESOURCES</strong> IN THE<br />
COASTAL ZONE<br />
Minerals have played a minor role in Sri Lanka's<br />
coastal region, although mineral sands might become<br />
increasingly significant. This brief profile augments the<br />
discussion found in the chapter on Mineral Resources.<br />
Energy minerals. The only mineral of the energy<br />
group of minerals is peat, found mostly in the 34 square<br />
kilometers of coastal swamp called the Muthurajawela<br />
between Colombo and the Negombo Lagoon. The 50<br />
million ton deposit forms a bed with an average thickness<br />
of 3-4.5 meters and a maximum thickness of 6<br />
I<br />
I<br />
I<br />
I<br />
I<br />
I<br />
I<br />
I<br />
I<br />
I<br />
I<br />
I<br />
I<br />
I<br />
I<br />
I<br />
I<br />
I<br />
I<br />
I
I<br />
I<br />
I<br />
I n<br />
I<br />
I<br />
[ ;<br />
I<br />
I<br />
I<br />
I<br />
I<br />
Coastal Resources<br />
Diagrammatic presentation of the 'Coastal Zone' as Defined in the<br />
Coast Conservation Act<br />
meters. Although extensive the deposit is uneconomical<br />
as a fuel.<br />
Industrial mineral sands. Scattered around the<br />
coastline near river mouths, in isolated bays, and on<br />
raised beaches are large placer deposits of heavy minerals<br />
containing a high proportion of ilmenite, rutile,<br />
zircon, monazite and garnet (see Mineral Resources<br />
Chapter). The deposit at Pulmoddai is worked by the<br />
Sri Lanka Mineral Sands Corporation. A smaller deposit<br />
of about 250 metric tons of beach sand containing<br />
50-60 percent ilmenite is found at Tirukkovil, about 70<br />
kilometers south of Batticaloa. Three promising deposits<br />
have recently been discovered along the beaches<br />
from Mullaitivu to Nilaveli on the west coast, estimated<br />
to contain about 3 million tons of ilmenite, 6 million tons<br />
of rutile, and 4 million tons of zircon.<br />
Limestone. The Jaffna Peninsula and the northwestern<br />
coastal belt contain extensive deposits of sedimentary<br />
limestone (miocène) deposits. The Jaffna<br />
deposit is roughly estimated at well over 10 million<br />
metric tons; the deposit at Aruakkaru estimated at<br />
about 18 million metric tons. Their accessibility, large<br />
extent, and purity (CaO = 52 percent) make them<br />
Figure 11.10<br />
suitable for cement manufacture, carried out at a large<br />
scale in the state factories at Puttalam and, until recent<br />
troubles, at Kankesanthurai.<br />
Seashells. Another source of limestone is the extensive<br />
deposit of seashells which lies between<br />
Hungama and Bundala on the south coast ~ a bed 2.5<br />
to 3 meters thick spread over an of 5 square kilometers.<br />
Estimated at 1 million metric tons, it has high calcium<br />
carbonate content of approximately 98 percent. Shell<br />
beds, commonly found in association with coastal lakes<br />
and lagoons, consist mainly of bivalve shells with a few<br />
gastropod varieties occurring in isolated places.<br />
Coral deposits. These occur as patches and lenses<br />
at various places along the southern and southwestern<br />
coasts, especially between Ambalangoda and Matara.<br />
Similar deposits underlie the miocène limestone deposits<br />
in the Jaffna Peninsula, Kalkudah, Kichcheveli, and<br />
Delft Island. Deposits largely consist of loosely packed<br />
finger coral, Acropora sp. mixed with other coral types<br />
and molluscan shells.
254<br />
INSTITUTIONAL RESPONSES<br />
AND NEEDS<br />
Overall responsibility for coastal resource management<br />
vests with the Coast Conservation Department<br />
(CCD) under the Coast Conservation Act No. 57 of<br />
1981. Within the narrow coastal region defined by the<br />
Act (see Figure 11.10), CCD formulates and implements<br />
coast conservation projects, regulates development<br />
through permits, evaluates development<br />
project impacts through discretionary environmental<br />
impact assessments, prepares and implements a<br />
Coastal Zone Management Plan, and conducts research<br />
in cooperation with other agencies.<br />
CCD's mandate is unusual among government institutions<br />
because it was designed to cross over and help<br />
coordinate the sectoral management authority of many<br />
other agencies. It can do so because it exercises regulatory<br />
authority over new coastal development. In<br />
practice it meets its mandate through frequent and<br />
informal interagency discussion and coordination.<br />
This cross-sectoral authority becomes critical, because<br />
in addition to CCD's functions, other agencies<br />
exercise significant coastal jurisdiction:<br />
• The Ministry of Fisheries and Aquatic Resources<br />
has major responsibilities for fishery resources and<br />
efforts within and outside of the coastal zone;<br />
• The National Aquatic Resources Agency<br />
(NARA), situated within the Ministry, was established<br />
in 1981 to carry out broad research and<br />
development, monitoring, and research coordination<br />
functions concerned with Sri Lanka's marine<br />
and inland aquatic resources.<br />
• The Urban Development Authority (LJDA) exercises<br />
comprehensive management authority over<br />
development within and outside of the coastal<br />
zone, including all areas within one kilometer of the<br />
coastline, which it has designated as "urban." Detailed<br />
land use plans have been developed for some<br />
rapidly growing urban centers (Colombo,<br />
Ambalangoda, Hikkaduwa) with others in progress.<br />
All building construction within coastal areas<br />
requires a permit from the UDA or its authorized<br />
agent.<br />
Coastal Resources<br />
• Other more specialized development-oriented<br />
agencies operating in the coastal zone include the<br />
Sri Lanka Ports Authority, the Sri Lanka Land<br />
Reclamation and Development Corporation, Ceylon<br />
Fisheries Harbours Corporation, and the<br />
Greater Colombo Economic Commission. Other<br />
agencies, like the Ceylon Electricity Board with its<br />
role in developing thermal electric generating<br />
plants, can exercise significant jurisdiction over<br />
coastal resources.<br />
• The Central Environmental Authority exercises<br />
broad coastal and nationwide jurisdiction over air,<br />
water, and land pollution through environmental<br />
standards and permit regulation, as well as natural<br />
resource and environmental policy generally.<br />
Sri Lanka exhibits all the pressures of development<br />
and population density that threaten coastal resources<br />
in every part of the world. It is blessed, however, with.<br />
unusually farsighted coastal legislation. CCD's establishment<br />
of a regulatory program, and completion of a<br />
coastal plan have made rational management of coastal<br />
resources possible, and possibly easier than management<br />
of many inland resources. On the other hand,<br />
CCD's task is made difficult not only by the usual<br />
limitations of staff and resources, but more so by its<br />
legally limited jurisdiction—2 kilometers out to sea, 300<br />
meters inland, and 2 kilometers inland for rivers and<br />
estuaries. Given the ecological and hydrological systems<br />
and adverse development impacts that respect no<br />
such artificial boundaries, coastal management requires<br />
complex interagency coordination and agreement.<br />
Looking beyond the bureaucratic challenge, however,<br />
CCD sees its success increasingly tied to its ability<br />
to work through local communities and interests whose<br />
economic and social self-interest requires sustainable<br />
coastal development. Efforts to conduct coastal management<br />
through smaller units and at grass-roots levels<br />
will require substantial public education and new opportunities<br />
for employment and income generation that<br />
will maintain coastal resources and productivity for<br />
future generations.<br />
I<br />
I<br />
I<br />
I<br />
I<br />
I<br />
I<br />
1<br />
I<br />
I<br />
I<br />
I<br />
I<br />
I<br />
I<br />
I<br />
I<br />
I<br />
I<br />
I<br />
I
I<br />
I<br />
I<br />
I<br />
I<br />
it-'<br />
[j •<br />
i •-<br />
r<br />
i<br />
i<br />
i'i<br />
i<br />
i<br />
i<br />
Coastal Resources 255
Among other valuable functions, wetlands support Sri Lanka's diverse bird population.<br />
256<br />
I<br />
I<br />
I<br />
I<br />
I<br />
I<br />
I<br />
I<br />
I<br />
I<br />
I<br />
I<br />
I<br />
I<br />
I<br />
I<br />
I<br />
I<br />
I<br />
I<br />
I
I<br />
I<br />
I 257<br />
i<br />
p<br />
i<br />
i<br />
i<br />
i<br />
i<br />
I<br />
12 Inland Aquatic Resources<br />
Sri Lanka is said to possess three hectares of inland<br />
lentic water for every square kilometer of land (de<br />
Silva, 1988) — one of the highest densities of inland<br />
lakes, tanks, ponds, marshes and other still water available<br />
for any country in the world. The values of such<br />
aquatic resources, particularly wetlands and<br />
floodplains, have received increasing attention<br />
worldwide over the past twenty years. An international<br />
treaty convention (Convention on Wetlands of International<br />
Importance, Ramsar, 1971) to which Sri Lanka is<br />
a party, seeks to protect wetlands and associated<br />
floodplains to feed people, protect them from floods<br />
and pollution, and sustain wildlife. A growing body of<br />
national laws, institutions, and scientific and management<br />
information is being successfully applied for sustainable<br />
development of inland aquatic resources in<br />
every continent.<br />
Despite the extent of its inland aquatic resources,<br />
Sri Lanka shares with the rest of the world a need to<br />
know more about them and manage them better. This<br />
chapter highlights what we know, and need to know,<br />
about the functions and values of Sri Lanka's inland<br />
aquatic resources and the impacts and trends affecting<br />
their condition and future.<br />
At the outset, efforts to understand these aquatic<br />
resources and habitats suffer from lack of basic definitions<br />
and classifications. Long-term resource management<br />
requires classification that will help planners and<br />
managers in the public and private sector identify and<br />
distinguish the hydrological and environmental characteristics<br />
of inland tanks, paddy fields, rivers, lakes, or<br />
flood plains. An attempt is made here to develop a<br />
framework for appropriate classification that, once<br />
refined, can facilitate the gathering of scientific data<br />
necessary to support wise use of our water resources.<br />
Unlike coastal ecosystems, inland aquatic resources<br />
are not subject to influence of ocean tides. Yet they<br />
are essential breeding, rearing and feeding grounds for<br />
many species of fish and wildlife important in the coastal<br />
region as well as inland. They play a major role in<br />
regulating flood waters, controlling pollutants and<br />
stabilizing shorelines. Inland tanks and reservoirs in<br />
particular, have provided the basis for the system of<br />
irrigated agriculture that has existed in the country<br />
since the sixth and fifth century B.C.<br />
Sri Lanka's inland aquatic resources may be classified<br />
into rivers and streams, deepwater habitats and<br />
wetlands (Figure 12.1). Rivers and streams are<br />
generally characterized by flowing water. Deepwater<br />
habitats, on the other hand, are permanently flooded<br />
bodies in which water is the dominant medium of the<br />
living organisms.<br />
In contrast, wetlands are habitats inundated by<br />
shallow water or possessing saturated soil conditions<br />
for a part of the year. Soil, vegetation, and air — not<br />
water alone ~ are the living medium for a wetland's<br />
organisms. The boundary between wetlands and deepwater<br />
habitats is considered at two meters below low<br />
water, because that represents the maximum depth in<br />
which emergent plants usually grow. Wetlands, as<br />
defined here, include habitats that support cultivated<br />
hydrophytes, such as rice paddies.<br />
AQUATIC HABITATS <strong>OF</strong><br />
<strong>SRI</strong> <strong>LANKA</strong><br />
Rivers and Streams<br />
(Riverine)<br />
The 9 major rivers and 94 smaller rivers that drain<br />
Sri Lanka have a total collective length of around 4,560<br />
kilometers. These river systems can be classified into<br />
three types, based on gradient of the river bed, and<br />
velocity and permanence of the water:<br />
• slow-flowing perennial, usually confined to the<br />
lowlands where the gradient is flat and the flow of<br />
water is sluggish, such as the Maha Oya and<br />
Deduru Oya;
258<br />
INLAND —<br />
AQUATIC<br />
<strong>RESOURCES</strong><br />
SYSTEM<br />
Inland Aquatic<br />
Classification of Inland Aquatic Systems of Sri Lanka<br />
r— RIVERS & STREAMS (Riverine) —<br />
Habitats contained within a channel.<br />
— WETLANDS (Palustrine)<br />
Floodplains and shallow-water<br />
habitats dominated by<br />
vegetation or those < 2 m depth<br />
at low water levels or < 8 ha of<br />
surface.<br />
eg. riverine marshes<br />
non-riverine marshes<br />
wet montane grasslands<br />
swamp forests village,<br />
tanks ponds rice paddies<br />
'— DEEP WATER (Lacustrine) —<br />
dammed river channel :<br />
> 8 ha area<br />
Figure 12.1<br />
SUB-SYSTEM<br />
[-SLOW FLOWING (Lower Perennial)<br />
Gradient low and water velocity<br />
low, water flows throughout year;<br />
substrate consists mainly of sand<br />
and mud; floodplain fairly developed.<br />
eg. slow flowing perennial rivers<br />
and streams<br />
-FAST FLOWING (Upper Perennial)<br />
Gradient high, velocity of water fast; water<br />
flows throughout the year; substrate of rock,<br />
cobbles or gravel; little floodplain developed.<br />
eg. fast flowing perennial rivers and streams<br />
— SEASONAL (Intermittent)<br />
Water flows for part of the yearjwhen water is<br />
not flowing, it may remain in isolated pools, or<br />
surface water may be absent.<br />
eg. seasonal streams<br />
rDEEPWATER (Limnectic)<br />
Deep water habitats within<br />
lacustrine system; 2m depth<br />
at low water level<br />
eg. perennial reservoirs/tanks<br />
-SHALLOW FRINGE (Littoral)<br />
Wetland habitats within lacustrine<br />
system: extends from shoreward<br />
boundary of deepwater habitat<br />
to depth of 2m.<br />
eg. reservoir/tank fringe wetlands
I<br />
I<br />
r<br />
I H<br />
I !<br />
Ir<br />
I : -<br />
I<br />
r<br />
•<br />
i ;!<br />
{<br />
i<br />
I<br />
I<br />
I<br />
I<br />
I<br />
• fast-flowing perennial, mainly confined to the hill<br />
country where the gradient is steep and flow of<br />
water fast, such as the Kotmale Oya and Behihul<br />
Oya;<br />
• seasonal, where water is confined to small isolated<br />
pools in the river bed or completely absent during<br />
the dry season, such as the Wasgomuwa Oya and<br />
Bodigoda Aru.<br />
Wetlands<br />
(Palustrine system)<br />
Wetland systems consist of extensive marshes connected<br />
to rivers or seasonally flooded and isolated from<br />
rivers, and many small permanent or seasonal ponds,<br />
swamps and other water-dominant and water-influenced<br />
habitats. About 95 percent of Sri Lanka's<br />
inland freshwater wetlands are man-made, comprising<br />
mainly rice paddies and village reservoirs.<br />
The depth, duration, chemistry and temperature of<br />
the water, and cultural practices determine the nature<br />
and productivity of wetlands - the amounts and types<br />
of vegetation and fish, molluscs, birds, crustaceans,<br />
insects, worms and micro-organisms which find food<br />
and shelter in the substrata and within the vegetation.<br />
Floods, droughts, frost and high winds are among the<br />
important events that shape the natural ecosystems.<br />
Because of their steep gradients, most of Sri<br />
Lanka's rivers and streams, particularly in the southwest,<br />
have not developed extensive floodplains. They<br />
are usually characterized instead by narrow, restricted<br />
floodplains along most of their length and notably near<br />
the river mouths.<br />
Floodplains associated with rivers<br />
Floodplains associated with rivers are best represented<br />
along the Mahaweli Ganga, Kala Oya and<br />
Modaragam Aru (Fernando, 1971). The most extensive,<br />
the Mahaweli Ganga floodplain, occupies around<br />
50,000 hectares of the eastern lowlands. Much of this<br />
floodplain has a natural or semi-natural vegetation<br />
cover consisting of a complex array of diverse habitats.<br />
Inland freshwater habitats include small streams,<br />
riverine marshes, seasonally flooded swamp forests and<br />
seasonal tanks. The coastal saline habitats include es-<br />
Inland Aquatic 259<br />
tuaries and deltas, mangrove swamps and intertidal<br />
mud flats.<br />
These habitat types have intricate interrelationships<br />
between biological and hydrological characteristics.<br />
The riverine marshes or 'villus' occupy natural<br />
depressions between the levee ridges of the channels of<br />
the Mahaweli and its various active or former distributaries,<br />
or between these levee ridges and the adjacent<br />
upland areas. They directly connect to the river<br />
by narrow channels. During the dry season, when the<br />
river is low, much, but not usually all of Sdllu' water may<br />
flow out to the river through these channels.<br />
Coastal habitats near the river mouth, including<br />
mangroves and mudflats, coastal waters and productive<br />
estuaries, depend on the upland wetlands of the<br />
floodplain for their nutrients, hydrological regime, and<br />
water quality. The river, floodplain and associated<br />
coastal ecosystem form interdependent parts of a complex<br />
hydrologie system.<br />
Not far inland along the western coast, the 60-hectare<br />
Bellanwilla-Attidiya marsh is one of the few<br />
remaining freshwater wetlands near Colombo and is<br />
another example of a wetland system associated with a<br />
river. Located in the floodplain of the Bolgoda Lake,<br />
which is connected to the Bolgoda Ganga, it was partly<br />
cultivated with paddy until about 1980. Now it consists<br />
of shallow freshwater ponds, marshes and seasonally<br />
flooded grassland with scattered scrub and small trees.<br />
Although Bolgoda Lake is brackish and subjected to<br />
tidal fluctuations, the Bellanwila-Attidiya complex lies<br />
away from the river mouth and has a fresh water condition<br />
with major contributions from overland drainages<br />
and seepages. The marsh supports a variety of waterbirds<br />
in small numbers, and is an important roosting<br />
site. The open water is covered with floating weeds like<br />
Salvinia molesta and Eichomia crassipes, while the fringes<br />
contain low reeds and grass.<br />
Floodplains isolated from rivers<br />
Marshes within the Wilpattu National Park represent<br />
seasonally contracted floodplains isolated from<br />
river systems. They are formed in shallow depressions<br />
where local runoff collects over an impermeable layer<br />
or where water percolates through a thin layer of soil<br />
from the underlying limestone. About 40 'villus,' totall-
260<br />
Inland Aquatic<br />
WETLAND FLOOD STORAGE AND CONVEYANCE<br />
FLOW RATE -<br />
—<br />
RAIN<br />
III<br />
. Higtttr Flood/HigMrPlow«<br />
TIME<br />
ing perhaps around 100 hectares in the park, are mostly<br />
fresh water. Several are saline even though they have<br />
no surface connection with the sea. A wide sloping<br />
beach-like fringe surrounds these Villus' to form effective<br />
catchments. A variety of waterfowl and mammals<br />
are concentrated in and around these water bodies.<br />
Wet Montane grasslands<br />
These grasslands are best represented at Horton<br />
Plains, which lies at an altitude of 2,100 to 2,200 meters.<br />
The 2,000 hectares of wet montane grasslands in the<br />
valleys and lower slopes are interspersed with patches<br />
of thick montane forests on upper slopes and hill crests.<br />
These grasslands are a plagioclimax community, maintained<br />
by frequent fire and grazing (Koelmeyer, 1957).<br />
The plains receive southwest and northeast monsoons<br />
and are drained by tributaries of three major rivers, the<br />
Mahaweli, Walawe and Kelani Gangas. At the headwaters,<br />
the beds of these small tributaries are covered<br />
with peaty moss. The streams have no indigenous fish,<br />
and the rainbow trout introduced at the beginning of<br />
the century is the only fish species. Stream fauna is<br />
dominated by detritus-feeding animals.<br />
Swamp forests<br />
These forests occur on seasonally flooded soil in<br />
the floodplains of major rivers such as the Mahaweli,<br />
Figure 12.2<br />
I<br />
I r !<br />
I<br />
I<br />
I<br />
I<br />
I<br />
I<br />
I<br />
I<br />
I<br />
I<br />
I<br />
I<br />
drought or have low water levels from July to September.<br />
About 12,000 operational village tanks now irrigate<br />
some 269,000 hectares mainly in the Dry Zone,<br />
and, to a lesser extent, in the intermediate zone. In<br />
some localities the density of tanks exceeds 0.56 tanks<br />
within a square kilometer. Sri Lanka's traditional social,<br />
economic and cultural life has been closely knit<br />
with village tanks. (See Heritage Chapter.)<br />
Ponds are small and shallow depressions filled by<br />
rainwater and created by human developments such as<br />
excavations, road construction, gem mining, and so<br />
forth. Because so many gem pits have been created<br />
illegally they have not been filled or reclaimed after<br />
mining. Their small size and great de pi h makes them<br />
far more harmful than beneficial, Kini» traps for<br />
wildlife and breeding grounds for malaria-carrying<br />
mosquitoes. An estimated 1,000 such .ikiridoncd pits<br />
lie within the Wasgomuwa National P.irk .done.<br />
Rice paddies<br />
In addition to the natural wetlands. Sri Lanka has<br />
over 850,000 hectares of rice paddies which are supported<br />
by the extensive and intricate system of manmade<br />
irrigation tanks. The paddy lands provide<br />
important habitat to waterbirds, and over 2,400<br />
kilometers of irrigation channels connected to tanks<br />
provide additional wetland habitat.<br />
Deepwater Habitats<br />
The only inland deepwater habitats are irrigation<br />
tanks and reservoirs. Of the approximately 3.500 functional<br />
deepwater tanks and reservoirs in the country,<br />
only about 70 exceed 300 hectares in surface area. The<br />
total surface area of these man-made lakes exceeds<br />
170,000 hectares. In recent years however, major reservoirs<br />
have been built in the hill country, particularly for<br />
hydropower generation, the largest being Victoria,<br />
Randenigala, Kotmale, and Castlercigh. These hill<br />
country reservoirs may reach over 4
262<br />
Source: De Silva, 1988<br />
Fishery production<br />
Inland Aquatic<br />
Trends In Inland Fishery Production<br />
P*rc*nt<br />
Nearly all fish need shallow waters (wetlands or<br />
ponds) at some stage of their life cycle, to spawn, feed,<br />
or avoid predators and extreme environmental conditions.<br />
Studies have shown that two-thirds of the fish<br />
consumed in the world depend on coastal wetlands at<br />
some stage of their life, and freshwater fish depend<br />
similarly on inland wetlands and deepwater habitats.<br />
In ancient Sri Lanka, reservoirs, ponds, rivers, and<br />
freshwater marshes were recognized as productive<br />
habitat for inland fisheries. Records reveal that inland<br />
fisheries were economic enterprises accepted both socially<br />
and culturally (Siriweera, 1986). The earliest<br />
reference to fishing in reservoirs and canals is found in<br />
Perimiyankulam rock inscriptions (A.D. 65-109) outside<br />
Anuradhapura. The inscription refers to a tax on<br />
fish. Such a tax on inland fisheries seems to have continued<br />
throughout the first millennium, during which<br />
time the state, village assemblies, and private individuals<br />
exercised proprietorship. Fish in large reservoirs<br />
and channels constructed by the state were owned<br />
by the king, and those he allowed to fish paid a tax.<br />
Village assemblies had proprietorship of fish in the<br />
village irrigation works considered as common property.<br />
Fish harvested from these tanks were divided<br />
'S3 '79 'SO '83<br />
Figure 12.3<br />
20<br />
amongst the villagers in proportion to the paddy land<br />
held by each villager. Private individuals owned small<br />
ponds and channels that led to their own paddy fields.<br />
The ponds were constructed by individuals in their<br />
homesteads to breed fish. Inscriptions suggest that the<br />
tax on fish was abolished sometime in the twelfth century<br />
A.D.<br />
Prior to 1960 inland fishery production in the<br />
country was negligible, but today tanks and reservoirs<br />
account for 20 percent (or 27,000-30,000 metric<br />
tons/year) of Sri Lanka's total fish production. Mean<br />
production from the reservoir fishery is presently about<br />
307 kg/ha/yr. Production from individual reservoirs<br />
varies from 40 to over 500 kg/ha/yr (de Silva, 1988).<br />
This growing fishery largely depends on a single exotic<br />
species, the cichlid Oreochhromis mossambicus, which<br />
was introduced into the country in 1956 (Figure 123).<br />
In some reservoirs studied (Figure 12.4) production has<br />
increased fivefold or more over a six-year period. With<br />
ihe decline of the deep-sea and coastal fisheries its<br />
importance is expected to grow further. The increase<br />
in inland fishery production resulted largely from the<br />
concerted effort made by the government to promote<br />
Sri Lanka's inland capture and culture fishery as an<br />
integral part of rural development (Figure 12.5).<br />
I<br />
I<br />
I<br />
I<br />
I<br />
I<br />
I<br />
I<br />
I<br />
I<br />
I<br />
I<br />
I<br />
I<br />
I<br />
I<br />
I<br />
I<br />
I<br />
I<br />
I
I<br />
I<br />
I<br />
I I<br />
I j<br />
f<br />
j<br />
I<br />
I<br />
i<br />
I<br />
I<br />
I<br />
I<br />
f, ;<br />
Source: De Silva, 1988<br />
Inland Aquatic 263<br />
Trends in Fish Production in Selected Reservoirs<br />
NACOOMOUW» MINNCRIYA<br />
uoAw*ua«E SCNAN«»KE SAMUOH«<br />
Figure 12.4<br />
INCREASE IN RESERVOIR FISHING EFFORTS<br />
£3<br />
I978 '79 '80 '81<br />
YEAR<br />
'82 '83 '84<br />
THE OVERALL MEAN EFFORT IN RESERVOIR FISHERY HAS INCREASED FROM 0.019 BOATS/HA IN1978 TO 0.050 BOATS/<br />
HA IN 1984, NEARLY A THREE-FOLD INCREASE IN SIX YEARS. HOWEVER INCREASE IN EFFORTS IN THE RESERVOIRS<br />
NOT BEEN BASED ON ANY CONSIDERATION <strong>OF</strong> THE MAXIMUM SUSTAINABLE YIELD (MSY). THIS COULD<br />
HAVE IMPLICATIONS FOR SUSTAINABLE MANAGEMENT <strong>OF</strong> RESERVOIR FISHERIES.<br />
Figure 12.5
264<br />
Although data concerning river fish fauna is<br />
limited, Sri Lanka's rivers do not, and apparently never<br />
did support a viable commercial fishery. Yet riverine<br />
'villus' that form part of the river floodplain are highly<br />
productive, and excellent spawning and nursery<br />
habitats for many fish species, both commercial and<br />
non-commercial. Few studies have been carried out in<br />
these habitats, but Fernando and Indrasena (1969)<br />
reported that in selected Villus' in the Mahaweli Ganga<br />
floodplain catches ranged from 35-70 kg/ha/yr. Mendis<br />
(1977) estimated that riverine marshes have a total<br />
potential annual fish production of 450 tons, about one<br />
percent of the country's total annual freshwater fish<br />
production.<br />
Wildlife habitat<br />
Inland aquatic habitats, particularly wetlands, are<br />
among Sri Lanka's most valuable wildlife habitats.<br />
They offer the most critical habitat components of food,<br />
water, and often cover as well. Structural diversity of<br />
vegetation, water, and open spaces maximizes the<br />
'edges' that are so productive to wildlife. Floodplains<br />
along permanent streams and rivers provide hospitable<br />
habitat for migrating birds, deer and elephant.<br />
The Mahaweli Ganga floodplain, including its associated<br />
riverine marshes and swamp forests, supports<br />
the greatest animal biomass density of all habitat types<br />
found in the country. Of particular importance is its<br />
value as elephant habitat because of the abundant food<br />
and water. Over 500 elephants (or one-sixth of the<br />
island's estimated wild population) use the floodplain<br />
as a corridor between the wet season feeding and dry<br />
season watering grounds. The Mahaweli Ganga<br />
floodplain occupies a relatively small part of the northeast<br />
region, however, and it is extremely vulnerable to<br />
change and external influence.<br />
Other aquatic habitats also support major elephant<br />
populations. The environs of Senariayake Samudra<br />
support a population of 250-300 elephants, while three<br />
small tanks (Lahugala, Kitulana and Sengamuwa)<br />
within the 1,500-hectare Lahugala-Kitulana National<br />
Park are visited by over 150 animals. The reservoirs<br />
within the Maduru Oya National Park also support<br />
150-200 elephants. These numbers underline the importance<br />
of aquatic habitats and their natural sur-<br />
Inland Aquatic<br />
roundings for the future survival and maintenance of<br />
elephant populations in Sri Lanka.<br />
As developed countries have often learned too<br />
late, urban wetlands provide recreational open space<br />
and attractive habitat for birds and wildlife. Among its<br />
other important functions, the Bellanwila-Attidiya<br />
marsh in Colombo represents one of the last large<br />
parcels of open space and wildlife habitat in the district.<br />
Livestock and grazing<br />
Water buffalo and cattle depend on aquatic<br />
habitats for grazing, particularly the tanks and<br />
floodplain marshes of the Dry Zone. Usually 50-80<br />
percent of the drawdown of exposed zone of the inundated<br />
floodplain and tanks after flood stage lowering is<br />
available for grazing. The large amounts of dung left by<br />
the grazing animals are an important nutrient input into<br />
these aquatic systems.<br />
Floodplains of the Mahaweli Ganga support an<br />
estimated 50,000 buffalo and cattle. Although we lack<br />
information on trends in livestock populations in the<br />
Mahaweli Ganga floodplain, TAMS (1980) postulated<br />
that the carrying capacity for livestock in the floodplain<br />
had declined considerably over the previous two<br />
decades, due to altered river regimes or overgrazing.<br />
Water supply<br />
An intricate network of rivers and streams, wetlands<br />
and deepwater systems provides most of the<br />
water for irrigation, domestic uses and hydropower<br />
production. Tanks and reservoirs irrigate over 500,000<br />
hectares of land have an aggregate installed generating<br />
capacity of 938MW (1988) and produce 27,000-30,000<br />
metric tons of fish on an annual basis, thereby contributing<br />
substantially to the country's economic<br />
growth.<br />
IMPACTS AND TRENDS<br />
The functions and values of inland aquatic systems<br />
have been substantially modified in Sri Lanka since<br />
ancient times. Many of the changes are obvious - dams<br />
have converted miles of major rivers into still reservoirs,<br />
settlements have vastly changed floodplain habitat,<br />
developments have filled wetlands, upstream land use<br />
silts up reservoirs and irrigation systems, and pesticides<br />
I<br />
I<br />
I<br />
I<br />
I<br />
I<br />
I<br />
I<br />
I<br />
I<br />
I<br />
I<br />
I<br />
I<br />
I<br />
I<br />
I<br />
I<br />
I<br />
I<br />
I
I<br />
I<br />
r -•<br />
I<br />
I ri<br />
i<br />
I<br />
I<br />
I<br />
I<br />
I<br />
i<br />
i<br />
i<br />
f<br />
and fertilizers degrade tanks and harm fisheries. However,<br />
discussion of these and other impacts suffers from<br />
lack of precise data on their economic and environmental<br />
effects. Evidence is often anecdotal and oft<br />
repeated.<br />
The crux of our problem is that we know too little<br />
about the functions and values of inland aquatic resources<br />
and cannot adequately measure their benefits.<br />
Similarly, we cannot accurately determine the costs of<br />
their degradation or destruction. Measurements become<br />
important when deciding upon new projects or<br />
needs for urban and rural planning. The discussion of<br />
impacts below points out these deficiencies.<br />
Impoundments and diversions<br />
Impoundments and large-scale Ji\ersions of fresh<br />
water from rivers have been buffers jujinst extreme<br />
hydrological events such as floods and drought that can<br />
cause major socio-economic disasters. Along with<br />
these and other substantial benefits (hey also bring new<br />
economic and environmental risks.<br />
Flood control bunds, like those along the Kelani<br />
Ganga, are traditional flood protectors used<br />
throughout the world. Although the bunds protect<br />
surrounding areas from flooding, they also increase<br />
flood heights and velocities within the river channels.<br />
As sediment deposits within the channels the river bed<br />
rises as well, possibly requiring higher bunds. The<br />
result is that with any breach of the flood cont rol bunds<br />
the risks to human life and property can become increasingly<br />
severe. Risks of breaches and high losses<br />
are further aggravated by increasing settlements on the<br />
bunds. Breaching of the Kantalai dam recently resulted<br />
in a number of human deaths and the destruction of<br />
large amounts of cultivated land.<br />
Net gains in deepwater habitats -- tanks and reservoirs<br />
have taken place in the last ten years. Around<br />
25,000 hectares of deepwater bodies have been created<br />
during the last decade, around two-thirds of which are<br />
in the Mahaweli areas. The extensive network of reservoirs<br />
and irrigation channels in the Mahaweli basin now<br />
serves around 300,000 people. These systems have<br />
radically altered the hydrologie regime in ways not<br />
entirely beneficial. Flooding of the Mahaweli's riverine<br />
marshes will be reduced by 50 percent (TAMS, 1980).<br />
Inland Aquatic 265<br />
In the Kalawewa area the Mahaweli Program consolidated<br />
a total of 214 small seasonal tanks, covering a<br />
surface area of 3,000 hectares, into permanent water<br />
bodies for a new irrigation system. The result: a net loss<br />
of around 900 metric tons of fish production annually<br />
(Weatherly and Arnold, 1977). The fresh water flow at<br />
the mouth of the Mahaweli at Koddiyar Bay was expected<br />
to be diminished by around 50 percent (TAMS,<br />
1980). Effects of these changes on wildlife, bird and<br />
fish populations have not been measured.<br />
Sedimentation<br />
The condition of wetlands and deepwater habitats<br />
usually depends on catchment systems in the upper<br />
basin. As discussed in other chapters, improper land<br />
use and agricultural practices in the upper watersheds<br />
change the amount, timing and quantity of water, and<br />
increase soil erosion. Cultivation on the edges of<br />
streams and rivers has occurred throughout the<br />
country, despite requirements of the Soil Conservation<br />
Act for stream bank buffers. More than twenty years<br />
ago the Water Resources Board estimated that along<br />
122 miles of stream in the Kumbalwela Korale area only<br />
17 percent of the required statutory buffer acreage was<br />
retained (Interim Report of Land Commission, 1986).<br />
Anecdotal evidence suggests that damage to life<br />
and property caused by this land degradation has increased<br />
and occurs more frequently. The floods and<br />
landslides experienced in the southwest part of the<br />
country in 1989 affected over 225,000 people and left<br />
over 300 dead. Funds needed to rehabilitate the affected<br />
people, not the land itself, were approximately<br />
120 million rupees. (See Land Resources chapter.)<br />
Conversion to alternate uses<br />
Wetlands located in the southwest and coastal<br />
regions of the country have been drained, filled and<br />
reclaimed to provide new land for agriculture, housing<br />
and commerce. These projects have, however, significantly<br />
impaired flood drainage, resulting in damage<br />
to housing, property, agricultural land and roads.<br />
In the last two decades nearly 70,000 hectares of<br />
low-lying marshy areas have been filled or identified for<br />
reclamation. Of these, some 16,000 hectares were in<br />
the southern and southwestern sectors of the island<br />
(Second Interim Report of the Land Commission
266<br />
Inland Aquatic<br />
MIJTHÜRAJAWELA MARSHES - NEGOMBO LAGOON<br />
PREPARING A MASTER PLAN<br />
Just north of the Kelani Ganga estuary lies the Muthurajawela marsh - approximately 3,000 hectares<br />
of largely undeveloped marshy land just seaward of the major industrial areas of Northern Colombo.<br />
Some 400 years ago Muthurajawela was an alluvial flood plain and fertile paddy land. The 3,000-hectare<br />
Negombo Lagoon, adjacent to the north, was then the island's foremost seaport and commercial center<br />
for the Kotte Kingdom. Subsequently Dutch and then British engineers divided Muthurajawela and<br />
radically changed its hydrology by many ill-planned, canals, sluice gates, embankments, and roadways.<br />
Today Muthurajawela is a marshy water retention area largely uncultivable and heavily infiltrated by saline<br />
water, yet it still serves* many uses. Negombo Lagoon is no longer the center of commerce for western Sri<br />
Lanka, but it remains a highly productive estuary and important commercial fishing center;<br />
- Like many other marshes around the world close to industrial and human, settlements, pressures<br />
mount to develop Muthurajawela for housing and commercial uses. It lies within the Gampaha district<br />
whose population of nearly 1.4 million in 1981 has grown annually by LS percent. Planners expect the<br />
district to reach 2.7 million by the year 2001. To many the Muthurajawela marsh has appeared ideal as a<br />
site for residential and commercial development and disposal of wastes». Proposals for substantial filling<br />
and construction were recently formulated for government approval, which promptednew concerns about<br />
the effecton the functions and values of the marsh. In response, Hi& Excellency President of Sri Lanka,<br />
g; PfrBmariiffl^ aimfOTmyH in mîrj-1ORQ that hf. wniiltj "frf^ft a!f ^i?i^ipii^f.Mtprnp«^tVnfTyyh-thiy pnfrtig<br />
amt privat«* serfnr^! 1 until an> nvironnTRnta.lIy snnnd tna. - : > : -<br />
• . - • - . - . ' - . . • • ' • - . - • , ' : : ' : ^<br />
The process of the Master Plan preparation is now sdieduledfor<br />
two-yeas technical assistance provfc|g&»the Netherlands ê
I<br />
i<br />
( • • ><br />
( •<br />
j .<br />
I<br />
I<br />
I 1<br />
I<br />
I<br />
I<br />
t<br />
i<br />
I<br />
1985). Most filling has been carried on around Colombo<br />
where development pressure is highest. Approximately<br />
204 hectares of low-lying marshy land<br />
around Colombo has been reclaimed by the Sri Lanka<br />
Reclamation and Development Corporation alone<br />
since its inception in 1968. Another 400 hectares of<br />
such land in the Colombo and Kotte areas have been<br />
identified for future reclamation, together with another<br />
92 hectares at Attidiya. A further 2,000 hectares<br />
situated at Muthurajawela is currently being considered<br />
for reclamation for housing and industry (see<br />
box on Muthurajawela.) Unfortunately we lack quantitative<br />
measures of the increased flooding and damage<br />
caused by lowland filling, but residents of Colombo<br />
frequently attest to the increased frequency and<br />
severity of road flooding throughout the city.<br />
Information on wetland losses in areas outside<br />
Colombo is limited and often subjective, but because<br />
inland wetlands receive little protection under existing<br />
state laws they remain vulnerable to development. Urbanization<br />
threatens wetlands in the southwestern and<br />
southern parts of the country. Agricultural development<br />
projects pose equally serious threats to wetlands<br />
in the Dry Zone.<br />
As in so many other countries, however, accelerated<br />
wetland destruction has enhanced public<br />
concern and debate. Recently this has led to legislation<br />
to protect the Bellanwila-Attidiya marsh (1990) and<br />
requirement of an environmental impact assessment<br />
for the Muthurajawela reclamation and development<br />
project.<br />
Pollution<br />
Rivers, streams, and wetlands have been common<br />
dumping ground for sewage, industrial and agricultural<br />
effluent, municipal garbage and other toxic materials.<br />
Suspended sediment loads in streams and rivers are the<br />
result of soil erosion from agriculture, construction<br />
sites and forest clearing. Because wetlands are natural<br />
sinks for pollutants as well as nutrients, pesticide<br />
runoff, toxic metals, petroleum runoff, or other hazardous<br />
waste can contaminate them. Many refuges in the<br />
United States have become seriously polluted by<br />
agricultural drainage making them unfit for Fish and<br />
wildlife. Avian diseases have been one result, reported<br />
Inland Aquatic<br />
267<br />
in North America, Japan, Africa, and Europe. (World<br />
Resources Institute, 1987.)<br />
INSTITUTIONAL CONSTRAINTS<br />
AND<br />
RECOMMENDED RESPONSES<br />
Wise use of inland aquatic resources can reduce<br />
costs of natural disasters and increase food production<br />
and long-term economic welfare of the people. These<br />
goals require a number of policy initiatives and new or<br />
better institutional efforts to overcome many longstanding<br />
constraints. The most critical needs:<br />
• Management of upper and lower catchments for<br />
long term maintenance of dams and irrigation systems.<br />
• Catchment and downstream land use management<br />
to reduce the number and costs of floods.<br />
• Technical skills and management to increase<br />
productivity of small tanks and ponds for irrigation,<br />
fish and prawn cultivation.<br />
• Containment of inland aquatic pollution from<br />
agriculture, industry and other human activities.<br />
• Public education to enhance understanding of the<br />
functions and values of inland water resources and<br />
needs for watershed management.<br />
• Coordinated data gathering and research on inland<br />
aquatic resources.<br />
• Assessment of costs and benefits of new construction<br />
projects and watershed programs in terms of<br />
inland water resource sustainability.<br />
Sri Lanka needs to address a number of serious<br />
institutional constraints in order to increase the<br />
capacity for action on these concerns.<br />
Establish responsibility for management<br />
and research<br />
One major issue is confused government responsibility<br />
for inland aquatic resources. A multiplicity of<br />
government ministries and departments share jurisdiction<br />
over various aspects of inland resources and watersheds.<br />
Only the Mahaweli Authority has authority to<br />
manage the Mahaweli watershed, yet even it lacks un-
268<br />
shared, unambiguous responsibility to do so. Approximately<br />
25 agencies are involved in water resource<br />
research and management ranging from the Irrigation<br />
Department, to the Water Resources Board, to NARA,<br />
but their actions are poorly coordinated. The National<br />
Aquatic Resources Agency has broad research and<br />
research coordination authority over inland waters, but<br />
its responsibility for carrying out practical research<br />
linked with practical management needs remains unclear.<br />
Divided interests and overlapping functions<br />
among the agencies with limited staff capabilities and<br />
resources seriously constrain efficient water resource<br />
management.<br />
Set priorities for improved legal<br />
enforcement<br />
Laws and practices have failed to protect aquatic<br />
systems from unnecessary degradation. Abuses of legal<br />
requirements cited above - lack of stream buffers,<br />
settlements on bunds, failure to reduce soil erosion or<br />
rehabilitate gem pits — are well known and oft-discussed.<br />
On one hand these failures indicate administrative<br />
inefficiencies, carelessness, or<br />
malfeasance that can and should be corrected. On the<br />
other hand, they indicate basic difficulties in relying on<br />
regulations instead of incentives to achieve sound environmental<br />
management; people will not move off the<br />
bunds until they have somewhere else to live. In the<br />
long run, some laws and regulations may need to be<br />
changed. Nevertheless, clear law enforcement<br />
priorities can be set, based, for example, on measures<br />
of significant environmental and social harm and the<br />
practicality of compliance.<br />
Establish incentives for conservation<br />
Government enforcement of wetlands,<br />
floodplains, or watershed soils regulation is likely to fail<br />
unless local residents also have a stake in self-enforcement<br />
and can enjoy at least some of the benefits of their<br />
conservation efforts. Local residents need opportunity<br />
and incentives to participate sufficiently in the management<br />
of inland aquatic resources.<br />
Mechanisms do not exist to help upstream users<br />
benefit from their actions that can protect water supplies<br />
that downstream users depend upon. The<br />
benefits of water development projects have often been<br />
delivered solely to downstream areas that are physical-<br />
Inland Aquatic<br />
ly, culturally and politically distant from the catchment.<br />
The needs of the catchment dwellers are not often<br />
perceived as part of the development effort. This has<br />
created difficulties in achieving feasible land use in the<br />
catchments as well as optimal distribution, water<br />
quality, and runoff on which downstream suppliers<br />
depend. Catchment dwellers therefore need incentives<br />
to protect upland resources. Greater use of traditional<br />
forms of home garden plantings, ground cover, and<br />
other productive vegetation programs offer one possibly<br />
attractive incentive scheme.<br />
Incorporate benefits into projects and<br />
markets<br />
We undervalue environmental goods and services<br />
that aquatic systems provide. Government projects<br />
and programs often fail to assess the benefits of aquatic<br />
systems or the costs of their loss. Markets do not fully<br />
reflect the value of watersheds and inland aquatic<br />
resources, the products they produce or the environmental<br />
services they provide. Neither do they reflect<br />
the real costs of environmental degradation, whether in<br />
the form of soil loss in the catchments, or pollution and<br />
loss of aquatic habitats. Often the cost of wetland loss<br />
is passed directly to the people who depend the most<br />
on the ecological services of these resources.<br />
Establish<br />
barriers<br />
public dialogue over cultural<br />
Cultural beliefs can constitute barriers to sustained<br />
economic value of inland water resources. If raising<br />
and harvesting of fish from inland waters is perceived<br />
as contrary to religious teaching, the choice of not<br />
producing inland fish is appropriately left to public<br />
consideration. However, the nutritional, direct<br />
economic and other environmental costs of the choice<br />
need broad understanding. Among these costs: if fishing<br />
is not done in inland tanks and ponds, then residents<br />
may have less incentive to protect these resources from<br />
siltation, or pollution, with the consequent diminuition<br />
of other inland water values.<br />
Identify and redress key information gaps<br />
Lack of information on functions and values of<br />
inland aquatic resources, adverse impacts and trends,<br />
and benefits to be enhanced, are additional barriers to<br />
I<br />
I<br />
I<br />
I<br />
I<br />
I<br />
I<br />
I<br />
I<br />
I<br />
I<br />
I<br />
I<br />
I<br />
I<br />
I<br />
I<br />
I<br />
I<br />
I<br />
I
I<br />
II 1<br />
I<br />
I<br />
I<br />
I<br />
I<br />
I<br />
sustainable use of inland water resources. We know far<br />
too little about the values of inland water habitats to<br />
fish, birds, and wildlife, the impacts of pesticides and<br />
fertilizers on water quality and human health<br />
downstream. For example, evidence exists that<br />
sedimentation can impair tanks and reservoirs, but research<br />
can show precisely how serious the problem is,<br />
how to identify and rank the causes, and evaluate inter-<br />
References<br />
De Silva, Sena S (1988). Reservoirs of Sri Lanka and their fisheries.<br />
FAO Fisheries Technical Paper No. 298. Rome, pp.128.<br />
Fernando, CH. (1971). The role of introduced fish in fish production<br />
in Ceylon's freshwater*. The Scientific Management of<br />
Animal and Plant Communities for Conservation, ed. E. Duffey<br />
and A.S. Watt. Blaclcwell Scientific Publishers. Oxford, pp.<br />
295-310.<br />
Fernando, CH. and Indrasena. H.H.A. (1969). The freshwater<br />
fisheries of Ceylon. Bull. Fish. Res. Stn., Vol. 20 (2), Ceylon,<br />
pp. 101-134.<br />
Government of Sri Lanka (1986). Report of the Land Commission.<br />
Department of Government Printing, Colombo.<br />
Gunatilleke, I.A.U.N. and Gunatilleke. CV.S. (1983). Conservation<br />
of natural forests in Sri Lanka. Sri Lanka Forester. Vol. 16<br />
(1&2). pp. 39-56.<br />
I.U.CN. (1988). Directory of protected areas - Sri Lanka protected<br />
areas data unit. World Conservation Monitoring Centre. U.K.<br />
Inland Aquatic 269<br />
ventions. Where data is available, much of this information<br />
is incomplete, imprecise, and often out of date.<br />
Data collection and monitoring on inland water systems<br />
is still poorly developed and often not directed to the<br />
needs of policy makers or resource managers seeking<br />
sustainable development.<br />
I.U.CNVW.W.F. (1989). A directory of Asian wetlands. U.ICpp.<br />
583-634<br />
Koelmeyer» F.O. (1957). Climatic classification and distribution of<br />
vegetation-in Ceylon. The Ceylon Forester Vol. 3 (2). pp. 144-163.<br />
Mendis, A.S. (1977). The role of man-made lakes in the development<br />
of fisheries in Sri Lanka. Proc. IPFC Vol. 17 (3). pp. 247-254.<br />
Siriwcera, W.I. (1986). The inland fisheries in Sri Lanka: a historical<br />
perspective. ARTI. Colombo.<br />
U.S. Department of Interior. Fish and Wildlife Service. Classification<br />
of wetlands and deepwater habitats of the United States, by Lewis<br />
M. Cowadin; Virginia Carter, Francis C. Golet; and Edward T.<br />
La Roe (1979).<br />
TAMS (1980). Environmental Assessment of the Accelerated<br />
Mahaweli Development Program.<br />
Weatherry, Paul W. and Arnold, John H. (1977). Environmental<br />
Assessment of Stage II of Mahaweli Ganga Development Project.<br />
Colombo
270<br />
Environmentally sustainable development will meet the aspirations of future generations.<br />
I<br />
I<br />
I<br />
I<br />
I<br />
I<br />
I<br />
I<br />
I<br />
I<br />
I<br />
I<br />
I<br />
I<br />
I<br />
I<br />
I<br />
I<br />
I<br />
I<br />
I
I<br />
ÏÏ<br />
n<br />
n<br />
Toward Sustainable Development 271<br />
13 Toward Sustainable Development<br />
This profile indicates what environmental stresses<br />
must be reduced or eliminated to make sustainable<br />
development possible in Sri Lanka. This final chapter<br />
focuses on the priorities for response, and the practical<br />
opportunities for achieving substantial economic and<br />
other benefits from environmental actions.Success<br />
depends, however, on new and far more efficient institutional<br />
approaches to natural resource<br />
management.<br />
Trend is not destiny<br />
Sri Lanka can avoid the accelerating land degradation,<br />
urban and industrial pollution, impoverishing<br />
desertification and deforestation, and degradation of<br />
irrigation systems that now waste the economic, social,<br />
and natural resources of so many developing countries.<br />
Like them, Sri Lanka suffers steady degradation of the<br />
environment. As demands on natural resources rise<br />
they diminish future development opportunities. But<br />
at ihis point in its history the island's water, land,<br />
biological diversity, climate, and levels of health and<br />
literacy are in far better condition than in most developing<br />
countries of Asia and elsewhere. By marshalling<br />
knowledge, establishing priorities, and applying practical<br />
environmental management, Sri Lanka can alter<br />
the disturbing trends and improve its future prospects.<br />
Sustainable development initiatives<br />
Given the failure of so many rapidly developed<br />
countries to incorporate environment into their<br />
development programs, what patterns of development<br />
will best meet the needs of present and future generations?<br />
Sri Lanka is mapping its own paths toward<br />
environmentally sustainable development. Three<br />
policy objectives have particular significance for<br />
natural resources:<br />
• One is to strengthen agriculture by diversifying<br />
products and improving yields. This can be<br />
achieved on a sustainable basis through methods<br />
that conserve soil and water quality.<br />
• Another is to earn foreign exchange and create new<br />
jobs by developing industries based on agriculture,<br />
and imported or domestic raw materials. To<br />
avoid costly pollution such actions must be<br />
grounded in cost-effective, environmentally<br />
protective science and technology.<br />
• A third is to enhance rural conditions and incomes<br />
by expanding economic and environmental opportunities<br />
at the village level. To maximize the "free"<br />
services of the environment requires incentives for<br />
community forestry, forest gardens, and productive<br />
fisheries supplemented by other sustainable<br />
employment programs.<br />
CAUSES <strong>OF</strong> <strong>NATURAL</strong><br />
RESOURCE<br />
USE AND MISUSE<br />
Significant global forces<br />
on the environment<br />
Global trade and political forces have historically<br />
affected Sri Lanka's environment and they continue to<br />
do so. Global political and market forces directly affect<br />
the health of the plantation economy, the development<br />
of tourism, the costs and use of petroleum imports, and<br />
foreign investment in trade and industry. Global<br />
production of energy, particularly from coal and other<br />
fossil fuels, and destruction of tropical forests are apparently<br />
warming the earth and raising sea levels. Sri<br />
Lanka's climate and coastline will be affected in ways<br />
still not precisely clear.<br />
Poverty cycle<br />
Poverty driven by unemployment causes environmental<br />
degradation from which the poor suffer most<br />
directly. Data connecting these causes and effects are<br />
regrettably limited but several conclusions are obvious.
272<br />
Poverty and certain cultural habits induce the shifting<br />
cultivation that curbs productivity of Sri Lanka's lands<br />
and waters. Poverty and organized timber poaching<br />
cause significant deforestation, with similar results.<br />
The poor suffer first and most from waterborne diseases,<br />
caused in part by unsanitary urban and rural<br />
conditions. Evidence from other countries, applicable<br />
in Sri Lanka, shows that the poor suffer first from<br />
inhalation diseases — from smoke in their own dwellings,<br />
factories, and vehicles — and irrevocable lead<br />
poisoning from petroleum fumes and dust.<br />
Domestic economic policies<br />
Sri Lanka's land and water uses have been recently<br />
and visibly affected by large projects like the<br />
Mahaweli Development Project, but economic policies<br />
have had even more pervasive and profound effects.<br />
These include tax, fiscal, and social policies that discourage<br />
or favor private investments in industry, private<br />
land ownership, and'international trade. With the<br />
government owning 80 percent of the land, impacts of<br />
budgetary action govern land and water use in plantations,<br />
forests, protected areas, and elsewhere, including<br />
cities. Precise impacts of economic policies on environmental<br />
results are too often unclear and failures<br />
to be concerned about these links too common. If<br />
environmental and natural resource values are not systematically<br />
incorporated into economic as well as<br />
political decisions, significant natural resource misuse<br />
and environmental degradation can be expected to<br />
continue.<br />
Population growth and demographic shifts<br />
Demographic changes — another worldwide<br />
phenomenon - will make Sri Lanka's environmental<br />
problems increasingly difficult to correct. Present<br />
levels of unemployment, poverty, land degradation, and<br />
pollution are essentially unsustainable for the existing<br />
population of 17 million. Sri Lanka must nevertheless<br />
plan for a population of roughly half again as many<br />
people within the next fifty years. That means vast new<br />
demands for land, water, biomass, food, and services.<br />
The push and pull to urban areas, though not so<br />
strong as in many countries, will cause environmental<br />
stress nonetheless. Best estimates indicate that urban<br />
Toward Sustainable Development<br />
population will rise from 22 percent to 30 percent by<br />
the year 2000, meaning an increase of over 80 percent<br />
in the current urban population. These new residents<br />
will need new investments in water supply, sewers and<br />
drainage. Approximately 800,000 new housing units will<br />
be required between 1990 and 2000. Heavy population<br />
concentrations will continue in Colombo and in the Wet<br />
Zone, which contains the greatest biological resources<br />
and fewest protected areas.<br />
CONSTRAINTS ON<br />
SUSTAINABLE DEVELOPMENT<br />
Five major environmental conditions and trends<br />
will most likely constrain long-term sustainable welfare<br />
and growth b Sri Lanka: land and watershed degradation,<br />
loss of biological resources, contamination of<br />
ground and surface water, and pollution of the urban<br />
environment. Within these five categories all worthy<br />
needs cannot be addressed with equal effort. Practical<br />
priorities require immediate focus on correcting environmental<br />
conditions most likely to injure, kill or<br />
impoverish Sri Lankans, and on actions most likely to<br />
bring tangible environmental benefits to the next<br />
generation. Preventive and corrective environmental<br />
actions can enhance national wealth and the human<br />
environment.<br />
Land degradation<br />
Shifting cultivation. Chena cultivation is increasingly<br />
practised on vulnerable areas with little or no<br />
rotation. Throughout the island acreage under chena<br />
has risen since the mid-1950s from 1 million to 1.2<br />
million hectares, despite laws against it. In some<br />
regions it accounts for many of the costly earth slips.<br />
Considered unsustainable and undesirable by the First<br />
Land Commission more than sixty years ago, its ill<br />
effects are even more serious today.<br />
Soil erosion and productivity. Efforts to increase<br />
yield per hectare of plantation and other diversified<br />
crops confront land degradation from soil erosion,<br />
overuse of fertilizers and pesticides, and rising costs of<br />
these inputs. Sri Lanka's soils are vulnerable to<br />
erosion, primarily from high intensity rainfall. One<br />
year's erosion can easily remove soils requiring a century<br />
to build. Now that nearly all available paddy lands
I<br />
I<br />
are already in use, paddy yields appear to be levelling<br />
off, while costs of inputs (tractors, fertilizers, pesticides)<br />
are increasing. All tea plantations are highly<br />
prone to erosion. Average yield of Sri Lanka's tea<br />
plantations is low compared to other countries.<br />
Land use. With the increasingly unfavorable ratio<br />
of people to land localized causes and effects of land<br />
waste and degradation assume new importance. Gem<br />
mining without regard for water pollution or reclamation<br />
is evident in all gem-bearing areas. It makes land<br />
unnecessarily unproductive and, by creating habitats<br />
favorable to malaria, it threatens human health. Most<br />
opportunities for large new land settlement are gone,<br />
although potentially important in some regions on a<br />
small scale. The 2.5 million hectares (38 percent of the<br />
island) identified throughout the island (mostly in the<br />
Dry Zone) as available for forests, farms, settlements<br />
or other development require water to be productive.<br />
But fresh water, although comparatively abundant in<br />
Sri Lanka, nevertheless is becoming increasingly<br />
scarce; half of all available surface water in the Dry<br />
Zone is used before it reaches the sea. At the same time,<br />
nearly 14 percent of the country is under wildlife conservation<br />
or other protected status. Some of this land<br />
may be more productive in other uses, yet the critical<br />
areas within the biologically rich Wet Zone are not<br />
adequately protected.<br />
By reducing and eventually eliminating<br />
chena cultivation on steep slopes and replanting<br />
these areas with grasses or trees Sri Lanka can<br />
achievefarmore sustainable use of its lands and<br />
watersheds. New opportunities can be<br />
developed for farmers through productive use of<br />
agro-forestry systems in place of chena. Incen~<br />
lives to reduce soil erosion on agricultural<br />
croplandas well as chena land will help preserve<br />
watersheds, maintain options for small<br />
hydropower development, extend the life of existing<br />
reservoirs, and retain or improve soil<br />
productivity. Watershed management has become<br />
a national necessity in the catchment<br />
areas of Sri Lanka's major rivers.<br />
Watershed degradation<br />
Water resource degradation. Poor land use<br />
steadily reduces the value and availability of Sri Lanka's<br />
Toward Sustainable Development 273<br />
abundant water resources. Agricultural practices<br />
cause high siltation rates in many Dry Zone tanks and<br />
upcountry reservoirs. Sedimentation of tanks, irrigation<br />
works, and upcountry reservoirs results directly<br />
from soil loss in catchment areas. Aerial photo comparisons<br />
of 1956 and 1982 illustrate high rates of siltation<br />
from clearing in Dry Zone catchments for<br />
agriculture and settlements. Development programs<br />
will require far better information than before on the<br />
economic and environmental relationship between soil<br />
erosion and the productivity of land and water.<br />
Small hydro. Because Sri Lanka has already<br />
developed most of its available large-scale<br />
hydroelectric sites to produce 90 percent of its electric<br />
power, use of small, hydropower plants may become<br />
increasingly important. Their development will become<br />
more attractive if oil prices rise above US<br />
$40/barrel, but long-term capabilities of small<br />
hydroelectric generating sites will be reduced without<br />
careful conservation of watersheds.<br />
Sri Lanka's abundant water, and its high<br />
proportion of tenue water bodies tó land area,<br />
are resources that can. be envied around the<br />
world. Although all its watersheds are important,<br />
priorities for management are essential.<br />
Watershed classifications, based on value and<br />
vulnerability, can be a useful first step toward<br />
determining which areas need management attention<br />
or special protection first Local initiatives<br />
and management activities are essential to<br />
achieve conservation. Results wiU depend on<br />
how well the local public and the government<br />
understand the links between watershed<br />
management and increased productivity -^from<br />
forest gardens and agricultural systems to<br />
hydroelectric generation.<br />
Biological resource degradation<br />
Biological resources. Sri Lanka's flora and fauna<br />
are the richest and most concentrated in Asia. A high<br />
level of endemic species is contained chiefly within the<br />
Wet Zone, the country's most populated region. Large<br />
numbers of species found in the 45,000-hectare group<br />
of Sinharaja forests are found nowhere else. Overall<br />
the biological resources that draw tourists to the
274<br />
country — coral reefs, wild elephants, and native and<br />
migratory birds — represent non-renewable, irreplaceable<br />
genetic and ecological resources of global importance.<br />
All these resources are under stress.<br />
Forest resources. Sri Lanka's declining natural<br />
forests — repositories of many of its most valuable and<br />
vulnerable biological resources - have global as well as<br />
national significance. At an annual deforestation rate<br />
of over 40,000 hectares, the island's estimated 24 percent<br />
natural forest cover in 1989 is down from 44 percent<br />
in the 1950s. While declines have been less rapid<br />
than in Thailand or Nepal, they have been relentless.<br />
In general, every hectare deforested becomes a hectare<br />
less resilient and less productive, in even the span of a<br />
few years. Despite encouraging institutional changes<br />
and new forest programs,deforestation continues.<br />
Forest depletion is most significant in the already highly<br />
altered Wet Zone, where 100,000 hectares of natural<br />
forests have been lost since 1956. The size of the<br />
remaining forests has also diminished, significantly<br />
reducing Sri Lanka's biological resilience as increasing<br />
numbers of flora and fauna species become endangered<br />
or threatened.<br />
Coral reefs. High losses of live coral reefs over<br />
the past 10 to 15 years continue virtually unabated.<br />
Losses over the past 20 years have reached 80 percent<br />
at some southwest coast locations and remain high at<br />
many others. Conditions on the east coast are known to<br />
be poor but they cannot be assessed accurately due to<br />
civil disorder. In the southwest most destruction results<br />
from reef mining for the manufacture of Urne. Loss of<br />
live coral means loss of natural coastal erosion protection,<br />
ornamental fish habitat, and tourist attraction.<br />
Within a decade or so most coral, except the highly<br />
protected reefs near established tourist sites, will be<br />
destroyed.<br />
Wetlands and flood plains. Over the past two<br />
decades nearly 70,000 hectares of low-lying marshy<br />
areas have been filled or identified for reclamation.<br />
Pollution has degraded other significant coastal wetlands<br />
and estuaries important to the coastal fisheries,<br />
although data on resulting economic impacts on coastal<br />
fisheries do not exist. Throughout Sri Lanka - inland<br />
and along the coasts - degradation and filling of wetlands<br />
have contributed to the loss of natural flood<br />
Toward Sustainable Development<br />
protection, productive wildlife habitat and other<br />
resources. The most significant wetland losses have<br />
been in the Mahaweli flood plains, where the Mahaweli<br />
program is estimated to reduce natural flooding areas<br />
of marshes and villus by 50 percent.<br />
By arresting the loss of natural forests, particularly<br />
in the Wet Zone, and coastal habitats<br />
Sri Lanka can sustain and increase tourism,<br />
provide jobs for villagers as guards, maintenance<br />
personnel and guides, and support the<br />
growth of horticultural plants, fruits and<br />
vegetables for home use and business. By<br />
protecting flood plains and wetlands Sri Lanka<br />
can avoid or reduce costs of flood relief, resettlement,<br />
and investments in flood protection.<br />
Contamination of ground<br />
and surface water<br />
Nitrate pollution. Contamination of fresh waters<br />
by nitrates in fertilizers and human waste is a growing<br />
threat to human health. Intensive agriculture and<br />
human waste disposal in the Jaffna Peninsula already<br />
cause pollution of ground and surface water. Peak<br />
seasonal concentrations of pollutants in the Kalpitiya<br />
peninsula have reached four times the WHO guideline.<br />
Low levels of industrialization have kept industrial pollution<br />
of the Mahaweli below that of the Kelani, but<br />
nitrate concentrations show a definite upward trend<br />
due to heavy agrochemical usage in the catchment.<br />
Expansion of the agricultural and agro-based industrie '<br />
sector will require careful monitoring and impact<br />
analysis.<br />
Domestic and untreated pollution. Urban and<br />
rural water pollution from domestic, industrial, and<br />
agricultural waste also threatens human health. In<br />
Colombo less than a third of the greater metropolitan<br />
population is sewered, but waste water discharge is not<br />
treated. Most industry is centered in and around the<br />
Western Province, yet nearly all industrial waste is<br />
untreated. It accounts for much of the contamination<br />
of Colombo's waterways, along with the water pollution<br />
caused by the urban poor. In Kandy, Galle, Jaffna and<br />
smaller cities and towns, no sewers exist; most residents<br />
use on-site waste disposal, and a high proportion of<br />
wells are unprotected. Water pollution has direct impacts<br />
on industrial users as welL In some places, as with<br />
I<br />
I<br />
I<br />
I<br />
I<br />
I<br />
I<br />
I<br />
I<br />
I<br />
I<br />
I<br />
I<br />
I<br />
I<br />
I<br />
I<br />
I<br />
I<br />
I<br />
I
n<br />
the Puttalam aquaculture industry, it directly harms the<br />
industry itself.<br />
Many urban as well as rural areas, including outskirts<br />
of the Greater Colombo metropolitan area, rely<br />
on ground water for drinking supplies. In rural areas<br />
only S percent of homes had piped water at the last<br />
census (1981), and anecdotal evidence - all we have to<br />
rely on -- suggests that ground water as well as surface<br />
water contamination is a growing hazard to health.<br />
Outbreaks of waterborne diseases continue to cause<br />
death and illness in the cities, most recently in Maale.<br />
The health benefits of water pollution controls<br />
are themselves enough to justify effective<br />
action. Benefits of improved water quality for<br />
fisheries as well as recreation cannot be underestimated.<br />
Opportunities exist for low-cost<br />
responses and for economically attractive expenditures<br />
on infrastructure to serve new industrial<br />
and housing complexes. Educational<br />
programs on sanitation, drainage clearance,<br />
and many other cost-effective controls over pollution<br />
discharge front industry can all achieve<br />
significant results. Pricing and other policies<br />
that encourage water conservation can reduce<br />
demands on ground and surface water.<br />
Degradation of the urban environment<br />
Water pollution and drainage. Colombo and<br />
many smaller cities suffer from combined environmental<br />
stresses that have led to significant deterioration of<br />
health and living conditions. Lack of adequate infrastructure<br />
to supply water and sewer services is a<br />
growing threat to resident health, particularly of the<br />
poor. Filling of wetlands in Colombo — estimated at<br />
over 200 hectares since 1968 — has contributed to flooding<br />
and inadequate drainage systems. Contamination of<br />
ground as well as surface water is a growing, immediate<br />
problem affecting all urban areas. In the long term<br />
planning for water supply and drainage may need to<br />
anticipate the potentially significant and costly effects<br />
of sea level rise caused by global warming.<br />
Low income housing. Encroachment of the poor<br />
on canals and river banks contributes to water pollution.<br />
Approximately half of Colombo's population<br />
Toward Sustainable Development 275<br />
belongs to the low income category, and many of the<br />
poor live in slums and shanties. With little or no access<br />
to sewage services* they contribute to and suffer from<br />
water contamination. Adequate housing is an integral<br />
part of the environmental solution to urban decay.<br />
Air pollution. Added to these problems are the<br />
effects of urban air pollution, largely from vehicles, but<br />
also from some industries. Monitoring data are badly<br />
needed to identify links of air pollution to respiratory<br />
diseases and lead poisoning from urban dust. Health<br />
statistics in other Asian countries show alarming increases<br />
in respiratory illnesses and lead poisoning from<br />
vehicle emissions. Incidence of lead poisoning increased<br />
fourfold in Bangkok over a recent ten-year<br />
period.<br />
Loss of amenities. Urban residents in developing<br />
countries, Sri Lanka included, suffer increasingly from<br />
loss of open spaces and other amenities. Colombo's<br />
experience with Beira Lake is an example to avoid.<br />
Parks, urban beachfronts, and other open spaces that<br />
serve essential needs for recreation have tangible and<br />
intangible benefits. Their loss can contribute significantly<br />
to a declining quality of urban life.<br />
Solid waste. Rapid increase in the generation of<br />
domestic solid waste in Colombo and other cities<br />
results in new health hazards as well as an ugly environment.<br />
Solid waste management has become recognized<br />
as one of Sri Lanka's highest urban priorities. At<br />
present municipal services cannot keep up with<br />
demands for collection and sanitary disposal.<br />
Solutions to urban degradation include effective<br />
environmental management Managing<br />
urban pollution requires financing for infrastructure<br />
and effective land use zoning that<br />
respond to the environmental costs of water<br />
pollution, poor drainage, noise and traffic, and<br />
to the cost-effective benefits of sound environmental<br />
design. Much can be done to avoid environmental<br />
problems in new urban areas.<br />
Environmental factors are being recognized in<br />
developing an impact assessment for the<br />
Muthurajawela marsh north of Colombo.
276<br />
Using scientific infónrotioff on the hydrology'<br />
and humas uses of-dits marsh/lagoon system,,<br />
planners seek way^ö»; accommodate many<br />
conflicting functionsand values with needs for<br />
urban development. Experience in other<br />
cities, including the Hackensack<br />
Meadowtands across the Hudson River from<br />
New York City, indicates how severely wasted<br />
urban marshlands c?" be productively used in<br />
harmony with the environment<br />
POLICY RESPONSES<br />
Integrating biological resources into<br />
development and planning<br />
Newly Industrialized Countries and other<br />
aspirants now realize that some patterns of economic<br />
growth create serious, environmental and economic<br />
problems. In Sri T.anka, growth policies that protect<br />
and build on the economic and environmental value of<br />
biological resources can avoid many of these costs<br />
without risking the benefits of actions to increase industrial<br />
and agricultural productivity.<br />
Natural forest conservation. The richest natural<br />
forests are found in the densely populated southwestern<br />
Wet Zone. Relatively small patches of natural<br />
forest still provide quantities of berries, fruit, nuts,<br />
game, medicinal substances, horticultural plants and<br />
flowers that can, if properly cultivated and marketed,<br />
bring substantial economic benefits to Sri Lanka, as<br />
they have in Indonesia and elsewhere. Besides their<br />
incalculable genetic and ecological significance,<br />
natural forests support village uses that are sustainable,<br />
as experience around the Sinharaja forests indicates.<br />
They also draw tourists.<br />
Enhancement of forest garden systems. Highly<br />
developed in many parts of Sri Lanka, forest gardens<br />
.can supply domestic fuel and produce fruit, vegetables<br />
and timber for multiple uses that have substantial<br />
economic value. Forest gardens can be created even on<br />
marginal land within a few years. Opportunities to<br />
expand forest gardens to enhance farmer income<br />
depend in part on commercial marketing for fruit,<br />
vegetables, and horticultural products.<br />
Toward Sustainable Development<br />
Environmental tourism expansion. Tourism, on<br />
the upswing after a drop in the mid-1980s, provides<br />
significant direct and indirect employment to rural and<br />
urban Sri Lankans. Visitors who seek birds, wildlife,<br />
and underwater environments can contribute substantially<br />
to high-quality, high-revenue tourism. However,<br />
complex ecological systems must be carefully managed<br />
to guard against the well-known self-destructive impacts<br />
of tourism. Successful environmental tourism<br />
depends on effective management of wildlife reserves,<br />
well-designed visitor facilities, and adequate environmental<br />
education materials. The natural resources that<br />
draw tourists - whether forests, wildlife reserves, or<br />
coral reefs — must be immediately protected by strong<br />
enforcement. Alternative employment must be<br />
provided for those who, like offshore coral miners, now<br />
diminish Sri Lanka's sustainable resources.<br />
Conservation of hydrologie resources. Wetlands<br />
and flood plains provide valuable "free" services for<br />
flood control, filtering of water pollutants, and nursing<br />
grounds for fish and wildlife. These functions might be<br />
better appreciated if they were translated into distinct<br />
economic values as has been done in the United States<br />
and elsewhere. Loss of wetlands and the degradation<br />
of important flood plains by human settlement have<br />
contributed to flooding and high costs of flood relief.<br />
Coastal and inland fisheries management.<br />
Fisheries suffer increasingly from overuse and environmental<br />
degradation. Per capita fish consumption is<br />
increasing. Offshore fisheries can be sustainably exploited<br />
but opportunities to sustain near-shore fisheries<br />
need greater attention. Coastal habitats essential for<br />
coastal fishery production - coral reefs, estuaries and<br />
lagoons, highly vulnerable mangroves, salt marshes and<br />
seagrass beds — are immensely productive resources.<br />
Inland fisheries, if managed and protected from pollution<br />
and other physical impacts, offer additional and<br />
significant economic benefits to local residents.<br />
Correcting Institutional Constraints<br />
In general, Sri Lanka's natural resource management<br />
suffers from a variety of serious institutional inefficiencies:<br />
• confused or poorly coordinated environmental<br />
management responsibilities of a multiplicity of
government agencies, including those managing<br />
the 80 percent of the country that is owned by the<br />
government;<br />
• failure of the state to set and achieve high standards<br />
for controlling pollution from state-owned<br />
enterprises, and lack of clear private responsibilities<br />
and incentives for environmental management;<br />
• inefficient systems for gathering, analyzing, and<br />
applying environmental information to plans and<br />
operations of private or public sector agencies;<br />
• failure to incorporate environmental impacts into<br />
economic development plans, programs, and<br />
projects of the public and private sector.<br />
Underlying these institutional problems are essential<br />
needs for more and better focused environmental<br />
information, substantive training, and management<br />
skills in public cooperation, agency coordination, and<br />
organizational management followup actions.<br />
Efficient environmental management<br />
cooperation<br />
Overlapping and uncoordinated environmental<br />
action by government is not surprising. Environmental<br />
management affects every government sector and most<br />
private activities. But business-as-usual approaches<br />
will not suffice. When agency responsibilities are unclear,<br />
"red tape" and bureaucratic delays or inaction<br />
inevitably cost the environment and the economy<br />
dearly.<br />
Nowhere are these problems more evident than in<br />
watershed management, where efficiency and effectiveness<br />
are paramount needs. Activities affecting land<br />
and water management involve scores of agencies and<br />
statutes. The Water Resources Chapter (Part I)<br />
describes how little has been accomplished in managing<br />
watersheds, largely because of confusing, conflicting,<br />
and ineffective authorities. The inescapable conclusion:<br />
unless the interaction of government agencies<br />
is drastically simplified, effective watershed management,<br />
even under the most scientifically advanced<br />
policies, will be exceedingly difficult, if not infeasible.<br />
Duties, responsibilities and lead agency capabilities<br />
Toward Sustainable Development<br />
277<br />
need to be identified for particular watersheds of major<br />
rivers that have the most severe problems. Gaps in legal<br />
authority and management capabilities need to be<br />
clarified and actions prepared for their remedy.<br />
Recent administrative experiences in Sri Lanka<br />
suggest that these constraints can be reduced. The<br />
concept of "lead agency" responsibilities for significant<br />
aspects of environmental and economic development<br />
has been successfully initiated. In the energy sector, the<br />
CËB has lead responsibilities for energy development,<br />
but it must work closely with other agencies and the<br />
Coastal Conservation Department has clear responsibility<br />
for land management in a narrowly defined<br />
coastal zone. Expansion of such lead responsibilities<br />
will come under the new environmental impact assessment<br />
procedures of the National Environmental Act<br />
Amendments of 1988. These require an active role by<br />
the CEA to clarify agency responsibilities for gathering,<br />
analyzing, and applying environmental impact information.<br />
CEA can help government agencies sort out their<br />
environmental management responsibilities for<br />
proposed development projects, and see that one agency<br />
takes the lead in impact assessment.<br />
Private responsibilities and incentives<br />
Establishing incentives. Successful actions to control,<br />
industrial and agricultural pollution, or to prevent<br />
chena cultivation, coral destruction, illicit gem mining,<br />
timber felling and natural forest encroachment require<br />
adequate incentives, penalties or appropriate combinations<br />
of the two.<br />
On one hand, progress in reducing industrial pollution<br />
depends on Sri Lanka's strong enforcement of<br />
industrial pollution laws, backed by scientifically supportable<br />
standards. A private business will not usually<br />
invest in costly control equipment, recycling, or process<br />
changes unless its own operations will benefit or it is<br />
required to do so. A government-owned industry,<br />
while ideally expected to set a high environmental<br />
standard, may be poorly structured financially to make<br />
pollution control investments. Strong enforcement of<br />
pollution control is necessary for public as well as<br />
private industries. Because they have acceptable<br />
economic alternatives, enforcement can be particularly
278<br />
effeaive against large commercial concerns that violate<br />
timber and wildlife laws.<br />
On the other hand, sole reliance on "command and<br />
control" management techniques has proved a failure<br />
in many cases involving large numbers of individuals or<br />
small operators. Remedies for soil erosion, for example,<br />
will increase costs to upstream users, but only<br />
downstream users will realize the immediate benefits.<br />
Programs that build on incentives can make it<br />
worthwhile for upstream farmers to control soil<br />
erosion. One company in Sri Lanka has found success<br />
in programs that will only pay fanners for their produce<br />
if they meet soil erosion criteria specified by company<br />
inspectors. Various economic and legal tools exist to<br />
develop incentives that benefit small- and large-scale<br />
operations.<br />
Creating a stake in sound environmental<br />
management. Sri Lanka's experiences with natural<br />
resource mismanagement illustrate the need for individual<br />
landowners or communal organizations to<br />
have a stake in sustainable natural resource management.<br />
Fishing communities often recognize the value<br />
of coral reefs and protect them; So do owners of glassbottom<br />
boats and other tourist guides and operators.<br />
Inland, land stewardship may best be sustained if<br />
tenure systems provide the necessary security and opportunity<br />
for owners to derive benefits from long-term<br />
investments in forests, farms, water systems, or other<br />
natural resources. This profile highlights the needs for<br />
considerably stepped-up research on land tenure and<br />
ownership and how it affects and might improve efficient<br />
long-term resource use.<br />
Improving information gathering,<br />
analysis, and use<br />
Research and information needs. This profile has<br />
highlighted gaps in natural resource and environmental<br />
information and research that have already led to<br />
misunderstanding and costly misuse of natural<br />
resources. Determination of research priorities goes<br />
beyond the profile's scope, but subjects to consider<br />
include the following:<br />
• a comprehensive water quality monitoring program<br />
for streams, rivers, tanks, and estuaries,<br />
beginning with the most important water bodies, to<br />
Toward Sustainable Development<br />
establish baseline data and effective water quality<br />
standards;<br />
• assessments of fish stock in coastal and inland<br />
waters from which to evaluate trends and develop<br />
sustainable fisheries activities;<br />
• a program to assess ground water conditions and<br />
trends, including quantity as well as contamination;<br />
• applied research on cost-effective pollution minimization<br />
technology that is appropriate and applicable<br />
to Sri Lanka's major polluting industries;<br />
• ecological studies of appropriate uses to be made<br />
of the 25 million hectares of "developable" land<br />
identified by the Land Commission;<br />
• studies to determine the present status of stream<br />
bank and reservoir reservations and their future<br />
conservation;<br />
• ways to reduce wastage of timber and biomass and<br />
practical means to improve silviculture for energy<br />
and forest conservation;<br />
• studies to determine trends in biological productivity,<br />
resilience and the actual and potential<br />
economic and social values of biological and<br />
hydrologie systems;<br />
• land use studies in elevations above 1,500 meters to<br />
determine appropriate conservation programs in<br />
the face of frequent violations of forest laws.<br />
Efficient analysis of information. Important environmental<br />
information, although gathered, is often<br />
unavailable. This problem was highlighted in particular<br />
by the Water Resources Chapter (Part II) concerning<br />
water pollution. Sri Lanka can make more<br />
cost-effective use of information gathered through<br />
cooperative agreements on laboratories and the publication<br />
and dissemination of information to all who need<br />
it. The need for easier access by government, private<br />
sector, professional and citizen users of information has<br />
been a striking finding of this profile. No library exists<br />
to obtain, log, and make available current studies on<br />
natural resource and environmental topics. As a result,<br />
despite the need to maximize the efficiency of available<br />
human and financial resources, substantial duplication
exists in the preparation of studies and in the gathering<br />
of information.<br />
Once obtained, information is still not readily available<br />
for application to problems. It is particularly important<br />
to maximize the use and efficiency of critical<br />
information for application in environmental impact<br />
assessments. Beyond that, policy makers need to be<br />
guided by the information, and see that it is actually<br />
applied to plans and operations.<br />
Integrating environmental impacts<br />
Frequent failures of planning. Planning is an institutional<br />
tool traditionally used and encouraged for<br />
natural resource management. In practice broad<br />
natural resource management plans like the National<br />
Conservation Strategy are often ineffective if implementation<br />
is not required or specifically linked to<br />
funding or project approval. Implementors need to<br />
have a stake in implementation results.<br />
Environmental Impact Assessment. Today one of<br />
Sri Lanka's most potent planning and information tools<br />
is the environmental impact assessment requirement.<br />
The requirement for agencies and private business to<br />
obtain and analyze data on significant impacts of<br />
proposed action, and to disclose it to other agencies<br />
and the public before action can be taken, can bring<br />
about significant institutional change. Impact assessment<br />
is being applied in forestry management, and it<br />
has already shown its importance in the inter-agency<br />
and public debate over construction of a major coalfired<br />
power plant at Trincomalee.<br />
No single institutional measure over the past<br />
decade shows more promising possibilities. Its application<br />
to a wide range of economic development<br />
proposals with significant environmental impacts will<br />
require a new level of training and analytical abilities.<br />
The EIA mechanism aims to improve information and<br />
opportunities for public involvement, for coordinating<br />
government agencies and for close public and private<br />
cooperation. Experience in other countries, most<br />
notably the United States, shows that after an initial<br />
period of sometimes painful development, the EIA can<br />
become a routine tool for analysis and information<br />
disclosure. That promising result will depend on adequate<br />
numbers of highly-trained personnel as well as<br />
Toward Sustainable Development 279<br />
understanding of EIA functions and values by policy<br />
makers.<br />
Economic assessments. Integration of economic<br />
and environmental analysis is essential for practical<br />
political and financial decision making. By translating<br />
what we know about natural resource capital — forests,<br />
good farmland, water resources, and ecological functions<br />
and values ~ we can better measure the effects of<br />
adverse impacts on them, and how these resources<br />
benefit society over the short and the long term. Efforts<br />
to improve national accounting systems are underway<br />
in developing and developed countries, and efforts are<br />
beginning in Sri Lanka as well.<br />
VISION <strong>OF</strong> THE FUTURE<br />
What path can Sri Lanka take to sustain economic<br />
development and maintain its natural resource<br />
heritage?<br />
At the outset Sri Lanka must now anticipate and<br />
plan for sustaining the future economic, social, and<br />
environmental needs of 23 to 25 million people. This is<br />
possible; much higher population density can be<br />
managed without loss of significant natural resource<br />
and environmental assets. Prosperous newly<br />
developed countries like Singapore and older ones like<br />
the Netherlands have shown that high density can be<br />
maintained through careful planning while increasing<br />
opportunities for employment. On the other hand, Sri<br />
Lanka must avoid the costly experiences of developed<br />
countries with the adverse impacts -- resource depletion<br />
and pollution of land, air, and water ~ that threaten<br />
human health and raise economic and environmental<br />
costs.<br />
To avoid or minimize these adverse impacts, costs<br />
of pollution can be included in the prices of goods and<br />
services. A clean environment will depend on incentives<br />
for individuals and private enterprises to reduce<br />
pollution and other adverse impacts for reasons of self<br />
interest. It will also depend on efficient government<br />
standards, regulations and enforcement. Developed<br />
countries with a backlog of pollution can find environmental<br />
programs costly and difficult. Sri Lanka is<br />
blessed with conditions of pollution that can readily be<br />
solved with existing technology.
280<br />
To sustain a future population of roughly half again<br />
as many people will require well planned urban areas.<br />
Sri Lanka's cities can be made productive centers of<br />
clean industry that offer employment for the growing<br />
thousands of people needing jobs. By offering well paid<br />
employment, pressures on critical resources can be<br />
relieved. With careful urban planning and sound<br />
design of homes and transportation and sanitation systems,<br />
urban area» can be pleasing as well as productive<br />
habitats. Supplies of clean water can be obtained from<br />
the ample surface water and ground water systems as<br />
long as waste disposal is carefully monitored and regulated.<br />
To compensate for increased urban density,<br />
urban parks and lakes can be designed and maintained<br />
for more intensive public use. Green space and opportunities<br />
for home gardens in low-rise garden apartments<br />
can offer opportunities for humane and pleasing<br />
urban life. It is still possible, with moderate investments,<br />
to bring Sri Lankan cities to a high position on<br />
the habitability scale.<br />
To connect cities and villages Sri Lanka can have a<br />
well-maintained road and rail transportation system,<br />
building on a system that was far advanced after Independence.<br />
Better use of rail passenger and freight<br />
resources can substantially speed and increase<br />
transport of goods and people, including tourists, while<br />
helping to conserve energy and reduce pollution.<br />
Not all new urban population needs to be concentrated<br />
in Colombo or other large cities. A strong<br />
agricultural base can support new agro-industries in<br />
and around smaller cities and villages. Small cities,<br />
based on agro-industrial activities can cater to the<br />
needs of surrounding villages. This concept of<br />
agropolitan centers will require dependable transportation<br />
and advanced communication systems to serve<br />
the needs of rural areas.<br />
Higher agricultural productivity can be achieved<br />
through adoption of high value crops without costly<br />
reliance on pesticides and other inputs that damage<br />
sustainable productivity. Sri Lanka can adopt integrated<br />
pest management and improve traditional<br />
means for agricultural management that protect not<br />
only the health of consumers, agricultural and industrial<br />
workers, but also the environment.<br />
Toward Sustainable Development<br />
Reforestation and rehabilitation of grasslands will<br />
depend on application of sound scientific methods and<br />
adequate incentives to property owners and private<br />
entrepreneurs. Some relatively unimportant wildlife<br />
reserves can be converted to enhance agricultural<br />
productivity. Unprotected areas important for their<br />
biological diversity and value can be acquired and<br />
managed. Other new areas, now lying fallow and<br />
degraded following chena cultivation in the biologically<br />
rich and critically important Wet Zone, can be acquired<br />
for forestry and agriculture. Opportunities for environmentally<br />
sensitive tourism in coastal as well as inland<br />
areas can become significant economic assets. The<br />
design of new hotels and tourist facilities can be accomplished<br />
without disrupting the visual integrity of Sri<br />
Lanka's landscape. The world-renowned architecture<br />
of Geoffrey Bawa and others has already established a<br />
standard of design excellence.<br />
Sustainable development in Sri Lanka is a realistic<br />
prospect. Success will depend on initiatives that<br />
develop and apply the necessary skills, resources, and<br />
commitment, from the village to the national level.
'V • (• • •<br />
Sponsored by the United States Agency for International Development