- Page 1 and 2:
SEPTEMBER 2009 S S T A G E ññ IV
- Page 3 and 4:
SWOT Analysis for Thiruvathipuram M
- Page 5 and 6:
5. PROPOSED REFORMS The proposed ma
- Page 7 and 8:
Projects Identified for Implementat
- Page 9 and 10:
. - ii - Final Report: Thiruvathipu
- Page 11 and 12:
. - iv - Final Report: Thiruvathipu
- Page 13 and 14:
LLIISSTT OFF FFIIGURREESS . - vi -
- Page 15 and 16:
. - viii - Final Report: Thiruvathi
- Page 17 and 18:
Chapter ñ 1 Final Report: Thiruvat
- Page 19 and 20:
Chapter ñ 1 Final Report: Thiruvat
- Page 21 and 22:
Chapter ñ 1 Final Report: Thiruvat
- Page 23 and 24:
Chapter ñ 2 Final Report: Thiruvat
- Page 25 and 26:
Chapter ñ 2 Final Report: Thiruvat
- Page 27 and 28:
Chapter ñ 3 Final Report: Thiruvat
- Page 29 and 30:
Chapter ñ 3 Final Report: Thiruvat
- Page 31 and 32:
Chapter ñ 4 Final Report: Thiruvat
- Page 33 and 34:
Chapter ñ 4 Final Report: Thiruvat
- Page 35 and 36:
Chapter ñ 5 Final Report: Thiruvat
- Page 37 and 38:
Chapter ñ 5 Final Report: Thiruvat
- Page 39 and 40:
Chapter ñ6 Final Report: Thiruvath
- Page 41 and 42:
Chapter ñ6 Final Report: Thiruvath
- Page 43 and 44:
Chapter ñ7 Final Report: Thiruvath
- Page 45 and 46:
Chapter ñ7 Final Report: Thiruvath
- Page 47 and 48:
Chapter ñ7 Final Report: Thiruvath
- Page 49 and 50:
Chapter ñ8 Final Report: Thiruvath
- Page 51 and 52:
Chapter ñ8 Final Report: Thiruvath
- Page 53 and 54:
Chapter ñ8 Final Report: Thiruvath
- Page 55 and 56:
Chapter ñ8 Final Report: Thiruvath
- Page 57 and 58:
Chapter ñ8 Final Report: Thiruvath
- Page 59 and 60:
Chapter ñ8 Final Report: Thiruvath
- Page 61 and 62:
Chapter ñ8 Final Report: Thiruvath
- Page 63 and 64:
Chapter ñ8 Final Report: Thiruvath
- Page 65 and 66:
Chapter ñ9 Final Report: Thiruvath
- Page 67 and 68:
Chapter ñ9 Final Report: Thiruvath
- Page 69 and 70:
Chapter ñ9 Final Report: Thiruvath
- Page 71 and 72:
Chapter ñ9 Final Report: Thiruvath
- Page 73 and 74:
Chapter ñ9 Final Report: Thiruvath
- Page 75 and 76:
Chapter ñ9 Final Report: Thiruvath
- Page 77 and 78:
Chapter ñ9 Final Report: Thiruvath
- Page 79 and 80:
Chapter ñ10 Final Report: Thiruvat
- Page 81 and 82:
Chapter ñ10 Final Report: Thiruvat
- Page 83 and 84:
Chapter ñ10 Final Report: Thiruvat
- Page 85 and 86:
Chapter ñ10 Final Report: Thiruvat
- Page 87 and 88:
Chapter ñ10 Final Report: Thiruvat
- Page 89 and 90:
Chapter ñ10 Final Report: Thiruvat
- Page 91 and 92:
Chapter ñ11 Final Report: Thiruvat
- Page 93 and 94:
Chapter ñ11 Final Report: Thiruvat
- Page 95 and 96:
Chapter ñ12 Final Report: Thiruvat
- Page 97 and 98:
Chapter ñ12 Final Report: Thiruvat
- Page 99 and 100:
Chapter ñ12 Final Report: Thiruvat
- Page 101 and 102:
Chapter ñ12 Final Report: Thiruvat
- Page 103 and 104:
Chapter ñ12 Final Report: Thiruvat
- Page 105 and 106:
Chapter ñ12 Final Report: Thiruvat
- Page 107 and 108:
Chapter ñ12 Final Report: Thiruvat
- Page 109 and 110:
Chapter ñ12 Final Report: Thiruvat
- Page 111 and 112:
Chapter ñ12 Final Report: Thiruvat
- Page 113 and 114:
Chapter ñ13 Final Report: Thiruvat
- Page 115 and 116:
Chapter ñ13 Final Report: Thiruvat
- Page 117 and 118:
Chapter ñ13 Final Report: Thiruvat
- Page 119 and 120:
Chapter ñ14 Final Report: Thiruvat
- Page 121 and 122: Chapter ñ14 Final Report: Thiruvat
- Page 123 and 124: Chapter ñ14 Final Report: Thiruvat
- Page 125 and 126: Chapter ñ14 Final Report: Thiruvat
- Page 127 and 128: Chapter ñ14 Final Report: Thiruvat
- Page 129 and 130: Chapter ñ14 Final Report: Thiruvat
- Page 131 and 132: Chapter ñ14 Final Report: Thiruvat
- Page 133 and 134: Chapter ñ14 Final Report: Thiruvat
- Page 135 and 136: Chapter ñ14 Final Report: Thiruvat
- Page 137 and 138: Chapter - 14 Final Report: Thiruvat
- Page 139 and 140: Chapter - 14 Final Report: Thiruvat
- Page 141 and 142: Chapter - 14 Final Report: Thiruvat
- Page 143 and 144: Chapter-14 Final Report: Thiruvathi
- Page 145 and 146: Chapter-14 Final Report: Thiruvathi
- Page 147 and 148: Annexure Final Report: Thiruvathipu
- Page 149 and 150: Annexure Final Report: Thiruvathipu
- Page 151 and 152: Annexure Final Report: Thiruvathipu
- Page 153 and 154: Annexure Final Report: Thiruvathipu
- Page 155 and 156: Annexure Final Report: Thiruvathipu
- Page 157 and 158: Annexure Final Report: Thiruvathipu
- Page 159 and 160: Annexure Final Report: Thiruvathipu
- Page 161 and 162: Annexure Final Report: Thiruvathipu
- Page 163 and 164: Annexure Final Report: Thiruvathipu
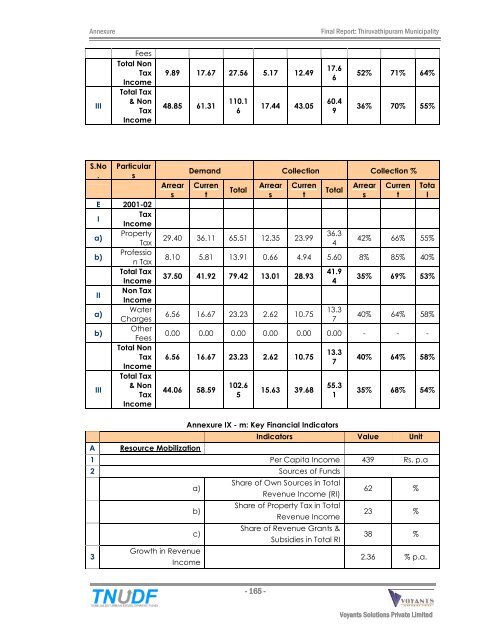
- Page 165 and 166: Annexure Final Report: Thiruvathipu
- Page 167 and 168: Annexure Final Report: Thiruvathipu
- Page 169 and 170: Annexure ` Final Report: Thiruvathi
- Page 171: Annexure Final Report: Thiruvathipu
- Page 175 and 176: Annexure Final Report: Thiruvathipu
- Page 177: Annexure Final Report: Thiruvathipu