

City Development Plan - Municipal
City Development Plan - Municipal
City Development Plan - Municipal

You also want an ePaper? Increase the reach of your titles
YUMPU automatically turns print PDFs into web optimized ePapers that Google loves.
Chapter ñ9 Final Report: Thiruvathipuram <strong>Municipal</strong>ity<br />
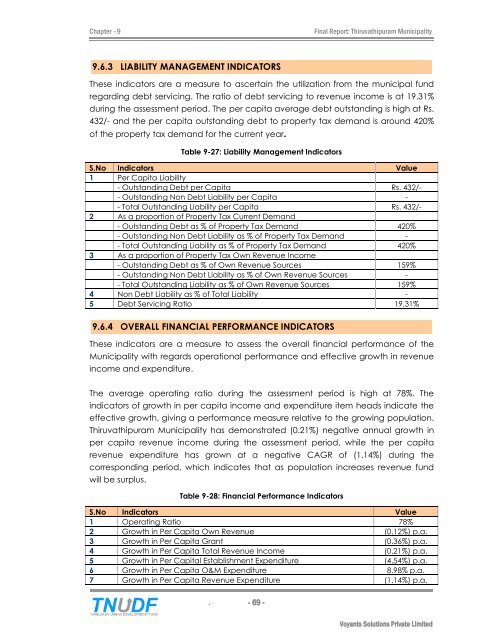
9.6.3 LIABILITY MANAGEMENT INDICATORS<br />
These indicators are a measure to ascertain the utilization from the municipal fund<br />
regarding debt servicing. The ratio of debt servicing to revenue income is at 19.31%<br />
during the assessment period. The per capita average debt outstanding is high at Rs.<br />
432/- and the per capita outstanding debt to property tax demand is around 420%<br />
of the property tax demand for the current year.<br />
Table 9-27: Liability Management Indicators<br />
S.No Indicators Value<br />
1 Per Capita Liability<br />
- Outstanding Debt per Capita Rs. 432/-<br />
- Outstanding Non Debt Liability per Capita -<br />
- Total Outstanding Liability per Capita Rs. 432/-<br />
2 As a proportion of Property Tax Current Demand<br />
- Outstanding Debt as % of Property Tax Demand 420%<br />
- Outstanding Non Debt Liability as % of Property Tax Demand -<br />
- Total Outstanding Liability as % of Property Tax Demand 420%<br />
3 As a proportion of Property Tax Own Revenue Income<br />
- Outstanding Debt as % of Own Revenue Sources 159%<br />
- Outstanding Non Debt Liability as % of Own Revenue Sources -<br />
- Total Outstanding Liability as % of Own Revenue Sources 159%<br />
4 Non Debt Liability as % of Total Liability -<br />
5 Debt Servicing Ratio 19.31%<br />
9.6.4 OVERALL FINANCIAL PERFORMANCE INDICATORS<br />
These indicators are a measure to assess the overall financial performance of the<br />
<strong>Municipal</strong>ity with regards operational performance and effective growth in revenue<br />
income and expenditure.<br />
The average operating ratio during the assessment period is high at 78%. The<br />
indicators of growth in per capita income and expenditure item heads indicate the<br />
effective growth, giving a performance measure relative to the growing population.<br />
Thiruvathipuram <strong>Municipal</strong>ity has demonstrated (0.21%) negative annual growth in<br />
per capita revenue income during the assessment period, while the per capita<br />
revenue expenditure has grown at a negative CAGR of (1.14%) during the<br />
corresponding period, which indicates that as population increases revenue fund<br />
will be surplus.<br />
Table 9-28: Financial Performance Indicators<br />
S.No Indicators Value<br />
1 Operating Ratio 78%<br />
2 Growth in Per Capita Own Revenue (0.12%) p.a.<br />
3 Growth in Per Capita Grant (0.36%) p.a.<br />
4 Growth in Per Capita Total Revenue Income (0.21%) p.a.<br />
5 Growth in Per Capital Establishment Expenditure (4.54%) p.a.<br />
6 Growth in Per Capita O&M Expenditure 8.98% p.a.<br />
7 Growth in Per Capita Revenue Expenditure (1.14%) p.a.<br />
. - 69 -<br />
Voyants Solutions Private Limited


