

City Development Plan - Municipal
City Development Plan - Municipal
City Development Plan - Municipal

Create successful ePaper yourself
Turn your PDF publications into a flip-book with our unique Google optimized e-Paper software.
Chapter ñ9 Final Report: Thiruvathipuram <strong>Municipal</strong>ity<br />
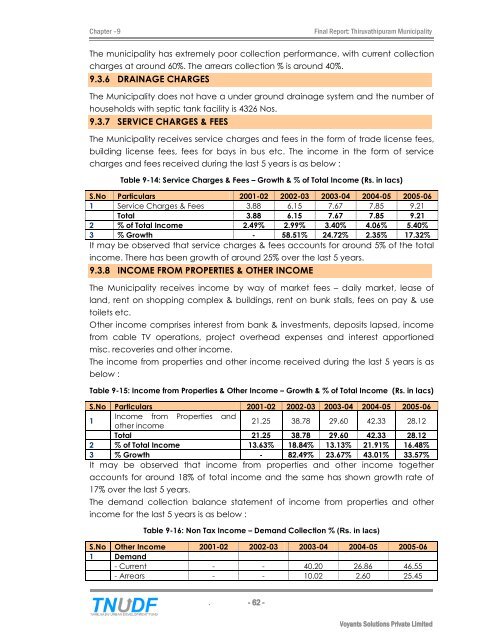
The municipality has extremely poor collection performance, with current collection<br />
charges at around 60%. The arrears collection % is around 40%.<br />
9.3.6 DRAINAGE CHARGES<br />
The <strong>Municipal</strong>ity does not have a under ground drainage system and the number of<br />
households with septic tank facility is 4326 Nos.<br />
9.3.7 SERVICE CHARGES & FEES<br />
The <strong>Municipal</strong>ity receives service charges and fees in the form of trade license fees,<br />
building license fees, fees for bays in bus etc. The income in the form of service<br />
charges and fees received during the last 5 years is as below :<br />
Table 9-14: Service Charges & Fees ñ Growth & % of Total Income (Rs. in lacs)<br />
S.No Particulars 2001-02 2002-03 2003-04 2004-05 2005-06<br />
1 Service Charges & Fees 3.88 6.15 7.67 7.85 9.21<br />
Total 3.88 6.15 7.67 7.85 9.21<br />
2 % of Total Income 2.49% 2.99% 3.40% 4.06% 5.40%<br />
3 % Growth - 58.51% 24.72% 2.35% 17.32%<br />
It may be observed that service charges & fees accounts for around 5% of the total<br />
income. There has been growth of around 25% over the last 5 years.<br />
9.3.8 INCOME FROM PROPERTIES & OTHER INCOME<br />
The <strong>Municipal</strong>ity receives income by way of market fees ñ daily market, lease of<br />
land, rent on shopping complex & buildings, rent on bunk stalls, fees on pay & use<br />
toilets etc.<br />
Other income comprises interest from bank & investments, deposits lapsed, income<br />
from cable TV operations, project overhead expenses and interest apportioned<br />
misc. recoveries and other income.<br />
The income from properties and other income received during the last 5 years is as<br />
below :<br />
Table 9-15: Income from Properties & Other Income ñ Growth & % of Total Income (Rs. in lacs)<br />
S.No Particulars 2001-02 2002-03 2003-04 2004-05 2005-06<br />
1<br />
Income from<br />
other income<br />
Properties and<br />
21.25 38.78 29.60 42.33 28.12<br />
Total 21.25 38.78 29.60 42.33 28.12<br />
2 % of Total Income 13.63% 18.84% 13.13% 21.91% 16.48%<br />
3 % Growth - 82.49% 23.67% 43.01% 33.57%<br />
It may be observed that income from properties and other income together<br />
accounts for around 18% of total income and the same has shown growth rate of<br />
17% over the last 5 years.<br />
The demand collection balance statement of income from properties and other<br />
income for the last 5 years is as below :<br />
Table 9-16: Non Tax Income ñ Demand Collection % (Rs. in lacs)<br />
S.No Other Income 2001-02 2002-03 2003-04 2004-05 2005-06<br />
1 Demand<br />
- Current - - 40.20 26.86 46.55<br />
- Arrears - - 10.02 2.60 25.45<br />
. - 62 -<br />
Voyants Solutions Private Limited


