

City Development Plan - Municipal
City Development Plan - Municipal
City Development Plan - Municipal

Create successful ePaper yourself
Turn your PDF publications into a flip-book with our unique Google optimized e-Paper software.
Chapter ñ9 Final Report: Thiruvathipuram <strong>Municipal</strong>ity<br />
Total - - 50.22 29.46 72.00<br />
2 Collection<br />
- Current - - 38.60 25.97 37.12<br />
- Arrears - - 9.02 2.47 24.86<br />
Total - - 47.92 28.44 61.98<br />
3 Collection %<br />
- Current - - 96% 97% 80%<br />
- Arrears - - 90% 95% 98%<br />
Total - - 95% 97% 86%<br />
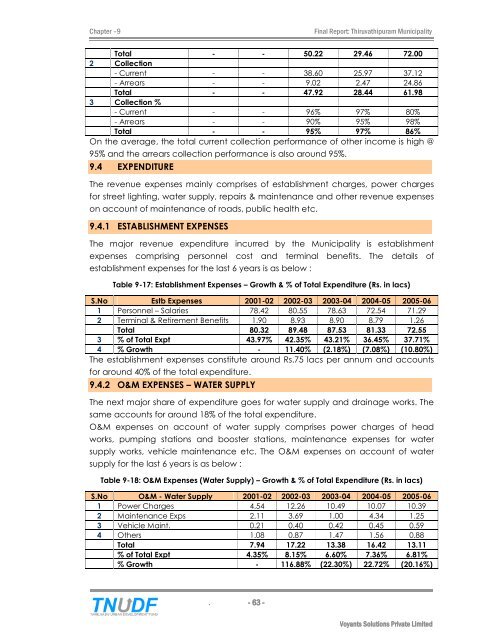
On the average, the total current collection performance of other income is high @<br />
95% and the arrears collection performance is also around 95%.<br />
9.4 EXPENDITURE<br />
The revenue expenses mainly comprises of establishment charges, power charges<br />
for street lighting, water supply, repairs & maintenance and other revenue expenses<br />
on account of maintenance of roads, public health etc.<br />
9.4.1 ESTABLISHMENT EXPENSES<br />
The major revenue expenditure incurred by the <strong>Municipal</strong>ity is establishment<br />
expenses comprising personnel cost and terminal benefits. The details of<br />
establishment expenses for the last 6 years is as below :<br />
Table 9-17: Establishment Expenses ñ Growth & % of Total Expenditure (Rs. in lacs)<br />
S.No Estb Expenses 2001-02 2002-03 2003-04 2004-05 2005-06<br />
1 Personnel ñ Salaries 78.42 80.55 78.63 72.54 71.29<br />
2 Terminal & Retirement Benefits 1.90 8.93 8.90 8.79 1.26<br />
Total 80.32 89.48 87.53 81.33 72.55<br />
3 % of Total Expt 43.97% 42.35% 43.21% 36.45% 37.71%<br />
4 % Growth - 11.40% (2.18%) (7.08%) (10.80%)<br />
The establishment expenses constitute around Rs.75 lacs per annum and accounts<br />
for around 40% of the total expenditure.<br />
9.4.2 O&M EXPENSES ñ WATER SUPPLY<br />
The next major share of expenditure goes for water supply and drainage works. The<br />
same accounts for around 18% of the total expenditure.<br />
O&M expenses on account of water supply comprises power charges of head<br />
works, pumping stations and booster stations, maintenance expenses for water<br />
supply works, vehicle maintenance etc. The O&M expenses on account of water<br />
supply for the last 6 years is as below :<br />
Table 9-18: O&M Expenses (Water Supply) ñ Growth & % of Total Expenditure (Rs. in lacs)<br />
S.No O&M - Water Supply 2001-02 2002-03 2003-04 2004-05 2005-06<br />
1 Power Charges 4.54 12.26 10.49 10.07 10.39<br />
2 Maintenance Exps 2.11 3.69 1.00 4.34 1.25<br />
3 Vehicle Maint. 0.21 0.40 0.42 0.45 0.59<br />
4 Others 1.08 0.87 1.47 1.56 0.88<br />
Total 7.94 17.22 13.38 16.42 13.11<br />
% of Total Expt 4.35% 8.15% 6.60% 7.36% 6.81%<br />
% Growth - 116.88% (22.30%) 22.72% (20.16%)<br />
. - 63 -<br />
Voyants Solutions Private Limited


