

City Development Plan - Municipal
City Development Plan - Municipal
City Development Plan - Municipal

Create successful ePaper yourself
Turn your PDF publications into a flip-book with our unique Google optimized e-Paper software.
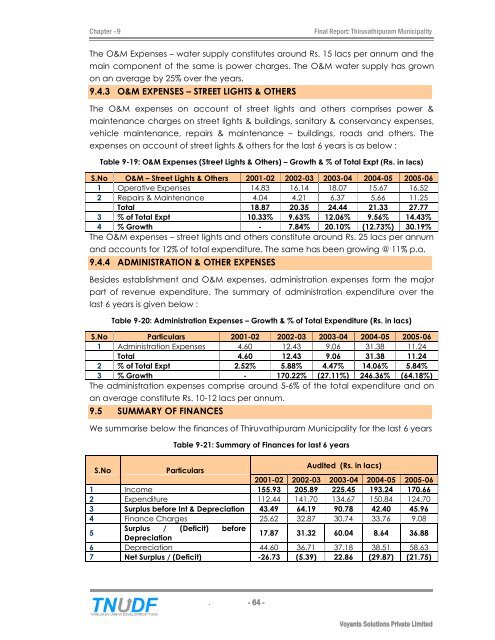
Chapter ñ9 Final Report: Thiruvathipuram <strong>Municipal</strong>ity<br />
The O&M Expenses ñ water supply constitutes around Rs. 15 lacs per annum and the<br />
main component of the same is power charges. The O&M water supply has grown<br />
on an average by 25% over the years.<br />
9.4.3 O&M EXPENSES ñ STREET LIGHTS & OTHERS<br />
The O&M expenses on account of street lights and others comprises power &<br />
maintenance charges on street lights & buildings, sanitary & conservancy expenses,<br />
vehicle maintenance, repairs & maintenance ñ buildings, roads and others. The<br />
expenses on account of street lights & others for the last 6 years is as below :<br />
Table 9-19: O&M Expenses (Street Lights & Others) ñ Growth & % of Total Expt (Rs. in lacs)<br />
S.No O&M ñ Street Lights & Others 2001-02 2002-03 2003-04 2004-05 2005-06<br />
1 Operative Expenses 14.83 16.14 18.07 15.67 16.52<br />
2 Repairs & Maintenance 4.04 4.21 6.37 5.66 11.25<br />
Total 18.87 20.35 24.44 21.33 27.77<br />
3 % of Total Expt 10.33% 9.63% 12.06% 9.56% 14.43%<br />
4 % Growth - 7.84% 20.10% (12.73%) 30.19%<br />
The O&M expenses ñ street lights and others constitute around Rs. 25 lacs per annum<br />
and accounts for 12% of total expenditure. The same has been growing @ 11% p.a.<br />
9.4.4 ADMINISTRATION & OTHER EXPENSES<br />
Besides establishment and O&M expenses, administration expenses form the major<br />
part of revenue expenditure. The summary of administration expenditure over the<br />
last 6 years is given below :<br />
Table 9-20: Administration Expenses ñ Growth & % of Total Expenditure (Rs. in lacs)<br />
S.No Particulars 2001-02 2002-03 2003-04 2004-05 2005-06<br />
1 Administration Expenses 4.60 12.43 9.06 31.38 11.24<br />
Total 4.60 12.43 9.06 31.38 11.24<br />
2 % of Total Expt 2.52% 5.88% 4.47% 14.06% 5.84%<br />
3 % Growth - 170.22% (27.11%) 246.36% (64.18%)<br />
The administration expenses comprise around 5-6% of the total expenditure and on<br />
an average constitute Rs. 10-12 lacs per annum.<br />
9.5 SUMMARY OF FINANCES<br />
We summarise below the finances of Thiruvathipuram <strong>Municipal</strong>ity for the last 6 years<br />
Table 9-21: Summary of Finances for last 6 years<br />
S.No Particulars<br />
Audited (Rs. in lacs)<br />
2001-02 2002-03 2003-04 2004-05 2005-06<br />
1 Income 155.93 205.89 225.45 193.24 170.66<br />
2 Expenditure 112.44 141.70 134.67 150.84 124.70<br />
3 Surplus before Int & Depreciation 43.49 64.19 90.78 42.40 45.96<br />
4 Finance Charges 25.62 32.87 30.74 33.76 9.08<br />
5<br />
Surplus /<br />
Depreciation<br />
(Deficit) before<br />
17.87 31.32 60.04 8.64 36.88<br />
6 Depreciation 44.60 36.71 37.18 38.51 58.63<br />
7 Net Surplus / (Deficit) -26.73 (5.39) 22.86 (29.87) (21.75)<br />
. - 64 -<br />
Voyants Solutions Private Limited


