CFHT operating manual - Homepage Usask
CFHT operating manual - Homepage Usask
CFHT operating manual - Homepage Usask

You also want an ePaper? Increase the reach of your titles
YUMPU automatically turns print PDFs into web optimized ePapers that Google loves.
ESPaDOnS: spectral response and global efficiency http://webast.ast.obs-mip.fr/magnetisme/espadons_new/efficiency.html<br />
ESPaDOnS<br />
Spectral response and global efficiency<br />
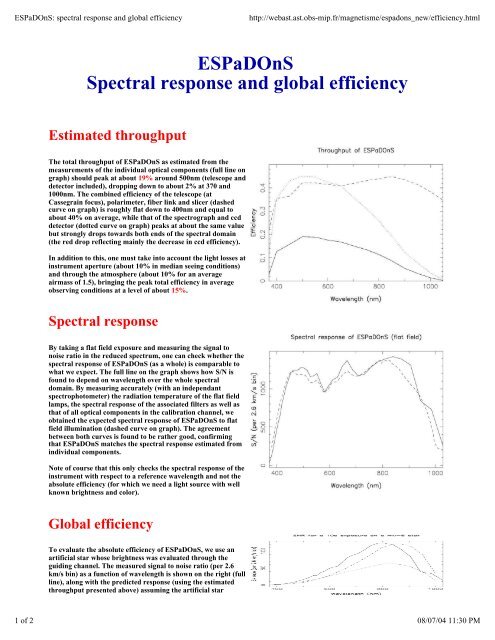
Estimated throughput<br />
The total throughput of ESPaDOnS as estimated from the<br />
measurements of the individual optical components (full line on<br />
graph) should peak at about 19% around 500nm (telescope and<br />
detector included), dropping down to about 2% at 370 and<br />
1000nm. The combined efficiency of the telescope (at<br />
Cassegrain focus), polarimeter, fiber link and slicer (dashed<br />
curve on graph) is roughly flat down to 400nm and equal to<br />
about 40% on average, while that of the spectrograph and ccd<br />
detector (dotted curve on graph) peaks at about the same value<br />
but strongly drops towards both ends of the spectral domain<br />
(the red drop reflecting mainly the decrease in ccd efficiency).<br />
In addition to this, one must take into account the light losses at<br />
instrument aperture (about 10% in median seeing conditions)<br />
and through the atmosphere (about 10% for an average<br />
airmass of 1.5), bringing the peak total efficiency in average<br />
observing conditions at a level of about 15%.<br />
Spectral response<br />
By taking a flat field exposure and measuring the signal to<br />
noise ratio in the reduced spectrum, one can check whether the<br />
spectral response of ESPaDOnS (as a whole) is comparable to<br />
what we expect. The full line on the graph shows how S/N is<br />
found to depend on wavelength over the whole spectral<br />
domain. By measuring accurately (with an independant<br />
spectrophotometer) the radiation temperature of the flat field<br />
lamps, the spectral response of the associated filters as well as<br />
that of all optical components in the calibration channel, we<br />
obtained the expected spectral response of ESPaDOnS to flat<br />
field illumination (dashed curve on graph). The agreement<br />
between both curves is found to be rather good, confirming<br />
that ESPaDOnS matches the spectral response estimated from<br />
individual components.<br />
Note of course that this only checks the spectral response of the<br />
instrument with respect to a reference wavelength and not the<br />
absolute efficiency (for which we need a light source with well<br />
known brightness and color).<br />
Global efficiency<br />
To evaluate the absolute efficiency of ESPaDOnS, we use an<br />
artificial star whose brightness was evaluated through the<br />
guiding channel. The measured signal to noise ratio (per 2.6<br />
km/s bin) as a function of wavelength is shown on the right (full<br />
line), along with the predicted response (using the estimated<br />
throughput presented above) assuming the artificial star<br />
1 of 2 08/07/04 11:30 PM