CFHT operating manual - Homepage Usask
CFHT operating manual - Homepage Usask
CFHT operating manual - Homepage Usask

Create successful ePaper yourself
Turn your PDF publications into a flip-book with our unique Google optimized e-Paper software.
ESPaDOnS: temperature and pressure monitoring http://webast.ast.obs-mip.fr/magnetisme/espadons_new/sensors.html<br />
ESPaDOnS<br />
temperature and pressure monitoring<br />
Temperature monitoring<br />
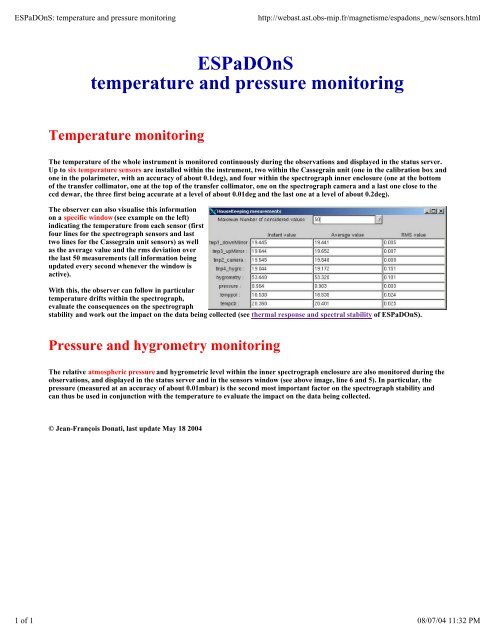
The temperature of the whole instrument is monitored continuously during the observations and displayed in the status server.<br />
Up to six temperature sensors are installed within the instrument, two within the Cassegrain unit (one in the calibration box and<br />
one in the polarimeter, with an accuracy of about 0.1deg), and four within the spectrograph inner enclosure (one at the bottom<br />
of the transfer collimator, one at the top of the transfer collimator, one on the spectrograph camera and a last one close to the<br />
ccd dewar, the three first being accurate at a level of about 0.01deg and the last one at a level of about 0.2deg).<br />
The observer can also visualise this information<br />
on a specific window (see example on the left)<br />
indicating the temperature from each sensor (first<br />
four lines for the spectrograph sensors and last<br />
two lines for the Cassegrain unit sensors) as well<br />
as the average value and the rms deviation over<br />
the last 50 measurements (all information being<br />
updated every second whenever the window is<br />
active).<br />
With this, the observer can follow in particular<br />
temperature drifts within the spectrograph,<br />
evaluate the consequences on the spectrograph<br />
stability and work out the impact on the data being collected (see thermal response and spectral stability of ESPaDOnS).<br />
Pressure and hygrometry monitoring<br />
The relative atmospheric pressure and hygrometric level within the inner spectrograph enclosure are also monitored during the<br />
observations, and displayed in the status server and in the sensors window (see above image, line 6 and 5). In particular, the<br />
pressure (measured at an accuracy of about 0.01mbar) is the second most important factor on the spectrograph stability and<br />
can thus be used in conjunction with the temperature to evaluate the impact on the data being collected.<br />
© Jean-François Donati, last update May 18 2004<br />
1 of 1 08/07/04 11:32 PM