CFHT operating manual - Homepage Usask
CFHT operating manual - Homepage Usask
CFHT operating manual - Homepage Usask

You also want an ePaper? Increase the reach of your titles
YUMPU automatically turns print PDFs into web optimized ePapers that Google loves.
ESPaDOnS: data reduction routines http://webast.ast.obs-mip.fr/magnetisme/espadons_new/reduction.html<br />
distance from order center only (for the slit shape, assumed to be identical for all orders).<br />
The previous two pieces of information are then merged together to derive a new curvilinear coordinate system for each order,<br />
with one coordinate being the distance from order center and the second one the distance along the order from the slit position<br />
at the first pixel of the order. The comparison frame is then extracted within this curvilinear system to obtain a ThAr spectrum,<br />
with flux as a function of distance along each order.<br />
Finally, this ThAr spectrum is used to derive automatically the details of the wavelength to pixel relationship at order centre (ie<br />
dispersion relation); to achieve this, the code starts by searching, fitting and identifying thorium lines iteratively in each order<br />
with no human help, then fits with a 2d polynome the position of all lines successfully identified (up to several thousands<br />
typically) as a function of both order number and distance along the order. With this scheme, each line effectively participates,<br />
not only in the wavelength calibration of a single order, but also in the wavelength calibration of all orders simultaneously,<br />
making this process very robust and accurate. The typical rms precision of the derived wavelength calibration at any given pixel<br />
is about 150m/s.<br />
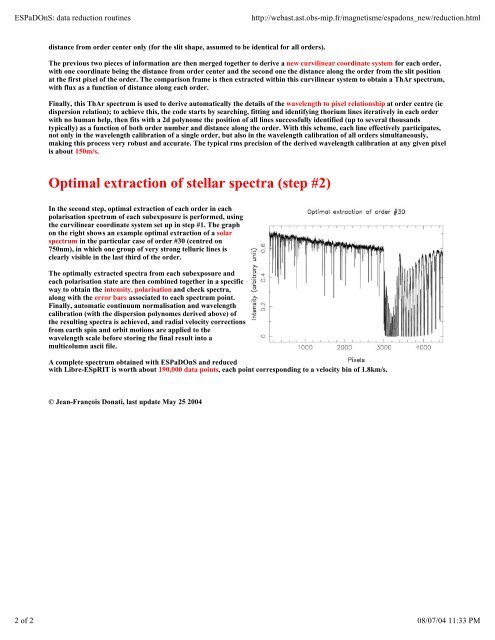
Optimal extraction of stellar spectra (step #2)<br />
In the second step, optimal extraction of each order in each<br />
polarisation spectrum of each subexposure is performed, using<br />
the curvilinear coordinate system set up in step #1. The graph<br />
on the right shows an example optimal extraction of a solar<br />
spectrum in the particular case of order #30 (centred on<br />
750nm), in which one group of very strong telluric lines is<br />
clearly visible in the last third of the order.<br />
The optimally extracted spectra from each subexposure and<br />
each polarisation state are then combined together in a specific<br />
way to obtain the intensity, polarisation and check spectra,<br />
along with the error bars associated to each spectrum point.<br />
Finally, automatic continuum normalisation and wavelength<br />
calibration (with the dispersion polynomes derived above) of<br />
the resulting spectra is achieved, and radial velocity corrections<br />
from earth spin and orbit motions are applied to the<br />
wavelength scale before storing the final result into a<br />
multicolumn ascii file.<br />
A complete spectrum obtained with ESPaDOnS and reduced<br />
with Libre-ESpRIT is worth about 190,000 data points, each point corresponding to a velocity bin of 1.8km/s.<br />
© Jean-François Donati, last update May 25 2004<br />
2 of 2 08/07/04 11:33 PM