Ecological and anthropogenic covariates ... - GANGAPEDIA
Ecological and anthropogenic covariates ... - GANGAPEDIA
Ecological and anthropogenic covariates ... - GANGAPEDIA

You also want an ePaper? Increase the reach of your titles
YUMPU automatically turns print PDFs into web optimized ePapers that Google loves.
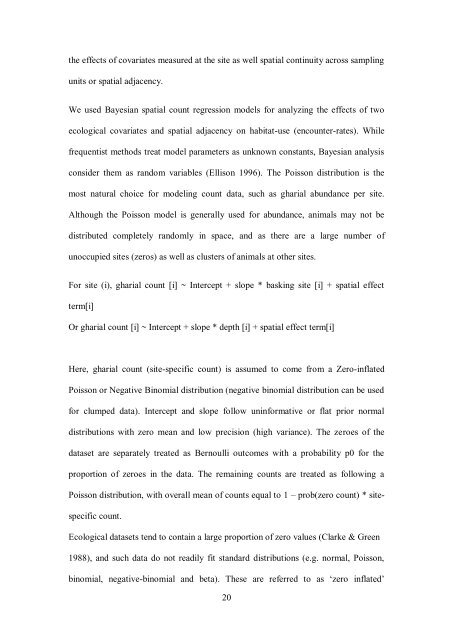
the effects of <strong>covariates</strong> measured at the site as well spatial continuity across sampling<br />
units or spatial adjacency.<br />
We used Bayesian spatial count regression models for analyzing the effects of two<br />
ecological <strong>covariates</strong> <strong>and</strong> spatial adjacency on habitat-use (encounter-rates). While<br />
frequentist methods treat model parameters as unknown constants, Bayesian analysis<br />
consider them as r<strong>and</strong>om variables (Ellison 1996). The Poisson distribution is the<br />
most natural choice for modeling count data, such as gharial abundance per site.<br />
Although the Poisson model is generally used for abundance, animals may not be<br />
distributed completely r<strong>and</strong>omly in space, <strong>and</strong> as there are a large number of<br />
unoccupied sites (zeros) as well as clusters of animals at other sites.<br />
For site (i), gharial count [i] ~ Intercept + slope * basking site [i] + spatial effect<br />
term[i]<br />
Or gharial count [i] ~ Intercept + slope * depth [i] + spatial effect term[i]<br />
Here, gharial count (site-specific count) is assumed to come from a Zero-inflated<br />
Poisson or Negative Binomial distribution (negative binomial distribution can be used<br />
for clumped data). Intercept <strong>and</strong> slope follow uninformative or flat prior normal<br />
distributions with zero mean <strong>and</strong> low precision (high variance). The zeroes of the<br />
dataset are separately treated as Bernoulli outcomes with a probability p0 for the<br />
proportion of zeroes in the data. The remaining counts are treated as following a<br />
Poisson distribution, with overall mean of counts equal to 1 – prob(zero count) * site-<br />
specific count.<br />
<strong>Ecological</strong> datasets tend to contain a large proportion of zero values (Clarke & Green<br />
1988), <strong>and</strong> such data do not readily fit st<strong>and</strong>ard distributions (e.g. normal, Poisson,<br />
binomial, negative-binomial <strong>and</strong> beta). These are referred to as ‘zero inflated’<br />
20